
The quest for IELTS Band 7.0: Investigating English language proficiency development of international students at an Australian university
Official IELTS research report on Impact and Washback - Test preparation; Impact and Washback - Use of test scores, published in 2012.
Abstract
Employers in English-speaking countries are increasingly requiring evidence from non-English speaking background professionals seeking employment in fields for which they are academically qualified that they can demonstrate a high level of proficiency in English, such as is represented by an IELTS band score of 7.0. The purpose of this study was to investigate the likelihood of non-English speaking background undergraduate students who had met the English language proficiency requirements for study at an Australian university on the basis of an Overall score of 6.5 in the Academic module of the IELTS Test with a 6.0 in Writing, being able to gain an Overall score of at least 7.0, with at least 7.0 in all components of the Academic version of the Test towards the end of their period of study.
Forty undergraduate students from three different faculties were recruited for the study. Using official IELTS Test results obtained by the students at the beginning of their study in Australia and towards the end, as well as interviews with most of the students, the study investigated patterns of improvement, as well as lack of improvement among the 40 students.
While most of the students in the study did achieve a higher score in the IELTS Test taken towards the end of their study in Australia, only a small number were able to achieve an Overall score of 7.0, with at least 7.0 in all components of the Test. The greatest improvements were made in Listening and Reading, while improvements in Writing and Speaking were relatively small and were not statistically significant. There was considerable variation among the students in the amount of improvement made, with a tendency for the younger students who had a larger time gap between the initial IELTS Test and the later Test being most likely to improve. Other factors such as gender and language background also appeared to have some influence.
The findings have relevance to a wide range of stakeholders involved with the IELTS Test. In particular, the findings caution both institutions and students against assuming that a student who achieves a score of 6.5 in an IELTS Test when entering university is likely to achieve a score of 7.0 after several years of study in the medium of English.
1 BACKGROUND AND RATIONALE
In 1999, it became possible for international students graduating from Australian universities to apply for Skilled Independent Residence visas without first having to return home. Since then, the issue of the English language proficiency of non-English speaking background (NESB) international students graduating from Australian universities has been a focus of media attention. Perceived inadequacy in the use of English by many of these graduates, as evidenced by their failure to find employment in the occupations for which they were academically qualified, led to the granting of these onshore visas being dependent on the candidates providing evidence of proficiency in English in the form of a score obtained on a standardised test in 2004. An acceptable score was considered to be a score of at least 6.0 in either the General Training or Academic module of the IELTS Test. In 2007, the IELTS requirement for the Skilled Independent Residence Visa subclass 885 (applicable for international students who had graduated from an Australian university onshore) was raised to an Overall score of 7.0, with 7.0 in each component of the Test. In November 2010 (after the research discussed in this report was completed), changed visa requirements meant that even this level of proficiency was not likely to be sufficient for most international student graduates to be successful in their applications. To gain the maximum points for English language proficiency, the visa applicants needed to have achieved an Overall score of 8.0, with 8.0 in each component of the Test.
In 2010, the Nursing and Midwifery Board of Australia raised the English language proficiency requirement for registration as a nurse to an Overall score of 7.0 in the Academic module of the IELTS Test, with 7.0 in each of the components that comprise the Test. Other professional registration boards have also instituted an IELTS requirement (discussed in Merrifield, 2008). According to information on the IELTS website, as of November 2010, 48 professional associations in Australia identified an IELTS requirement (International English Language Testing System, 2010a). In most cases, the requirement is a score of 7.0. Although little research has been conducted into the relevance of this score for professional employment, an IELTS score of 7.0 is fast becoming instituted as the standard to which all NESB candidates seeking professional employment in Australia should aim.
This concern with the English language proficiency and employment readiness of NESB international students graduating from Australian universities has coincided with a more general concern in higher education regarding the English language proficiency of all graduates. In a study commissioned by the Department of Education, Employment and Workplace Relations (DEEWR) in 2009, the authors noted that the employment outcomes of international students seeking employment in Australia were not as good as those of their Australian domestic counterparts; in particular, they faced ‘greater challenges in finding full-time employment after graduation’ (Arkoudis, Hawthorne, Baik, Hawthorne, O’Loughlin, Leach and Bexley, 2009, p 3). While Arkoudis et al noted that a lack of English language proficiency was not the only factor leading to the poorer employment outcomes, it was certainly one of the factors. To date, however, apart from Humphreys and Mousavi’s (2010) study of exit IELTS Test results at Griffith University and the research of O’Loughlin and Arkoudis (2009) investigating IELTS score gains at the University of Melbourne, there has not been a great deal of research that has been specifically focused on the rate of improvement in English language proficiency of international students near completion of their higher education degree programs in Australia as measured by the IELTS Test.
Most research into IELTS score gains has focused on candidates with lower levels of English language proficiency who have been enrolled in English language study programs preparing them to enrol in university courses (Elder and O’Loughlin, 2003; Green, 2004). Given that the IELTS Test was
developed with the specific purpose of assessing a student’s readiness to commence English-medium higher education study (Davies, 2008), this focus on lower levels of proficiency is not surprising. Score gains in the Writing component of the Test have been the main focus of much of this research. Green (2004) presents the findings of four studies, all of which involved candidates whose average initial score was 5.0 and who were undertaking periods of English language instruction of not more than three months. Average score gains in these four studies were less than half a band. In these studies, the candidates who achieved a score of 5.0 or below on the first test tended to improve on the second, while those achieving a score of 7.0 tended to receive a lower score on the second test, and those who first achieved a score of 6.0 tended to remain at the same level. Country of origin, age and affective factors, such as self-confidence and integration into the host culture, also appeared to have an impact on score shift over time. Other research reported by Green (2005, pp 55-56) found that candidates of East Asian origin made less improvement overall between two administrations of the IELTS Test over a period of pre-sessional English language study than did other candidates with European backgrounds or backgrounds the researchers categorised as ‘other’.
The IELTS score that Australian universities typically consider adequate for commencement of ‘linguistically less demanding’ courses is 6.5, with a score of 6.0 in Writing; although for courses in the Humanities, Teacher Education, Medicine and Law, a higher score may be required. However, there has been an unwritten assumption that, upon graduation, NESB international students will have developed their English language proficiency sufficiently to be employable as professionals, which the Australian Department of Immigration and Citizenship (DIAC) considered, at the time this research was conducted, to be the degree of proficiency represented by an IELTS Overall score of at least 7.0, with scores of at least 7.0 in each of the four components: Listening, Reading, Writing and Speaking. An IELTS candidate who achieves a score of 7.0 is described as being a ‘good user’ of English, someone who ‘[h]as operational command of the language, though with occasional inaccuracies, inappropriacies and misunderstandings in some situations’ (International English Language Testing System, 2009, p 3). As previously noted, since this research was conducted, DIAC has changed the points system for the Skilled Independent Residence Visa subclass 885. To gain maximum points for English language proficiency, candidates now need an Overall score of 8.0, with 8.0 in all components; in other words, the candidate should be ‘a very good user’ of English. Only if the candidate has other attributes valued in the points system will scores of 7.0 be adequate (Department of Immigration and Citizenship, 2010).
The research presented in this report has been informed by the study of O’Loughlin and Arkoudis (2009), published in IELTS Research Reports Volume 10. It seeks to address similar research questions in a different site. O’Loughlin and Arkoudis did, however, acknowledge that there were some limitations in the comparisons they could make between results obtained by their research participants in the university entry and the university exit IELTS Test, because the entry test results had been obtained before July 2007 when half band scores were not recorded for the Writing and Speaking components of the Test. The current research benefits from the availability not only of the half band scores in Writing and Speaking (recorded for all candidates since July 2007), but the subscores for aspects of Writing and Speaking that contributed to the final scores for these components. For Writing, these sub-scores include Task Response or Achievement, Coherence and Cohesion, Lexical Resource, and Grammatical Range and Accuracy. For Speaking, they include Fluency and Coherence, Lexical Range and Accuracy, Grammatical Range and Accuracy, and Pronunciation.
This research also differs from that of O’Loughlin and Arkoudis in that whereas the participants in their study were both undergraduate and postgraduate, in the current study they are undergraduates only, but representing a range of disciplines, namely, Nursing, Business, Engineering and Information Technology. Also differing from the O’Loughlin and Arkoudis study is the fact that for most of the participants in the research reported here, the results obtained in the July 2010 IELTS Test were not ‘exit scores’. Most of the participants had one more semester of study to complete. Most hoped that their ‘exit score’ would be somewhat improved on the one reported here, and that they would achieve the score they required either for their visa application or for professional registration.
This study uses what Cresswell (2003) refers to as a ‘mixed methods approach’, one that combines quantitative and qualitative data collection and a ‘sequential explanatory strategy’ in which the collection and analysis of the quantitative data is followed by the collection and analysis of the qualitative data (p 215). This two-phase sequential mixed methods approach was used so that the quantitative data collected in the form of IELTS Test results achieved by a sample of undergraduate students at the beginning and towards the end of their period of study in Australia could be analysed, and then, after these quantitative results were available, qualitative data could be obtained by interviewing as many of the students as possible to gain insight into why the results were as they were, and whether the results accorded with the students’ own assessment of their English language proficiency development.
2 RESEARCH QUESTIONS
The research sought to answer the following questions.
- Research Question 1: How much improvement on the IELTS Test, if any, can be expected of undergraduates who are completing higher education courses in an English-medium context in an English-speaking country?
- Research Question 2: Is improvement in some components of the Test (Listening, Reading, Writing, Speaking) more or less likely than in others?
- Research Question 3: Which aspects of language use are most likely or least likely to contribute to improvement in Speaking and Writing?
- Research Question 4: Does field of study have an influence on this improvement or lack of improvement?
- Research Question 5 What demographic and affective factors are associated with score gains or regression?
3 CONTEXT OF STUDY
The study was conducted at the University of Technology, Sydney (UTS). In 2009, 46% of the students were born outside of Australia, approximately 30% were from a non-English speaking background, and 21% were enrolled as international students. In 2009, the faculties with the largest concentrations of international students were Business (34%) and Engineering and Information Technology (29%). The faculties with the largest concentrations of students born outside Australia were: Business (57%); Engineering and Information Technology (57%); Nursing, Midwifery and Health (42%); Science (37%); and Design, Architecture and Building (33%). In both the Faculty of Engineering and Information Technology and the Faculty of Science, over 40% of students identified themselves as having a language background other than English. In both the Faculty of Business and the Faculty of Design, Architecture and Building, the percentage of students identifying themselves as having a language background other than English was 29%. In the Faculty of Nursing, Midwifery and Health, the percentage was 23% (University of Technology Sydney, 2010). The English language entry requirement for most of these faculties is a minimum Overall score in the IELTS Test of 6.5, with 6.0 in the Writing component. In Engineering, however, the requirement is a minimum Overall score of 6.0, with 6.0 in the Writing component.
4 METHODOLOGY
4.1 General approach
A sequential explanatory mixed methods approach was chosen for this study as the intention was to use the qualitative results to ‘assist in explaining and interpreting the findings of a primarily quantitative study’ (Cresswell, 2003, p 215). Scores from a current IELTS Test (Test 2) and an earlier one (Test 1) provided quantitative data for analysis. Interviews were conducted after Test 2 with almost all of the participants. A combination of both quantitative and qualitative approaches such as this is justified by many researchers in human research. For example, Rossman and Wilson (1984, 1991, cited in Miles and Huberman, 1994, p 41) suggest three broad reasons: ‘(a) to enable confirmation or corroboration of each other via triangulation; (b) to elaborate or develop analysis, providing richer detail; and (c) to initiate new lines of thinking through attention to surprises or paradoxes, “turning ideas around,” providing fresh insight’.
4.2 Data collection
Two forms of data collection were used: IELTS Test data and semi-structured student interviews.
4.2.1 IELTS Test 1 and Test 2 scores
Students presented an original copy of their IELTS Test (Academic module) results obtained after 1 July 2007 (when half band scores were introduced for Speaking and Writing) and before 26 May 2009. These results are referred to in this report as Test 1 scores.
The students undertook a second IELTS Test for the study on 10 July 2010. For most of the students, this was immediately preceding the final semester of their undergraduate program. For a few, it was at the end of their final semester. The results of this test are referred to in this report as Test 2 scores. The time gap between Test 1 and Test 2 for all but two participants was in the range of 19 to 36 months.
In addition to the Overall score and the scores the students obtained for each of the components, IELTS Australia provided sub-scores for each of the criteria used in the Speaking and Writing components for both Test 1 and Test 2.
4.2.2 Interviews
Semi-structured individual interviews were held with all but two of the students in the study some time within three months after Test 2.
4.3 Procedures
The study began in January 2010. Ethics approval for the conduct of the study was gained from the UTS Human Research Ethics Committee (HREC) before the recruitment of student participants commenced. Final clearance from the UTS HREC was obtained at the end of March 2010 and 40 places were then reserved at the UTS IELTS Test Centre for the Academic module of the IELTS Test to be conducted on 10 July 2010. A research assistant was contracted in April, her first task being to recruit participants for the study. Student email addresses were accessed through university databases and a broadcast email was sent to all undergraduate international students enrolled at the university in the Faculties of Engineering and Information Technology; Business; Nursing, Midwifery and Health; and, Design, Architecture and Building (the faculties with the highest percentage of NESB students) inviting them, if they met the basic criteria specified in the email, to contact the Principal Researcher with a view to possible participation in the research, which involved a free IELTS Test. These criteria included, in addition to their current enrolment in the relevant faculties, achievement of an IELTS Overall score of 6.5 or above in the Academic module of the IELTS Test conducted after 1 July 2007 and before 1 July 2008.
The email was sent to over 2500 international students. More than 100 students replied to the email seeking further information. Although this was a small percentage of those contacted, most of these respondents did not meet the criteria. Either their IELTS result was obtained before 1 July 2007 or they had satisfied the university English language proficiency requirements through other means, for example, a pathway program that issued certificates deemed to be ‘at an equivalent level as IELTS 6.5’. The majority of the students expressing interest were from the Faculty of Nursing, Midwifery and Health. Their interest may have been the result of their being made aware of a new ruling that would come into force in Australia in July 2010 requiring all nursing students whose secondary education had not taken place in Australia (or in certain exempt countries) to have at least 7.0 in all components of the Academic module of the IELTS Test before they could gain Registered Nurse (RN) status, effectively, before they could graduate. This ruling was modified in August 2010 (after the students had taken the IELTS Test for this research study) allowing students who could provide evidence that their secondary school education had been through the medium of English to be exempted from the requirement (Nursing and Midwifery Board of Australia, 2010). However, most students for whom this modification to the new ruling was relevant still required an IELTS score of at least 7.0 for other employment options.
By 28 May 2010 (the cut-off date given in the recruitment email), a total of 48 students were identified as closely matching most of the specified criteria. These students were interviewed to confirm their suitability for the study, given information letters and asked to sign consent forms in accordance with UTS HREC requirements. Some flexibility was allowed with the date of the original IELTS Test (Test 1) in order to have a range of different backgrounds represented among the students. At this interview, students presented an original copy of their IELTS certificate, the results on which are those referred to in this report as Test 1 scores.
A final selection of 40 students was made in early June 2010, and the students instructed to complete IELTS application forms by 24 June 2010 in order to sit the test on 10 July 2010. All students sat for the Test on this date, and the results were provided to the Principal Researcher a fortnight later. The Principal Researcher then invited the students to collect their certificate (referred to as Test 2 scores) in person, at which point they were asked if they would be willing to be interviewed individually to provide feedback on their English language learning and development experience within and outside the university, and their views about whether they felt the Test 2 scores reflected their own ‘real life experience of their proficiency in English. All but two students agreed to be interviewed. The interviews took place between late July and early September 2010. The Principal Researcher conducted the interviews using an interview schedule (see Appendix 1). The interviews were audio recorded for future analysis. Notes were made of student responses and transcriptions were made of short sections of the recordings to illustrate student views about the degree to which their Test 2 results reflected what they perceived to be the improvement they had made since Test 1 in their proficiency in English.
4.4 Study participants
Originally, it was planned that there would be equal numbers of males and females and an equal number of students from the four faculties with the highest percentage of NESB students. However, as noted above, the opportunity to sit a free IELTS Test proved to be much more attractive to some students from some faculties than to others. There was no interest from students enrolled in the Faculty of Design, Architecture and Building, and a great deal of interest from students enrolled in the Faculty of Nursing, Midwifery and Health.
Relevant information about the 40 students is summarised in Table 1. It should be noted that although all students were undergraduates, quite a few had already graduated with undergraduate degrees from their home country, which accounts for some students being considerably older than the average undergraduate. As there was a very wide range of language backgrounds represented among the students, for the purposes of statistical analysis, the language backgrounds were grouped into three categories as follows: European language background; South Asian and Filipino language background (secondary school and university education in country of origin mostly in English medium); and East and South-East Asian language background. The gap between the time students took Test 1 and Test 2 also varied and this too is summarised in Table 1.
Gender
| Category | Count |
|---|---|
| Female | 23 |
| Male | 17 |
| Faculty | |
| Business | 11 |
| Engineering and Information Technology | 7 |
| Nursing, Midwifery and Health | 22 |
| Country of origin | |
| Bangladesh | 2 |
| Burma | 1 |
| China | 10 |
| Colombia | 1 |
| Germany | 1 |
| India | 4 |
| Indonesia | 2 |
| Korea | 8 |
| Mauritius | 1 |
| Nepal | 1 |
| Pakistan | 1 |
| Philippines | 4 |
| Russia | 2 |
| Vietnam | 2 |
| Total number of students | 40 |
Age
| Category | Count |
|---|---|
| 19 | 1 |
| 20 | 3 |
| 21 | 3 |
| 22 | 6 |
| 23 | 5 |
| 24 | 7 |
| 25 | 3 |
| 26 | 3 |
| 27 | 3 |
| 28 | 4 |
| 32 | 1 |
| 36 | 1 |
| Gap between Test 1 and Test 2 | |
| 12 to 18 months | 1 |
| 19 to 24 months | 4 |
| 25 to 30 months | 16 |
| 31 to 36 months | 18 |
| 37 to 45 months | 1 |
Table 1: Student participants - background data
4.5 Methods of analysis
4.5.1 Test scores
IELTS Test score data included individual scores for Listening, Reading, Writing and Speaking, and Overall scores, as well as sub-scores in Writing and Speaking. Differences in IELTS Test scores obtained by the study participants in Test 1 and Test 2 were analysed using SPSS software in order to answer Research Questions 1 to 4, and to partially answer Research Question 5.
4.5.2 Interviews
Data from the student interviews was examined in relation to research question 5. Notes taken by the Principal Researcher were used and parts of the recorded interviews transcribed to add detail to the notes. Themes and issues were identified in the responses students gave to the interview questions, and similarities and dissimilarities between student responses noted. Dissimilarities between the responses of the successful students and the less successful students were of particular interest.
5 RESULTS
5.1 What differences were there between Test 1 and Test 2 scores?
Eight students in this study achieved an increase in their Overall score from Test 1 to Test 2 of one whole band and a further 14 achieved a half band increase. In other words, just over half of this sample of 40 students were able to achieve a better result in the IELTS Test when taken again after two or three years of higher education in Australia. A total of 12 students achieved the same Overall score in Test 2 as in Test 1, and six students actually regressed, dropping a half band. Of course, this is not to say that the English language proficiency of these students had not improved (and this will be considered in Section 6), but rather that whatever improvement they might have made was not one that was reflected in their IELTS Overall score.
While almost all the students who volunteered to participate in this study acknowledged in the interviews that their primary motivation for participation was the hope that they could achieve the coveted score of at least 7.0 in Listening, Reading, Writing and Speaking, as well as an Overall score of 7.0 - the English language proficiency requirement for an application for an Australian Skilled Independent Resident visa in 2010 or for Nursing Registration - only six out of the 40 students managed to do so. Of these six, four had already achieved an Overall score of 7.0 or 7.5 in Test 1. They were taking the Test again because they had failed to achieve 7.0 in all of the components. So, in fact, only two students who entered the university with the minimum IELTS requirements for their program - an Overall score of 6.5, with 6.0 in Writing - actually achieved a score of at least 7.0 in all components of the Test, the IELTS Test measurement of English language proficiency considered adequate in 2010 by DIAC and many professional organisations for employment as a professional in Australia.
The scores in Test 1 and Test 2 of the 40 student participants are illustrated in Figures 1 to 5 in regard to Listening, Reading, Writing, Speaking and Overall scores. In Test 1, the Listening score obtained by the greatest number (12 students) was 6.5, while in Test 2 it was a score of 7.5 (16 students). A similar pattern applied in Reading. In Test 1, the score obtained by the greatest number (12 students) was also 6.5, while in Test 2 it was a score of 7.5 (10 students). In Writing, the scores were somewhat lower. In Test 1, the score obtained by the greatest number of students (20 students) was 6.0, while in Test 2 it was also 6.0 (14 students). In Speaking, in Test 1, a score of 6.0 was achieved by the greatest number of students (15 students), while in Test 2 it was a score of 7.0 (10 students). In regard to Overall score, in Test 1, it was the minimum score required for university entry (a score of 6.5) that was achieved by the greatest number (27 students), while in Test 2 it was a score of 7.0 (15 students).
As was acknowledged by O’Loughlin and Arkoudis (2009), whose research has informed this current research, generalising from a small sample size is problematic (this one is even smaller than the 63 students in O’Loughlin and Arkoudis’s study). Nevertheless, taken together with these researchers’ findings, tendencies can be discerned. Because this current study was conducted using only results obtained after 1 July 2007, when half band scores were recorded for Writing and Speaking, some finer distinctions in score change can be observed.
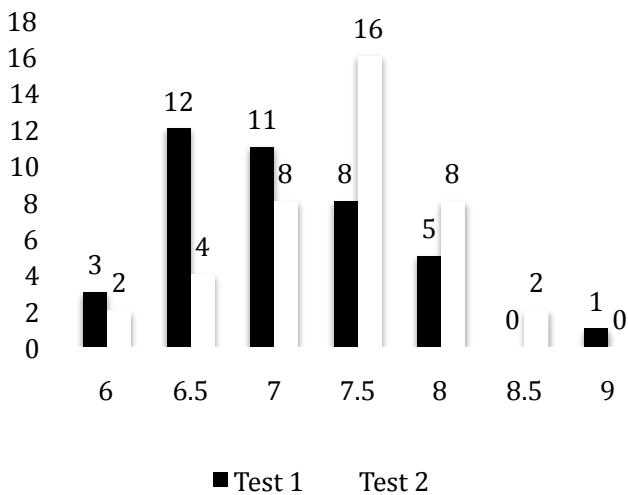
Figure 1: Improvements in IELTS Listening scores from Test 1 to Test 2 (N = 40)
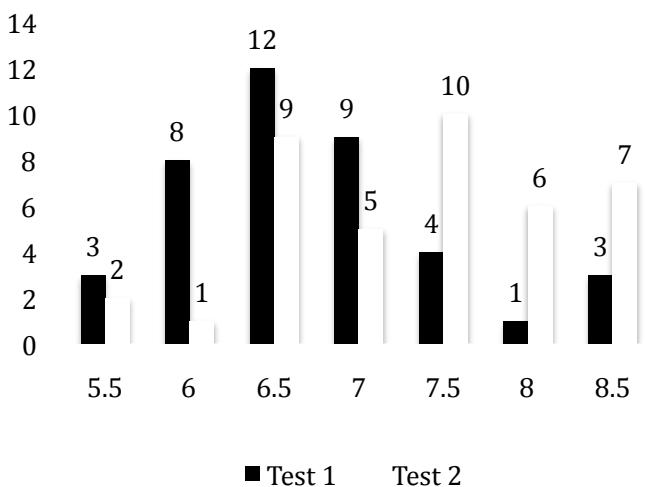
Figure 2: Improvements in IELTS Reading scores from Test 1 to Test 2 (N = 40)
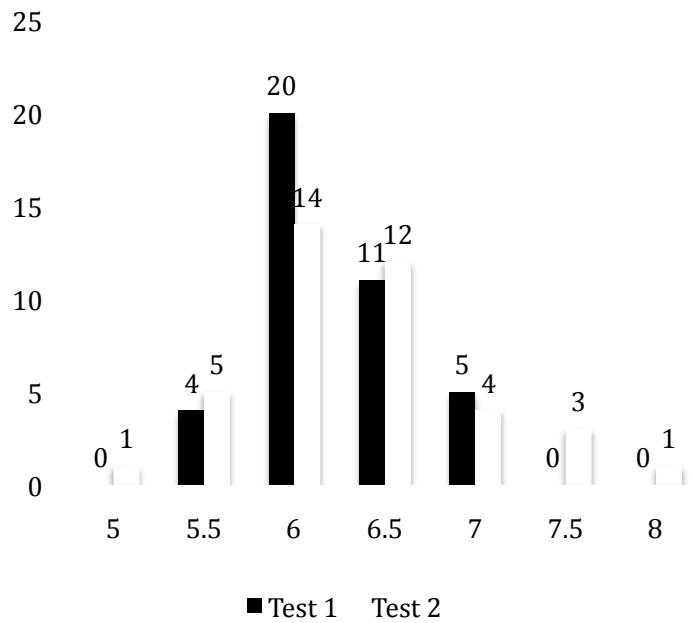
Figure 3: Improvements in IELTS Writing scores from Test 1 to Test 2 (N = 40)
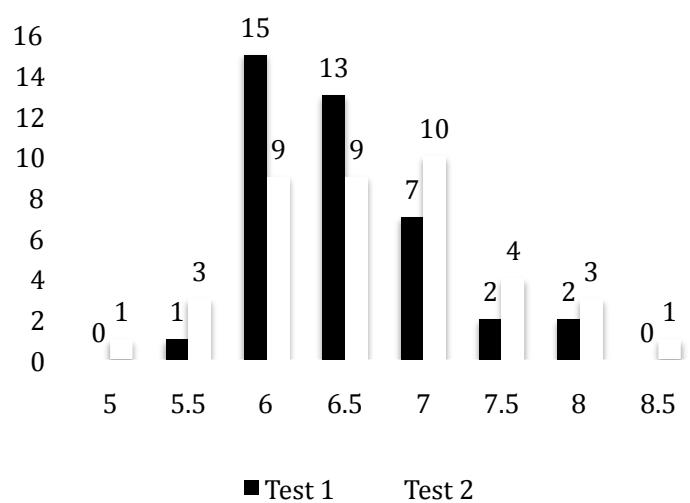
Figure 4: Improvements in IELTS Speaking scores from Test 1 to Test 2 (N = 40)
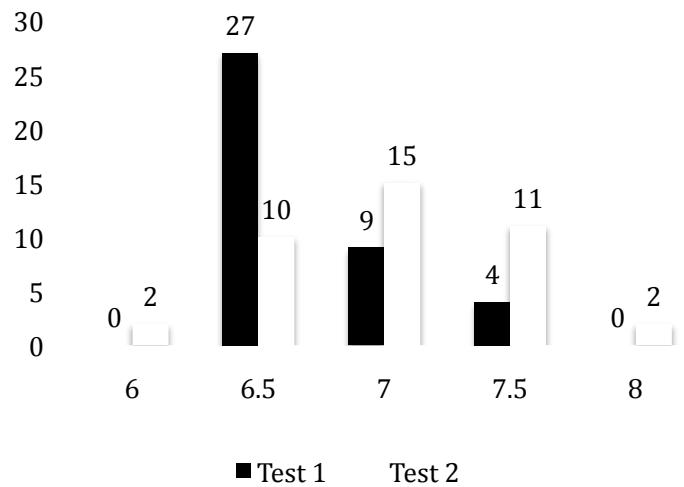
Figure 5: Improvements in IELTS Overall scores from Test 1 to Test 2 (N= 40).
Tables 2, 3 and 4 show the mean and standard deviation for all 40 participants for the Listening, Reading, Writing and Speaking scores and the Overall scores for Test 1 and Test 2. They also show the improvement from Test 1 to Test 2.
5.1.1 Test 1 scores
Table 2 shows that in Test 1 the highest scores were in Listening, followed by Reading, Speaking and Writing in that order.
| Mean | Std Deviation | |
|---|---|---|
| Listening | 7.05 | 0.66 |
| Reading | 6.73 | 0.78 |
| Writing | 6.21 | 0.42 |
| Speaking | 6.50 | 0.58 |
| Overall | 6.71 | 0.34 |
Table 2: Descriptive statistics, Test 1 (N=40)
5.1.2 Test 2 scores
Table 3 shows that in Test 2 the highest scores were also in Listening, although the average scores for Reading were much closer to those for Listening than was the case in Test 1.
| Mean | Std Deviation | |
|---|---|---|
| Listening | 7.38 | 0.60 |
| Reading | 7.33 | 0.84 |
| Writing | 6.33 | 0.64 |
| Speaking | 6.66 | 0.78 |
| Overall | 7.01 | 0.49 |
Table 3: Descriptive statistics, Test 2 (N=40)
5.1.3 Differences between Test 1 and Test 2 scores
Table 4 shows that the mean score for each component of the Test, as well as for the Overall score, was higher for Test 2 than for Test 1. This was most marked in Reading and Listening. For Speaking and Writing, however, the increase in the mean score was relatively slight. This was the same order of improvement observed by O’Loughlin and Arkoudis (2009), although the student participants in their study displayed a slightly higher increase in mean score overall.
| Mean | Std Deviation | |
|---|---|---|
| Listening Improvement | 0.33 | 0.74 |
| Reading Improvement | 0.60 | 0.92 |
| Writing Improvement | 0.11 | 0.75 |
| Speaking Improvement | 0.16 | 0.82 |
| Overall Improvement | 0.30 | 0.49 |
Table 4: Descriptive statistics for changes in mean scores from Test 1 to Test 2 (N=40)
Paired sample t-tests were conducted to see whether the higher mean for the Overall score, as well as for each of the components of the Test, indicated a significant improvement. A paired sample t-test was conducted to determine whether the mean Listening score in Test 2 was significantly larger than the mean Listening score in Test 1. The result revealed the sample mean of 7.38 (SD = .60) to be significantly different from 7.05, , . In other words, there was an improvement in Listening scores from Test 1 to Test 2.
A similar result was obtained when a paired sample t-test was conducted to determine whether the mean Reading score in Test 2 was significantly larger than the mean Reading score in Test 1. The analysis showed that the sample mean of 7.33 (SD = .84) was significantly different from 6.73, , . In other words, there was also an improvement in Reading scores from Test 1 to Test 2.
In the case of Writing and Speaking, however, the small increases in the mean scores did not reflect a significant improvement. For Writing, the sample mean of 6.33 (SD = .64) was not significantly different from 6.21, , . Likewise, for Speaking, the sample mean of 6.66 (SD = .78) was not significantly different from 6.50, , .
The results of the paired sample t-test conducted on the Overall score did, however, indicate an improvement. The sample mean of 7.01 (SD = .49) was significantly different from 6.71, , . This significant improvement in the mean Overall score from Test 1 to Test 2 can be seen, to a large degree, to be the result of the marked improvement in the Reading score.
Tables 5 to 10 show mean score differences between Test 1 and Test 2 in relation to certain demographic groups within the larger group. Given that the numbers here are quite small, arriving at any definitive conclusion on the characteristics of the student most likely to improve has not proved possible.
5.1.4 Differences between Test 1 and Test 2 scores according to field of study
In relation to the mean increase in the Overall score, Business students had the highest increase (0.41 of a band) and Nursing students the lowest (just 0.23 of a band), but Nursing students had the highest increase in Speaking (0.32 of a band) while for Business students the mean score was actually lower in Test 2 (-0.14 of a band). The Business students had the highest increase in mean score in Listening (0.5 of a band) while the Engineering and IT students had the highest increase in Reading (0.93 of a band) and Writing (0.43 of a band). Given that certain nationalities and language backgrounds were more likely to be in certain faculties than in others further complicates any attempts to draw conclusions from these results.
| Faculty | Listening | Reading | Writing | Speaking | Overall | |
|---|---|---|---|---|---|---|
| Business | Mean | 0.50 | 0.86 | 0.18 | -0.14 | 0.41 |
| N = 11 | Std Deviation | 1.05 | 0.71 | 0.96 | 0.74 | 0.38 |
| Engineering and IT | Mean | 0.21 | 0.93 | 0.43 | 0.14 | 0.36 |
| N = 7 | Std Deviation | 0.64 | 0.93 | 0.84 | 0.90 | 0.48 |
| Nursing | Mean | 0.27 | 0.36 | -0.02 | 0.32 | 0.23 |
| N = 22 | Std Deviation | 0.59 | 0.98 | 0.59 | 0.82 | 0.55 |
| Total | Mean | 0.33 | 0.60 | 0.11 | 0.16 | 0.30 |
| N = 40 | Std Deviation | 0.74 | 0.92 | 0.75 | 0.82 | 0.49 |
Table 5: Descriptive statistics for changes in mean scores from Test 1 to Test 2 according to field of study (N=40)
One-way ANOVA was used to compare differences between each of the faculties in regard to each of the components of the Test as well as in Overall score. The result indicated that although the increases in mean scores suggested a pattern of improvement, the differences between each of the faculty groupings were not significant either for the Overall score or for any of the components of the Test. (See Appendix 2.)
5.1.5 Differences between Test 1 and Test 2 scores according to language background
As there was a very wide range of language backgrounds represented among the students, for the purposes of statistical analysis, the language backgrounds were grouped as follows:
- European language background
- South Asian and Filipino language background (high school and university education in country of origin mostly in English medium)
- East and South-East Asian language (Chinese, Korean, Vietnamese, Indonesian) background.
According to the data in Table 6, the greatest increase in Overall score (0.5 of a band) was that of students with a European language background. This was also the case for Listening, Reading and Writing. South Asian or Filipino language background students, however, had the highest increase in Speaking (0.5 of a band). The East and South-East Asian language background students showed very little increase in Overall score (just 0.2 of a band), with the highest increase being in Reading (0.59 of a band), followed by Listening (0.36 of a band).
| Language background | Listening | Reading | Writing | Speaking | Overall | |
|---|---|---|---|---|---|---|
| European | Mean | 0.70 | 0.80 | 0.50 | -0.40 | 0.50 |
| N = 5 | Std Deviation | 1.04 | 1.04 | 1.12 | 1.08 | 0.35 |
| South Asian and Filipino | Mean | 0.12 | 0.54 | 0.08 | 0.50 | 0.38 |
| N = 13 | Std Deviation | 0.65 | 0.80 | 0.70 | 0.82 | 0.55 |
| East/ South-East Asian | Mean | 0.36 | 0.59 | 0.05 | 0.09 | 0.20 |
| N = 22 | Std Deviation | 0.71 | 1.00 | 0.69 | 0.70 | 0.48 |
| Total | Mean | 0.33 | 0.60 | 0.11 | 0.16 | 0.30 |
| N= 40 | Std Deviation | 0.74 | 0.92 | 0.75 | 0.82 | 0.49 |
Table 6: Descriptive statistics for changes in mean scores from Test 1 to Test 2 according to language background (N=40)
One-way ANOVA was used to compare differences between each of the language background groupings in regard to each of the components of the Test as well as in Overall score. As was the case with different faculty groupings, the result indicated that although the increases in mean scores suggested a pattern of improvement, the differences between each of the language background groupings were not significant either for the Overall score or for any of the components of the Test. (See Appendix 2.)
5.1.6 Differences between Test 1 and Test 2 scores according to gender
There were slightly more female student participants (23) in the study than male (17). Compared to the other groupings, however, the gender groupings were relatively similar in size. Table 7 indicates that the increase in mean score for female students in the Overall score, and in all the components tested, with the exception of Writing, was higher than that of the male students. In regard to Speaking, male students actually had a decrease in the mean score.
| Gender | Listening | Reading | Writing | Speaking | Overall | |
|---|---|---|---|---|---|---|
| Female | Mean | 0.46 | 0.65 | 0.09 | 0.30 | 0.39 |
| N = 23 | Std Deviation | 0.64 | 0.99 | 0.67 | 0.81 | 0.50 |
| Male | Mean | 0.15 | 0.53 | 0.15 | -0.03 | 0.18 |
| N = 17 | Std Deviation | 0.84 | 0.84 | 0.86 | 0.82 | 0.47 |
| Total | Mean | 0.33 | 0.60 | 0.11 | 0.16 | 0.30 |
| N = 40 | Std Deviation | 0.74 | 0.92 | 0.75 | 0.82 | 0.49 |
Table 7: Descriptive statistics for changes in mean scores from Test 1 to Test 2 according to gender (N=40)
One-way ANOVA was used to compare differences between female and male students in regard to each of the components of the Test, as well as in Overall score. As was the case with the other groupings, the result here also indicated that although the increases in mean scores suggested a pattern of improvement, the differences between females and males were not significant either for the Overall score or for any of the components of the test. (See Appendix 2.)
5.1.7 Differences between Test 1 and Test 2 scores according to gap between tests
Table 8 shows the relationship of the time period between Test 1 and Test 2 to the likelihood of there being an increase in test scores. While the initial intention of this research was to recruit only students who could provide Test 1 results that had been achieved between 24 months and 36 months before the date they would sit for Test 2, some flexibility was needed in order to obtain a variety of fields of study and language backgrounds among the research participants. Most of the participants did, however, have a gap of between 25 and 30 months (16) or between 31 and 36 months (18) between the two tests. The results of two candidates were excluded from this analysis, one for whom the gap between tests was 39 months and another for whom it was only 15 months. The figures in Table 8 indicate that the highest increase in the mean score was for those who had a longer gap between tests (between 31 and 36 months).
| Gap between Tests (months) | Listening | Reading | Writing | Speaking | Overall | |
|---|---|---|---|---|---|---|
| 19 to 24 | Mean | 0.13 | 0.75 | 0.38 | -0.38 | 0.13 |
| N = 4 | Std Deviation | 0.75 | 1.19 | 0.48 | 0.25 | 0.48 |
| 25 to 30 | Mean | 0.28 | 0.50 | -0.09 | 0.22 | 0.28 |
| N = 16 | Std Deviation | 0.75 | 1.02 | 0.69 | 0.86 | 0.48 |
| 31 to 36 | Mean | 0.39 | 0.75 | 0.31 | 0.25 | 0.39 |
| N = 18 | Std Deviation | 0.72 | 0.81 | 0.81 | 0.83 | 0.50 |
| Total | Mean | 0.27 | 0.67 | 0.20 | 0.03 | 0.27 |
| N= 38 | Std Deviation | 0.74 | 1.01 | 0.66 | 0.65 | 0.49 |
Table 8: Descriptive statistics for changes in mean scores from Test 1 to Test 2 according the gap between tests (N=38)
One-way ANOVA was used to compare score differences according to gap between tests in regard to each of the components of the Test, as well as in Overall score. As was the case with the other groupings, the result here also indicated that although the increases in mean scores suggested a pattern of improvement, the differences between these groups were not significant either for the Overall score or for any of the components of the Test. (See Appendix 2.)
5.1.8 Differences between Test 1 and Test 2 scores according to age
As some of the undergraduate students who participated in this research were undertaking a second undergraduate degree, the age range of the students in this study was quite wide. The youngest was 19 and the oldest 36 years. There were 18 students in the age range that is most likely to coincide with students undertaking their first degree (19 to 23 years), and 22 in the age range more likely to coincide with students undertaking their second degree (24 to 36 years). As the numbers in each of these two groups were almost equally balanced, it was interesting to compare the younger age group with the older. The data in Table 9 showed higher mean increases for the younger students in their Overall score as well as in all the test components than for slightly older students.
| Age | Listening | Reading | Writing | Speaking | Overall | |
|---|---|---|---|---|---|---|
| 19-23 | Mean | 0.42 | 0.75 | 0.22 | 0.28 | 0.44 |
| N = 18 | Std Deviation | 0.81 | 0.79 | 0.93 | 0.89 | 0.45 |
| 24-36 | Mean | 0.25 | 0.48 | 0.02 | 0.07 | 0.18 |
| N = 22 | Std Deviation | 0.69 | 1.02 | 0.57 | 0.76 | 0.50 |
| Total | Mean | 0.33 | 0.60 | 0.11 | 0.16 | 0.30 |
| N = 40 | Std Deviation | 0.74 | 0.92 | 0.75 | 0.82 | 0.49 |
Table 9: Descriptive statistics for changes in mean scores from Test 1 to Test 2 according to age grouping (N=40)
One-way ANOVA was used to compare score differences according to age of the students in regard to each of the components of the Test, as well as in Overall score. As was the case with the other groupings, the result here also indicated that, although the increases in mean scores suggested a pattern of improvement, the differences between these groups were not significant either for the Overall score or for any of the components of the Test. (See Appendix 2.)
5.1.9 Relationship of Test 1 result to degree of improvement
Not surprisingly, it was those students whose Test 1 results were the lowest - the minimum acceptable for entry to the university (an Overall Band score of 6.5 with 6.0 in Writing) - who were most likely to show the greatest improvement in their Test 2 results. Table 10 shows the correlations between Test 1 and improvement in Test 2. The correlations are significant in the case of all the components of the Test.
Listening
| Measure | Correlation |
|---|---|
| Correlations | -0.641 significant level 0.000 |
| Reading | |
| Correlations | -0.517 significant level 0.000 |
| Writing | |
| Correlations | -0.525 significant level 0.000 |
| Speaking | |
| Correlations | -0.42 significant level 0.000 |
| Overall | |
| Correlations | -0.356 significant level 0.05 |
Table 10: Correlations between Test 1 and improvement in Test 2
5.1.10 Score gains and regression and demographic characteristics
5.1.10a Students achieving greatest Overall score improvement from Test 1 to Test 2
While patterns of improvement can be observed as greater or lesser according to the background characteristics of students in this study, statistical analysis has meant that no generalisation regarding the kind of student most likely to improve can be reliably made. It is nevertheless interesting to consider the characteristics of each of the individuals who did show the greatest increase in their IELTS Test results.
Of the 40 students who participated in this study, only eight managed to improve by one IELTS band in their Overall score. The demographic details for these eight students are shown in Table 11. It can be seen, however, that four South Asian or Filipino Nursing students were among the eight who had increased their Overall score by one band. One of these had improved in Overall score from 7.0 to 8.0, but the other three had improved from 6.5 to 7.5. All were female and all in the younger age group.
| ID # | Faculty | Language background | Gender | Gap between tests (months) | Age (years) | Test 1 Overall IELTS band | Test 2 Overall IELTS band |
|---|---|---|---|---|---|---|---|
| 7 | Eng/IT | East/SE Asian | M | 31-36 | 22 | 6.5 | 7.5 |
| 19 | Business | East/SE Asian | M | 31-36 | 23 | 6.5 | 7.5 |
| 9 | Business | European | F | 31-36 | 25 | 6.5 | 7.5 |
| 29 | Nursing | East/SE Asian | F | 31-36 | 29 | 6.5 | 7.5 |
| 32 | Nursing | South Asian/ Filipino | F | 31-36 | 23 | 6.5 | 7.5 |
| 1 | Nursing | South Asian/ Filipino | F | 31-36 | 24 | 6.5 | 7.5 |
| 31 | Nursing | South Asian/ Filipino | F | 25-30 | 21 | 6.5 | 7.5 |
| 10 | Nursing | South Asian/ Filipino | F | 25-30 | 20 | 7.0 | 8.0 |
Table 11: Characteristics of students whose Overall score was one band higher in Test 2
5.1.10b Students regressing in the Overall score from Test 1 to Test 2
Statistical analysis has also meant that no generalisation regarding the kind of student least likely to improve (or likely to regress) can be reliably made. Nevertheless, it is interesting to consider the characteristics of each of the individuals who did regress in their IELTS Test results.
Table 12 gives data relating to the six students whose IELTS Test results in Test 2 were lower than in Test 1. Five of the six students who regressed were studying Nursing and four were of East or South Asian language background. Four were in the older age group and four had an Overall score in Test 1 of 7.0 or more. There were equal numbers of females as males and three had a gap of over 31 months between the Tests.
| ID # | Faculty | Language background | Gender | Gap between tests (months) | Age (years) | Test 1 Overall IELTS band | Test 2 Overall IELTS band |
|---|---|---|---|---|---|---|---|
| 5 | Nursing | East/SE Asian | F | 25-30 | 29 | 6.5 | 6.0 |
| 15 | Nursing | South Asian/ Filipino | M | 31-36 | 36 | 6.5 | 6.0 |
| 14 | Nursing | East/SE Asian | F | 31-36 | 28 | 7.0 | 6.5 |
| 30 | Nursing | South Asian/ Filipino | M | 31-36 | 32 | 7.0 | 6.5 |
| 24 | Eng/IT | East/SE Asian | M | 19-24 | 24 | 7.5 | 7.0 |
| 12 | Nursing | East/SE Asian | F | 25-30 | 23 | 7.5 | 7.0 |
Table 12: Characteristics of students whose Overall score was half a band lower in Test 2
5.2 Which aspects of language use contributed most to improvement in Speaking and Writing?
The Reading and Listening components of the IELTS Test are marked objectively, and feedback is not available on the types of listening or reading skills candidates are able or unable to demonstrate. The Speaking and Writing components of the IELTS Test, however, are assessed by examiners based on band descriptors for four distinct aspects of language use. Therefore, it is possible to gain some insight into the nature of the improvement from Test 1 to Test 2.
5.2.1 What contributed most to improvements in Speaking?
As noted in Section 5.1.3, there was an increase in the mean Speaking score from Test 1 to Test 2 although this was relatively slight - the mean for the improvement being just 0.16. (The mean score for Speaking in Test 1 was 6.5, while in Test 2 it was 6.66). Confidential data not provided to test candidates, but made available by IELTS Australia for the purposes of this research, has made it possible to identify which aspects of language use contributed to this increase and which aspects may have been responsible for it being relatively limited. In the assessment of Speaking, IELTS examiners consider four aspects of language use: Fluency and Coherence, Lexical Resource, Grammatical Range and Accuracy, and Pronunciation. Each of these aspects has a descriptor for each band. These are summarised for test users in the publicly available band descriptors on the IELTS website (International English Language Testing System, 2010b). It should be noted here, however, that a comparison of Pronunciation scores between Test 1 and Test 2 is of limited validity as in August 2008 a revised scale for assessing Pronunciation was introduced.
It can be seen from Table 13 that for Speaking the criterion for which the mean increase was greatest was Grammatical Range and Accuracy, followed by Pronunciation, then Lexical Resource and finally, Fluency and Coherence. This result is to some extent surprising. It is generally thought that over time, with exposure to English, students acquire a broader vocabulary and greater confidence in speaking coherently about a broader range of topics. It is also thought that grammatical and pronunciation inaccuracies can become ‘fossilised’ in students’ use of English. The sub-scores of the students in this study, however, contradict this commonly-held belief.
Statements made by a number of the students in the interview (discussed further in Section 5.4.2d) do shed some light on this. Many of the students noted that they were asked to talk about topics with which they were unfamiliar or in which they had limited interest and, therefore, they did not have very much to say - something that would certainly affect their fluency and coherence, and would indicate to the examiner limitations in lexical resource.
| Speaking (N=40) | Fluency and Coherence | Lexical Resource | Grammatical Range and Accuracy | Pronunciation |
|---|---|---|---|---|
| Mean Score | 0.05 | 0.10 | 0.35 | 0.23 |
| Std Deviation | 0.99 | 0.98 | 0.86 | 1.17 |
Table 13: Descriptive statistics for changes in mean scores in specific aspects of language use for Speaking from Test 1 to Test 2
5.2.2 What contributed most to improvements in Writing?
It can be seen in Table 4 (Section 5.1.3) that the least improvement was made in Writing. The mean score increase was just 0.11, with the mean score for Writing in Test 1 being 6.21 and in Test 2 being 6.33. Once again, confidential data not provided to test candidates, but made available by IELTS Australia for the purposes of this research, has made it possible to identify which aspects of language use contributed to the improvement and which aspects of language use may have been responsible for the improvement being very limited. The final Writing score is calculated from bands awarded for four distinct aspects of language use on two separate writing tasks (Task 1 and Task 2). These are outlined for test users in the publicly available band descriptors on the IELTS website (International English Language Test System, 2010c and 2010d). In Task 1, test candidates are required to write at least 150 words about data that may be in the form of a graph, table, diagram or map. In Task 2, students are required to write an essay of at least 250 words
| Writing Task 1 (N=40) | Task Achievement | Coherence and Cohesion | Lexical Resource | Grammatical Range and Accuracy |
|---|---|---|---|---|
| Mean Score | -0.30 | 0.08 | 0.38 | 0.25 |
| Std Deviation | 1.32 | 1.16 | 1.15 | 1.08 |
Table 14: Descriptive statistics for changes in mean scores in specific aspects of language use for Writing Task 1 from Test 1 to Test 2
| Writing Task 2 (N=40) | Task Response | Coherence and Cohesion | Lexical Resource | Grammatical Range and Accuracy |
|---|---|---|---|---|
| Mean | -0.13 | 0.23 | 0.20 | 0.18 |
| Std Deviation | 1.22 | 0.97 | 1.07 | 0.84 |
Table 15: Descriptive statistics for changes in mean scores in specific aspects of language use for Writing Task 2 from Test 1 to Test 2
It can be seen from Tables 14 and 15 that in both writing tasks, the mean score was actually lower on the criteria that had to do with answering the question - ‘Task Achievement’ for Task 1 and ‘Task Response’ for Task 2. Data from the interviews (see Section 5.4.2c) gives some explanation as to why this may have been the case. In Task 1 the mean score increase was greatest in Lexical Resource (a mean of 0.38), followed by Grammatical Range and Accuracy, and then Coherence and Cohesion. In Task 2, the greatest increase in mean score was on Coherence and Cohesion (a mean of 0.23), which could be explained by the familiarity students have with a standard essay format of introduction, body and conclusion. The mean increase on Coherence and Cohesion was not much greater than that on Lexical Resource (0.20), and Grammatical Range and Accuracy (0.18).
If Task Achievement and Task Response can be considered as issues of content, while Coherence and Cohesion, Lexical Resource, and Grammatical Range and Accuracy are more issues of form, then it might be argued that the actual improvement in the students’ control of the forms of the English language for the purposes of writing was somewhat better than the very slight overall improvement in scores indicate. Data from interviews (see Section 5.4.2c) suggests that some of the students felt that they could demonstrate a higher level of proficiency in writing when writing about content with which they were familiar or which they had been able to research or had time to consider at length. The requirements of the academic genre in which they had developed some competence as part of their studies differed somewhat from the opinion pieces they were asked to write in the IELTS Test. This observation is supported by the research of Moore and Morton (2005).
5.3 Relationship of IELTS Test scores in Test 2 to Grade Point Average (GPA)
The relationship of IELTS Test scores to academic performance was not specified as a research question to be investigated in this research. However, as data on students’ GPA was available through university databases, it was of interest to see if such a relationship existed. After all, given the use of IELTS Test scores in professional registration - a measure of a person’s readiness to be employed in a profession - and that it might reasonably be assumed that readiness for professional employment should in some way draw on academic achievement, it might be expected that the greater the degree of English language proficiency a student has, the more likely that student is to achieve academically.
Previous research into the relationship between IELTS scores and academic achievement has been inconclusive (Kerstjens and Nery, 2000, p 95, discuss some of the inconsistent findings). Most research does indicate that students who enter university with IELTS scores below 6.0 are likely to experience difficulty in their studies (Elder, 1993; Feast, 2002; Ingram and Bayliss, 2007), but if the student has achieved an IELTS score of 7.0 or over, it appears that other factors, such as previous professional experience, are more likely to influence achievement (Woodrow, 2006). A similar finding was made by Avdi (2011) in her research with students undertaking a Masters in Public Health. In fact, she found that students who entered the program with the lowest IELTS scores (Bands 5.0 to 6.0) obtained a higher mean GPA than the groups of students entering with IELTS scores of 6.5 or 7.0-8.0. A possible explanation for this, Avdi suggests, is that most of the students in her study who entered with the lowest IELTS scores were students who had gained IDP scholarships and had received regular English language and academic skills tuition (p 47). Indeed, high IELTS scores can sometimes be associated with lack of academic success (Dooey and Oliver, 2002, p 52). The findings of this study into the IELTS scores and GPA relationship indicate that there is no clear relationship between the IELTS score of the student at the time of Test 2 and their current GPA.
GPA here is based on the grading system in use at the university where the research was conducted, as well as at many other Australian universities. A Pass grade in any one subject represents a percentage mark between 50% and 64%; a Credit grade is between 65% and 74%; a Distinction grade between 75% and 84%; and a High Distinction grade between 85% and 100%. According to the scale used at UTS until Spring Semester 2010, if a student achieved Pass grades only in all subjects, their GPA would be 1.0. A Credit grade in GPA terms would be 2.0, a Distinction grade 3.0, and a High Distinction grade 4.0.
While for some students, there was some relationship between their academic achievement as measured by GPA and their IELTS score, for others there was not. One East Asian IT student in this study, for example, obtained an IELTS Overall score of 7.0 in Test 2 (although not 7.0 in every component of the Test) but had a very impressive GPA of 3.31 (Distinction/High Distinction). A European language background Business student, in contrast, achieved an IELTS Overall score of 8.0 and at least 7.0 in all components, but had made only modest achievement academically as indicated by a GPA of 1.6 (Pass/Credit). An East Asian Nursing student, achieved a modest IELTS Overall score of 6.5 (in other words had not improved from Test 1 to Test 2), but achieved a GPA of 2.4 (Credit/Distinction). Clearly, a great many factors other than the level of English language proficiency as measured by the IELTS Test have an impact on GPA. These include the faculty in which the student is studying, the relative importance of numeracy skills over literacy skills, the student’s interest in the subject, their motivation to achieve high grades and their overall aptitude for study. The sample in this study is too small to be able to investigate the influence of all these factors in a statistically significant manner. The relationship of academic achievement to IELTS scores at higher levels of proficiency is certainly a question that warrants further research.
5.4 What personal factors influenced the students’ performance in Test 2?
At some time in the three months after they had taken Test 2, all but two of the 40 students who participated in the research were interviewed by the Principal Researcher regarding their English language learning experience and their experience of the IELTS Test. The students were assured that every attempt would be made in the reporting of what they said to preserve their anonymity. Hence, limited reference only is made in the following sections to the country of origin of individual students or to other information that would identify them. When information is given about individual students, they are identified by the ID number allocated to them in the research study database.
5.4.1 Motivation for taking the IELTS Test
The students were all asked about their motivation for agreeing to participate in the first part of the research, a condition of which was that they provided an original Academic module IELTS certificate from their previous Test and that they sat for another Academic module IELTS Test (at the expense of the Research study) in July 2010, and agreed that the Principal Researcher could be provided by the IELTS Examination Centre with their results. Participation in the interviews was optional.
To the question asking about the primary motivation for participation in the research, which included the opportunity to take a free IELTS Test, only seven of the students replied that they wanted to get an idea of their current English language proficiency level. These seven had no immediate plans to use their IELTS certificate for an application of any kind. The remaining 31 were all motivated by their need to support an application of some kind. Fifteen said that they were intending to make an application for a visa that would gain them permanent residence in Australia and 12 noted the requirement of an IELTS Test for registration as nurses. Also related to nursing requirements, one said she needed to produce an IELTS certificate for work in a public hospital, and another for participation in the new graduate program in a hospital. One student was applying for further study and one for an internship in a major accounting firm. In almost all of these cases, the requirement was an Overall score of 7.0, and 7.0 in each of the components of the Test. For nursing registration, the Academic module was required. For permanent residence, either the Academic module or General Training module was acceptable, but only candidates willing to sit for the Academic module were selected for participation in the current study. One student required an Overall score of 6.0 only as she could gain extra points for her visa application for permanent residence with a sponsorship. The student interested in an internship, on the other hand, required 8.0 in Speaking and Listening and 7.5 in Reading and Writing.
In many cases, the students regarded this free test as a trial test. Most would be studying for one more semester before they completed their degree and would, therefore, have another opportunity to take the Test (at their own expense), before they submitted their application for professional recognition or for a permanent residence visa.
While some of these students were taking the IELTS Test for the second time only, others had taken it on more occasions. For one student, this was the sixth time he had taken the Test; for two more, it was the fifth time; for four students, it was the fourth time; and for 10, it was the third time. The remaining 20 had taken the Test just once beforehand.
5.4.2 Perceptions of the Test as a valid indicator of their proficiency
Each of the students who were interviewed believed that their English had improved since the time they sat for Test 1, although some were inclined to allow the results they obtained in Test 2 to cast doubt on what they thought to be the case. Some were prepared to make distinctions between their own perceptions of their proficiency in English and their proficiency as measured by the IELTS Test. Some of the students who had not improved or had regressed explained that this was because they had had more opportunity for test preparation before Test 1, but no opportunity before Test 2. Two students explained that the general atmosphere in their home country where they had taken Test 1 was more relaxed than was the case at the test centre where they took Test 2, and that that was the reason the test results did not reflect the improvement in English language proficiency they believed they had made since they had been living in Australia.
This is my first time to took the IELTS in Australia…I don’t like the environment honestly… because it’s plenty of people and everybody’s checking, everybody’s checking and you cannot even touch the questionnaire.
(Student #15 Test 1: Overall 6.5; Test 2: Overall 6.0)
I could have got more, but, like, the way they conduct the IELTS exam in [home country] is totally different to how they are doing it here because, the thing is, in [home country] when you go, first of all, they give you some time to, like they ask you some personal questions before they start doing the IELTS exam but, so just to make you familiar with the atmosphere, so that you are not under pressure…Ask you for water, whether you need water…are you comfortable, are you fine.
(Student #23 Test 1: Overall 7.0; Test 2: Overall 7.0)
As Davies (2008, p 111) puts it in his history of the IELTS Test, ‘[t]ests cannot be authentically real-life: the best they can do is simulate reality’. For some of the students in this study, the Test did simulate reality to a satisfactory degree. For others, it did not. For some, the test results did reflect the improvement that they had experienced in their proficiency in use of English, while others claimed that they were more proficient than the test results indicated. No student claimed that the test results suggested a higher level of proficiency overall than they felt was the reality.
5.4.2a Listening results and personal assessment of proficiency
The Listening component of the IELTS Test lasts about 30 minutes. The Listening Test is the same for both General Training module and Academic module candidates. Candidates are required to listen to a number of recorded texts, which include a mixture of monologues and conversations, and feature a variety of English accents. The recording is heard once only, but candidates are given time to read the questions and write down their answers. In both Test 1 and Test 2, the highest mean score for the 40 students in this study was achieved in the Listening component of the Test (see Tables 2 and 3). The mean score for improvement from Test 1 to Test 2 was also quite high in Listening, although not as high as that for Reading (see Table 4). Therefore, it is not surprising that most of the 38 students interviewed thought the Listening component was ‘quite easy’.
The listening test was the easiest for us.
(Student #1: Test 1 Listening: 6.5; Test 2 Listening: 8.0)
Of the 38 students interviewed, 19 had improved in their Listening from Test 1 to Test 2. Nine had achieved the same score, and 10 had a lower score. Most of those who did improve gave the following main reasons for their improved proficiency in Listening: general exposure to English in the time they had been in Australia; active participation in activities outside the university; and/or listening to lectures.
That’s because of taking subjects at [university] and living in Australia helped me to improve that.
(Student #25: Test 1 Listening: 6.5; Test 2 Listening: 7.5)
That’s because I attend church and then OK, church people, they go on the platform and they talk and you basically sit there for a few hours and you listen to people…If you don’t concentrate on what they are saying and you would rather just fell asleep, so I just force myself to listen more and try to understand…For university, I try to do a lot of note-taking, try to dictate all the things that I have heard and try to think about it and sometimes you would, like, encounter some words you are not familiar with or you don’t know how to spell it, so you try to remember how they say it and check it in the dictionary or ask someone else to spell it for me. At the time it impressed my memory. So I think that’s the way I can improve.
(Student #19: Test 1 Listening: 6.0; Test 2 Listening: 8.5)
Mention was also made of the role that a wider vocabulary played in improvement in listening comprehension and of confidence to guess a meaning when an unfamiliar word was used in context. Some of those who had not made an improvement or who had achieved a lower score for Listening in Test 2 than in Test 1 were quite surprised by the result as they had thought they had done better. Others attributed their lack of improvement in this component of the Test to feeling sick or tired (some had just completed end-of-semester exams) or to the ‘tricky’ nature of some of the questions and to their poor test-taking strategies.
I had a small struggle on the day of the IELTS Test. I was so sleepy that when it come to the final of the Listening test I don’t even hear what they’re talking about…because I’m not feeling good on that day. I know that the Listening result will be worse than the ones before because when it come to the end I just can’t concentrate. I’m not used to the cold weather here.
(Student #21: Test 1 Listening: 7.5; Test 2 Listening: 7.0)
The first one I gave in my country…the words were very clear and the speed was very slow… In here the words were going like phew, phew, phew…But I’m very good at listening. I haven’t got any trouble of my understanding in Australia…I do not do any preparation, maybe, because of that.
(Student #22: Test 1 Listening: 7.0; Test 2 Listening: 6.5)
As the recordings are heard once only, momentary loss of attention can mean some questions cannot be answered.
When I was doing the Test there was some kind of distraction. A girl sitting in front of me dropped her pencil or something and it’s just a matter of seconds when you direct your senses to something else and you lose a sentence. So I think that was a problem. I personally believe I don’t really think that I couldn’t understand what they said. I just missed some of the lines because I was thinking of something else.
(Student #10: Test 1 Listening: 8.0; Test 2 Listening: 8.0)
I was just listening to one particular question and then I just um, I dunno, I started thinking like ‘oh, is that right’ and then I just missed the next question and I think it was just one or maybe two questions that I missed.
(Student #34: Test 1 Listening: 9.0; Test 2 Listening: 8.0)
5.4.2b Reading results and personal assessment of proficiency
The time allowed for the Reading component of the Academic module of the IELTS Test is 60 minutes. Candidates are required to read three passages that are taken from books, magazines, journals and newspapers. All are written for a non-specialist audience. There are 40 questions consisting of a variety of items types, principally multiple choice, matching information, true/false/not given, or short answer. Reading was the IELTS Test component in which the students in the current study made the greatest improvement between Test 1 and Test 2 (see Table 4). Of the 38 students interviewed, 24 had improved in their Reading score from Test 1 to Test 2, nine had achieved the same score and five a lower score. As with the Listening component, there was a general feeling that the Reading in the IELTS Test was considerably easier than the reading that was required for university study, not least because the passages were considerably shorter.
The literature that you read during the semester, it’s quite harder…it’s quite above the level of the readings that you read during the Test.
(Student #10: Test 1 Reading: 7.0; Test 2 Reading: 8.5)
To be very frank, I found…the reading easy…The reading stuff was really simple, not using lots of vocabulary…It was really pretty straight forward question…I found it really easy.
(Student #32: Test 1 Reading: 6.0; Test 2 Reading: 7.5)
In spite of the differences these students noted in university reading and IELTS Test reading, and in spite of the fact that some of the test items were ones students would not encounter in their studies, many of the students felt they were able to transfer reading skills they had developed as part of their studies to their reading for the Test. These skills included skimming for the main idea and scanning for details, guessing words from context and recognising paraphrases.
When you go through a paragraph I understand what they’re saying indirectly but before I don’t understand what they’re trying to say indirectly because most of the questions are not direct in IELTS. They are just indirect questions. And I always got confused with them but now I can realise, like, it’s indirectly saying or not…because in the assignments what you do is, like, you have a whole book and you paraphrase in your words so, you know, you’ve got more understanding in your mind.
(Student #31: Test 1 Reading: 6.5; Test 2 Reading: 8.5)
In uni, I have to read journals or, you know, text books…there’s lots of terminology I don’t know about that, so when I get the difficult words or I can’t understand I just skip it and imagine what it means…so, yeah, it help my IELTS reading to figure it out…‘cause you can’t read the whole of the journal…so, yeah, I think that helps me to get a good score.
(Student #13: Test 1 Reading: 7.0; Test 2 Reading: 7.5)
As was the case with students who failed to improve in the Listening, poor test-taking strategies or not feeling well at the time of the Test were explanations put forward for Reading results that students felt did not reflect their own estimation of their ‘real life’ reading skills. Some of the students were surprised they had not done better.
All of them is good. But you need to pick the best. That’s the tricky thing…I understood the topic. But the way to answer, like, pick the best answer, that’s maybe where I got wrong.
(Student #4: Test 1 Reading: 6.0; Test 2 Reading: 6.0)
It was in the end minute…last five seconds when I was handing over the paper, I just looked at it, there was a blank, 20 number was a blank, but when I looked at the question paper I did attempt that, so the answer for 20 went into 21 and the series continued from then on…so I have missed a lot of things, because reading was not difficult.
(Student #22: Test 1 Reading: 6.0; Test 2 Reading: 5.5)
One student, on the other hand, was surprised that for the Reading component of the Test, she achieved an almost perfect score. Her reaction was a rare instance of a student suggesting the IELTS results actually exaggerated her ‘real life’ proficiency in English. In an email to the Principal Researcher before the Test 2 results were available, she wrote:
Reading is my weakness not only in this exam but also over my English ability. As expected, it was really hard and kept going back to reading passages and questions continuously, wasting my time. As a result, I was running out of time, and realised I need to put more effort on reading. I think I was panicking when I got reading passages.
When interviewed after her Test 2 results were available, she said:
I didn’t expect that high score, seriously…because the last four question, I was running out of my time, so I just picked up randomly, it was true, false, not given question, so I just picked up true, true, false, like that, but it ended up with a nice score. Wow!
(Student #25: Test 1 Reading: 7.0; Test 2 Reading: 8.5)
5.4.2c Writing results and personal assessment of proficiency
The time allowed for the Writing component of the Academic module of the IELTS Test is 60 minutes. There are two writing tasks. The first task requires candidates to write a description of at least 150 words. This is based on material found in a chart, table, graph or diagram. For the second task, candidates write a short essay of at least 250 words in response to a statement or question. In both Test 1 and Test 2, the lowest mean score for the 40 students in this study was achieved in the Writing component of the Test (see Tables 2 and 3). The mean score for improvement from Test 1 to Test 2 was also the lowest in Writing (see Table 4). Of the 38 students interviewed, only 12 had improved in Writing from Test 1 to Test 2, 14 had achieved the same score and 12 a lower score.
Those students who had not improved were inclined to provide similar explanations for a lack of improvement in their Writing scores as they had provided for their lack of improvement in Listening and Reading scores (poor test-taking strategies, lack of practice, feeling unwell).
If I could, you know, given more time on the second one, the score could have been much better.
(Student #8: Test 1 Writing: 7.0; Test 2 Writing: 7.0)
Task 2, I really had no time. At that time I just had 15 minutes…you can imagine how roughly I did it.
(Student #38: Test 1 Writing: 6.0; Test 2 Writing: 6.0)
Those who had improved saw a connection between the writing skills they had developed in their university studies and what was required in the Writing component of the IELTS Test. Although most of the students noted that the actual tasks in the IELTS Test were dissimilar to the assignments they were required to write at university, they nevertheless could transfer their general understanding of the characteristics of academic writing. The need for clear essay structure, well-organised paragraphs with topic sentences and support details were mentioned, along with familiarity with a range of vocabulary.
The assignments really helped me a lot…Last time…I think I didn’t have, like, the arguments. I wasn’t, like, able to formulate an argument or the sides of the story that they’re asking and then this time the IELTS, when I took it here, I learned how to balance the arguments. I learned how to agree or disagree, which I learned from doing essays.
(Student #1: Test 1 Writing: 6.0; Test 2 Writing: 7.0)
It wasn’t different from uni. You have to explain things, describe things as well.
(Student #9: Test 1 Writing: 6.0; Test 2 Writing: 7.0)
I think doing lots of assignments at university and because I do read books a lot, I think that should have done something to my writing because assignments, they always ask you to write in an academic kind of English and…the English which we use in every day life, you can’t use that in assignments. So I think writing assignments really was a practice for me.
(Student #10: Test 1 Writing: 6.5; Test 2 Writing: 7.5)
I thought I was sitting like a test at uni, pretty much…It’s kind of the same format but obviously with different questions…I think I’m just, like, really used to writing essays.
(Student #34: Test 1 Writing: 6.0; Test 2 Writing: 8.0)
While a few of the students who were less successful in the Writing component blamed their poor test-taking strategies and poor time management, others were inclined to find fault with the Test itself. Some students pointed out that the writing required in the subjects they were studying was quite different. They noted that in the assignments that they were required to write at university, they did not have to quickly assemble ideas and arguments without a context. Most of their writing was based on recounting and evaluation of what they were directed to read by their lecturers. They were also able to use dictionaries and the spell and grammar checks in their computers to assist them. Some students made the point that they had achieved good grades for their written assignments and so believed that their writing skills were adequate. The lack of any correlation between IELTS scores and GPA presented in Section 5.3 is relevant here.
Assignments and IELTS writing task, it’s different. Assignments, you have to read a lot and you can, like, find some kind of, like, ideas from all the journals you are looking for. But IELTS writing, you actually have to think about the topic by yourself, on your own. You have to give those reasons by yourself. You don’t actually refer to those journals so maybe they look at your logical thinking, so not only your language skills, I think.
(Student #35: Test 1 Writing: 6.5; Test 2 Writing: 6.5)
When you do your assignment, you’re doing on computer, grammar checks, spelling checks are done by computer. If some line is wrong, the computer will tell you, you’re not writing by yourself, you’re just typing…so it really influence your writing in the Test.
(Student #32: Test 1 Writing: 6.5; Test 2 Writing: 6.5)
I’m not really satisfied with my Writing mark…because I think I did a good job, but I don’t know why I just got 6.0. I think it would improve much more better…I have no problem with my [assignment] essay and I usually get good mark for it.
(Student #21: Test 1 Writing: 6.0; Test 2 Writing: 6.0)
For the assignment, if I understand the subject, I can write because I got some idea, but in the IELTS exam, if I do not have much idea, I cannot write a very good essay, and so I cannot get a good mark.
(Student #2: Test 1 Writing: 6.5; Test 2 Writing: 6.0)
Other students were not concerned that the Writing component of the IELTS Test was different from the writing tasks required at university but rather, they were concerned that the particular writing tasks in the IELTS Test conducted on 10 July 2010 were ones that they found unusual and for which they found it difficult to produce content. For Task 1, candidates were required to compare in writing changes to a specific location illustrated in a series of maps. It so happened that almost all these students, in their previous experience of the IELTS Test, had been required to summarise information displayed in charts, tables or graphs. Their test preparation had focused heavily on appropriate vocabulary for describing increases and decreases in statistical data. And when confronted with maps, they were not sure what to do. This may partially explain why the mean for Task Achievement (adequately highlighting the main points and making appropriate comparisons) in Test 2 was actually lower than the mean for Task Achievement in Test 1.
I was given three maps…I have to describe the difference…I’ve never saw that kind of… I wrote more than 300 words…you have to arrange your thoughts and put in your limitation… I was writing the body when the examiner said ‘five minutes left’…I knew I would get low score.
(Student #12: Test 1 Writing: 7.0; Test 2 Writing: 5.5)
While some students found the question they were required to address for Task 2 both appropriate and interesting, others complained that they were being asked to consider a topic that did not hold a great deal of interest for them and one to which they had not previously given any thought. Again, this may partially explain why the mean for Task Response (supporting a position) in Test 2 was actually lower than the mean for Task Response in Test 1. There was a sense that an ability to assemble ideas and arguments for a wide range of topics was not one they considered related to general proficiency in English.
I thought that was a horrible topic…That’s something I have not thought about at all. I thought it was really strange…Young people are just not that interested in government.
(Student #9: Test 1 Writing: 6.0; Test 2 Writing: 7.0)
Only one student thought he had achieved a higher score than he thought he deserved, a score that exaggerated his ‘real life’ proficiency.
I honestly don’t know how I got [Band] 7.0 for Writing. I don’t know. Probably, well, I don’t think I actually used a lot of, like, good vocabulary or really academic vocabulary, but I remember I actually finished a whole writing, at least I finished, like, intro, body, conclusion…
(Student #36: Test 1 Writing: 6.5; Test 2 Writing: 7.0)
5.4.2d Speaking results and personal assessment of proficiency
The Speaking component of the Test takes the form of a face-to-face interview. Candidates are assessed on their use of spoken English to answer short questions, to speak at length on a familiar topic, and also to interact with the examiner. In both Test 1 and Test 2, the second lowest mean score for the 40 students in this study was achieved in the Speaking component of the Test (see Tables 2 and 3). The mean score for improvement from Test 1 to Test 2 was also the second lowest (see Table 4). Of the 38 students interviewed, 20 had improved in their Speaking score from Test 1 to Test 2, but seven had achieved the same score, and 11 a lower score (compared to only eight having a lower score in Listening).
As with the Writing component, students who were disappointed with their Speaking results were more inclined to see the problem as being with the testing situation than their own perceived level of proficiency in speaking. When asked a general question regarding their own perception of whether their proficiency in English had improved since they had been studying at university in Australia, all the students interviewed thought that it had. Most students understood this question to refer to their communicative ability in the spoken language. This was the language usage for which they had the most immediate and unambiguous feedback. When they had first arrived in Australia, they had had difficulty making themselves understood and understanding what was being said to them. Now, that problem was much reduced. Consequently, a score that did not reflect the increased communicative effectiveness that they were experiencing seemed an affront.
I think it’s funny. How come uni gets so much easier?…It’s just funny because back then I thought, yeah, yeah, I have a score of 7.5 in Speaking. I’m so good in speaking and everything else was worse…You would expect, because you actually live in a country…and you speak English all the time, that you are more fluent and that you are able to express yourself better. I don’t know. That’s just what I think…I would have just thought I’d have improved to an 8.0.
(Student #9: Test 1 Speaking: 7.5; Test 2 Speaking: 7.5)
If you’re looking for actual fluency, of course I’m a way much better than three years ago… I think throughout the three years I’ve improved a lot because I intentionally studied that and practised that.
(Student #7: Test 1 Speaking: 6.0; Test 2 Speaking: 6.5)
Some others attributed a failure to have achieved an improved score to their just not having a good day.
When I did it in my country, we did it on two different dates. So one day we would come and do the Speaking Test, that would be on a Friday, then earlier would be…the Reading, Listening and Writing…I didn’t have a fluent conversation, I kept going off the topic each time…I was very tired…I would just give the answer and stop…I didn’t give it my best shot… In real life I would say I’m much more at ease with speaking.
(Student #6: Test 1 Speaking: 8.0; Test 2 Speaking: 6.5)
A number of students had difficulty with the ‘familiar topic’ about which they were asked to speak at length, claiming that, for them, it was not a familiar topic or one that held any interest. This was often given as the reason for a poor performance, along with the experience of nervousness in a test situation. The assessment criterion of Fluency and Coherence was the one on which students made least improvement in Speaking. The students’ ability to speak at length and without hesitation on a topic, to give an overall response to the questions asked is assessed against this criterion. It might be seen as the Speaking equivalent of Task Achievement and Task Response in Writing. The mean improvement for Lexical Resource was also lower than that for Grammatical Range and Accuracy and for Pronunciation (see Table 13). Some students were limiting their potential to display their proficiency by not having anything to say on the topics that were presented to them. It would not be correct to attribute this lack of fluency to a lack of opportunities to use English in communication with native speakers of English in Australia, as some of the students with most access to English speakers in the Australian environment and who used English most in their daily lives were the ones who complained most about the questions asked and the topics on which they had to speak at length.
I thought that my English improved…I have a casual job and I used to speak a lot…He asked me about the news, and if I follow the news, but I’m not interested in it. And about fashion. I don’t understand much fashion, I just follow my way. I’m just more comfortable, yes, so, yes, probably I didn’t speak much. Very narrow topics!
(Student #3: Test 1 Speaking: 7.0; Test 2 Speaking: 5.5)
I went blank because of, like, citing an example that I was not that familiar of. That’s why I cannot defend that topic.
(Student #4: Test 1 Speaking: 7.0; Test 2 Speaking: 5.5)
I was very surprised that they give me only 6.0 for my Speaking, but I didn’t quite know why… Well, I think the reason was not, like, ‘cause my speaking, but my argument was not strong in the point, I think…I think the problem is speaking will depend on the topic as well, whether you’re familiar with it.
(Student #24: Test 1 Speaking: 7.0; Test 2 Speaking: 6.0)
However, not all students felt they had been unlucky with the topic they were asked to talk about at length. One student felt that the marked improvement in her result from Test 1 to Test 2 was due to her having been among the ‘lucky’.
I was thinking, whatever I’m saying, I’m not just saying it in English, I’m trying to go deep into the content, so that the examiner understand I do have some sort of knowledge on the specific question he was asking…When it come to a speaking exam, there’s a certain bit of luck that you need. So, if the topic that you’re asked, if you don’t really know that much, even if your English is good, you can’t really do very good. Maybe you can get a decent score, but not a very good score.
(Student #8: Test 1 Speaking: 6.5; Test 2 Speaking: 8.0)
In general, the students whose first language was a European one were most likely to have had access to English speakers in a wide range of communication contexts. This was less likely to be the case for students whose first language was an Asian one. Almost all the students, however, did have part-time jobs in which they were required to use English for work purposes. For the Nursing students, the jobs were as assistant nurses in hospitals or nursing homes.
The good thing about nursing is that you communicate with the people, the patients and other health professional.
(Student #11: Test 1 Speaking: 7.5; Test 2 Speaking: 8.5)
For others, the jobs were mostly in sales, although IT students did have part-time jobs in which they were using their IT skills. Some of the students of Asian background had family members who had been settled in Australia for a long time and for the children in these families, the dominant language was English. Conversations with these children allowed the students to develop their proficiency in spoken English. However, it seemed that involvement in church activities, including bible study classes, was for some of the East Asians the main context in which they used English outside university.
The [Bible study friends] are very patient.
(Student #29: Test 1 Speaking: 6.0; Test 2 Speaking: 7.0)
It has sometimes been suggested that a rough way of describing the difference between a user of English with a Band 6.0 in the IELTS Test and a user of English with a Band 7.0 is that the person who has achieved a Band 6.0 is still relying on translating from their native language, while a person who has achieved a Band 7.0 is ‘thinking’ in English (Hogan, cited in Birrell, 2006, p 60). A comment from one student supports this.
Now I can say what I want to say without converting the whole sentence from Korean to English…Before I had to think and translate, but now, yes, I would say it’s English that I use…
(Student #12: Test 1 Speaking: 6.0; Test 2 Speaking: 7.0)
5.4.3 Students who achieved an Overall 7.0 and 7.0 (or higher) in each component
As noted in Section 5.1, only six students from the 40 participants in the study achieved an Overall score of 7.0 or more, and a score of 7.0 or more in each of the components - the score that would enable them to apply for nursing registration or, until July 2011 when the points test was changed, a ‘Skilled Independent’ onshore permanent residence visa. Table 16 summarises the characteristics of these students.
| ID # | Faculty | Language background | Gender | Gap between tests (months) | Age (yrs) | Test attempts | Test 1 Overall IELTS band | Test 2 Overall IELTS band |
|---|---|---|---|---|---|---|---|---|
| 9 | Nursing | South Asian/ Filipino | F | 25-30 | 24 | 2 | 6.5 | 7.5 |
| 1 | Business | European | F | 31-36 | 25 | 2 | 6.5 | 7.5 |
| 10 | Nursing | South Asian/ Filipino | F | 25-30 | 20 | 2 | 7.0 | 8.0 |
| 8 | Eng/IT | South Asian/ Filipino | M | 31-36 | 22 | 2 | 7.0 | 7.5 |
| 33 | Business | East/SE Asian | F | 31-36 | 19 | 2 | 7.0 | 7.5 |
| 34 | Business | European | M | 31-36 | 22 | 2 | 7.5 | 8.0 |
Table 16: Characteristics of students who achieved Band 7.0 or higher in the Overall result and in each of the components
What is immediately apparent from this table is that these six students are not representative of the research study participants as a whole. While 22 of the 40 students in the study were from the Faculty of Nursing, Midwifery and Health (in other words, over half the research study participants), only two students - one third of the six achieving Band 7.0 or higher in the Overall result and in each of the components - were Nursing students. Again, while 22 of the students in the study had a language background categorised as East Asian or South-East Asian (Chinese, Korean, Vietnamese, Indonesian), only one of the six had such a language background. In other words, only one of these students had neither an English-medium education nor spoke a language in the Indo-European family as her first language.
Each of these six students had taken the IELTS Test twice only - once to meet the requirements of either a student visa or enrolment in the university, and once for this research. Only three of the six improved one Overall band from Test 1 to Test 2. Each had a very different reaction on receiving her results. One of the Nursing students, on reading her results, could scarcely hold back tears of joy. The cost of the IELTS Test she had saved by participating in this research, she would give to her family, she said. Had she not been able to achieve the IELTS scores required for registration as a nurse in Australia, she felt her study in Australia would have been a waste of money as she was already registered as a nurse in her country of origin. The purpose of studying for the same degree in Australia was to achieve a qualification that would have wider recognition. Later, during her interview, she did qualify her statement about a ‘waste of money’, acknowledging that what she had been learning in her course in Australia had value in itself. Nevertheless, her reaction does underscore the emotional investment that many international students have in success in the IELTS Test.
A very different reaction was displayed by the Faculty of Business student with a European language background. She had been living in Australia for three and a half years already, had lived together with English-speaking Australians since she had arrived and very seldom spoke her first language. Those friends she did have who shared her first language had partners who did not speak that language, so she used English even when socialising with friends of her nationality. Although there were many NESB students in the Faculty of Business, it so happened that in the particular program she was studying, there were very few, so almost all her classmates were native speakers of English. All that being the case, she was not pleased that her IELTS results did not reflect the degree of improvement that she felt she had made since living in Australia. She was displeased, in particular, with her Speaking score. The score for the Speaking component in her Test 1 was 7.5. Three and a half years later, in Test 2 her score for Speaking was again 7.5. She had no doubt, from her own experience of interacting with a wide range of people in Australia, that she was a much more fluent and intelligible speaker than she had been three and a half years ago. She attributed her failure to achieve a higher score for Speaking to the Test itself. In the interview for Test 1, she said she had been asked to talk about familiar topics such as family and Christmas celebrations whereas in Test 2, she had been asked to talk about government policy and social issues that were not of direct relevance to her. She did, however, achieve considerably higher scores in the Listening, Reading and Writing components and attributed these improvements, and the Reading and Writing improvements in particular, to her university studies.
The third student in this group of six achieving an Overall Band 7.0 or higher, and in each component of the test and who improved one Overall Band from Test 1 to Test 2, was another Faculty of Nursing student with a South Asian language background. She was one of the only two students who managed to achieve an Overall Band score of 8.0. Her Listening score of 8.0 was the same in both Tests, and her Reading score improved only half a band from 7.5 to 8.0. She was neither as pleased nor as disappointed as the other two students who had improved by one band, but accepted the results with some equanimity. She had an Overall score of 7.0 in Test 1 and 8.0 in Test 2. It was her Writing and Speaking scores that contributed most to her improvement, moving from 6.5 in Test 1 to 7.5 in Test 2. This student had had all her schooling in an English language medium school in her country. The experience recounted by other students in this study indicates that English-medium education does not in itself guarantee that a student has a high level of proficiency in the use of English, but in her case, it seems that English was used at all times in the school she attended. The use of English was very much encouraged in her family and she was an avid reader of English fiction. Unlike some of the other students from her faculty in this study, most of the students in her classes were local students and so she was able to learn colloquial English from them. Although she had been living in Australia only one and a half years, she already had a discernible Australian accent.
For the three other students who achieved no score under 7.0, the difference between their Test 1 Overall scores and their Test 2 Overall scores was just half a band. One of these was the student who had neither an English-medium education nor a language in the Indo-European family as her first language. She had learnt English as a foreign language for the 12 years of her schooling and had attended English classes after school for four hours a week for three years. She was currently studying in the Faculty of Business, did not have many friends in Australia with whom she spoke her first language, and used English as much as possible in as many situations as possible. She had for many years enjoyed listening to recorded English songs and reading English novels. She was currently learning Japanese to add to her linguistic repertoire. She was also the youngest student in the research study.
One of the other students whose Overall score had improved by half a band was an Engineering student with a South Asian language background who had been educated in English-medium schools. He achieved the same score for Listening, Reading and Writing in Test 1 as he did in Test 2. It was an improvement from 6.5 to 7.5 in Speaking that enabled him to improve his Overall score to 7.5 and to have no score under 7.0. He felt that he could have performed better in the Test had he had time to do some specific preparation beforehand. He felt his concentration had lapsed at the beginning of the Listening, that he had not managed his time well in the Reading as he was enjoying the passages for their own sake, and that he had not managed his time well in the Writing. In other words, he felt that his final result did not fully reflect his proficiency in English.
The third student in this group of successful students whose Overall score had improved by half a band was the other one of the only two students who managed to achieve an Overall score of 8.0. English was this student’s fourth language. He spoke one language at home with his parents and another at school and in the community, the national language of the country to which his family had immigrated. For some of his schooling, he had attended a bilingual school where English was a second language. He had also lived in a European country where he had developed his proficiency in what he described as his third language. His Test 1 results obtained at the commencement of his university study in Australia indicated that he already had a high level of proficiency in oral English. It was his reading and writing skills in English that needed improvement. These were the skills that had developed considerably during his years at university in Australia. In Test 1, he had achieved a score of 6.5 for Reading, while in Test 2 his Reading score was 7.5. The improvement in Writing was even more marked. In Test 1 he had a score of 6.0, while in Test 2 he had a score 8.0. In his current daily life, English was his most used language.
5.4.4 Students with the highest level of proficiency in English
As previously noted, only two of the 40 students in this study achieved an Overall score of 8.0 - a score that according to official IELTS descriptors indicates a ‘very good user’ of English, someone who has ‘fully operational command of the language with only occasional unsystematic inaccuracies and inappropriacies’ (International English Language Testing System, 2009, p 3). According to percentile ranks published on the IELTS website for academic candidates in 2009, of candidates who claimed in their application to have an English language background, only 2% gained an Overall score of 9.0 and 13% an Overall score of 8.5. The percentage for an Overall score of 8.0 was 20% and the remaining 65% achieved an Overall score below 8.0. In other words, the two students who gained an Overall score of 8.0 in Test 2 in this research study were displaying a proficiency in academic English at a higher level than many people who claimed to have English as their first language. This, of course, is not necessarily unexpected, as these students were already advanced in their university study, while many of the English language background students taking the IELTS Test for university entry may have been recent high school graduates with limited experience in reading or writing academic texts.
As shown in Table 16, the first language of one of the two students with an Overall score of 8.0 was a South Asian language (in this case, an Indian language). According to the data published on the IELTS website (International English Language Testing System, 2010e), her achievement of an Overall score of 8.0 meant that she matched the top 9% of academic candidates in 2009 sharing her first language. The first language of the other student was a European language. According to the data published on the IELTS website, his achievement of an Overall score of 8.0 meant that he matched the top 7% of academic candidates in 2009 sharing his first language.
While both of these students were achieving well enough in their studies, neither was among the highest academic achievers in the research study group, thus supporting the weak link between English language proficiency and academic achievement beyond a certain proficiency threshold level, discussed in Section 5.3. Perhaps what most distinguished both of these students from some of the other students in the research group was their interest in, and experience of, languages.
5.4.5 Students who achieved a Band score of 7.0 or more in all but one component
While only six of the 40 students achieved a score of 7.0 or more Overall and in each of the components of the IELTS Test, there were a further nine who managed to achieve 7.0 or more in all but one component. As Table 17 shows, for most of these students, it was in Writing that they failed to gain 7.0. In two cases, it was Reading. None of these students who were so close to achieving what they required for their various purposes, failed to achieve at least 7.0 in Listening or Speaking in Test 2. In other words, it was in the specifically academic components of the Test, the skill areas that are the main focus of university study, in which these students failed to achieve a score that would allow them to confidently present themselves as ‘good’ users of English. Seven out of the nine had an improved by one band in their Overall score, one the same, and only one had dropped in their Overall score (from 7.5 to 7.0). For several, Test 2 was not their second attempt at the IELTS Test. As can be seen in Table 17, two of these students were taking it for the fifth time and three for the third time. There is no information on one of the students’ test attempts as this student was one of the two who were not available for interview.
| ID # | Faculty | Language back-ground | Gen -der | No. of tests | IELTS Test 1 | IELTS Test 2 | ||||||||
|---|---|---|---|---|---|---|---|---|---|---|---|---|---|---|
| L | R | W | S | Over-all | L | R | W | S | Over-all | |||||
| 11 | Nursing | East/SE Asian | F | 3 | 6.5 | 7 | 6 | 7.5 | 7 | 7.5 | 8.5 | 5.5 | 8.5 | 7.5 |
| 12 | Nursing | East/SE Asian | F | 2 | 7.5 | 8.5 | 7 | 6 | 7.5 | 7.5 | 8 | 5.5 | 7 | 7 |
| 23 | Business | South Asian/Filipino | M | 2 | 8 | 6.5 | 7 | 7 | 7 | 7.5 | 7.5 | 6 | 7 | 7 |
| 27 | Nursing | South Asian/Filipino | F | ? | 7 | 7 | 6 | 6 | 6.5 | 7.5 | 7.5 | 6 | 7 | 7 |
| 29 | Nursing | East/SE Asian | F | 5 | 7.5 | 6.5 | 6 | 6 | 6.5 | 7.5 | 8.5 | 6 | 7 | 7.5 |
| 32 | Nursing | South Asian/Filipino | F | 3 | 7 | 6 | 6.5 | 6.5 | 6.5 | 7.5 | 7.5 | 6.5 | 8 | 7.5 |
| 36 | Nursing | East/SE Asian | F | 5 | 7.5 | 6 | 6.5 | 6 | 6.5 | 7.5 | 6.5 | 7 | 7 | 7 |
| 37 | Nursing | South Asian/Filipino | M | 2 | 7.5 | 5.5 | 6 | 6.5 | 6.5 | 7 | 6.5 | 7.5 | 7 | 7 |
| 39 | Eng/IT | East/SE Asian | M | 3 | 6.5 | 6 | 5.5 | 7 | 6.5 | 7 | 8 | 6.5 | 7 | 7 |
Table 17: Scores of students who achieved a score of 7.0 or more in all but one component
The eight students in this group who were interviewed had a range of explanations for their Writing or Reading result being lower than they had hoped. The two students who achieved a score of only 5.5 for Writing had anticipated a higher score immediately after the Test, perhaps 6.0, 6.5 or even 7.0. They were disappointed with the result, and offered poor time management and their lack of familiarity with the type of visual information in Task 1 as an explanation for why their Writing score was so low - a score that is considered inadequate for university study. Both these students, however, were doing well in their studies; one averaging Credits and the other Distinctions.
Other students also put forward poor time management as a reason for their not demonstrating a higher level of proficiency in Writing. One Nursing student pointed out that she regularly received Credits for her written assignments in her subjects, and thought the topics in the IELTS Test favoured Humanities students too much. Another explained that she was able to achieve Credits in her assignments because she was able to use the spelling and grammar checks in her word processor - something that was not possible when handwriting in the IELTS Test.
5.4.6 Students who regressed
The students whose Overall score was lower in Test 2 than in Test 1 were identified in Section 5.1.10b. As noted in that section, it was difficult to make generalisations based on demographic characteristics beyond these students being somewhat older than those who had shown most improvement in English language proficiency as measured by the IELTS Test. Four of the six had achieved an Overall score in Test 1 of 7.0 or 7.5. This was higher than the score required for entry to their courses and so a lower Overall score in Test 2 meant that they would still have qualified for entry to the university.
The results for each of the components of the Test are given in Table 18. None of these six students had made any improvement in Listening; for four, the Listening score was lower in Test 2 than in Test 1 and for two, it was the same. The pattern in Writing was similar; for three, the Writing score was lower in Test 2 and for three, the Writing score was the same. Only one of the six had improved in Reading from Test 1 to Test 2, while four had regressed and one had achieved the same result. The results for Speaking were slightly better: three had improved from Test 1 to Test 2, and three had regressed.
| ID # | Faculty | Language background | Gender | No. of tests | IELTS Test 1 | IELTS Test 2 | ||||||||
|---|---|---|---|---|---|---|---|---|---|---|---|---|---|---|
| L | R | W | S | Over-all | L | R | W | S | Over-all | |||||
| 5 | Nursing | East/SE Asian | F | 4 | 6.5 | 6 | 6 | 6.5 | 6.5 | 6 | 5.5 | 6 | 6 | 6 |
| 15 | Nursing | South Asian/Filipino | M | 2 | 6.5 | 6 | 6 | 6.5 | 6.5 | 6 | 6.5 | 6 | 6 | 6 |
| 14 | Nursing | East/SE Asian | F | ? | 7 | 8.5 | 6 | 6 | 7 | 7 | 6.5 | 6 | 6.5 | 6.5 |
| 30 | Nursing | South Asian/Filipino | M | 2 | 7 | 7.5 | 6 | 6.5 | 7 | 6.5 | 6.5 | 5.5 | 7 | 6.5 |
| 24 | Eng/IT | East/SE Asian | M | 3 | 8 | 7.5 | 6.5 | 7 | 7.5 | 7.5 | 7.5 | 6.5 | 6 | 7 |
| 12 | Nursing | East/SE Asian | F | 2 | 7.5 | 8.5 | 7 | 6 | 7.5 | 7.5 | 8 | 5.5 | 7 | 7 |
Table 18: Band scores of students who regressed from Test 1 to Test 2
Given the disappointing IELTS Test results for these six students, it is interesting to note that there was no apparent relationship between GPA and IELTS Test 2 results. In fact, one of the students whose achievement in Test 2 was lower than in Test 1 had a GPA of 3.31 (Distinction/High Distinction), a GPA higher than that of any of the other students in this study.
Five of these six students were interviewed after the Test 2 results were available. All were disappointed with their results, but there was some variation in their interpretations of why they had not improved. Two students specifically mentioned a different atmosphere in the test centre for Test 2 from that in the test centre where they had taken Test 1. Their Test 1 had been taken in a small test centre in their home country where they had felt more relaxed. They had been somewhat intimidated by the size of the test centre where they had taken Test 2. Two students attributed their less than satisfactory results to their not having had time to prepare before the Test. One had been ill for a week and was still on medication. For these students, and for others as well, the IELTS Test was considered to have elements of an achievement test - a test whose results would reflect what had been studied - rather than a proficiency test - a test of one’s general overall English language proficiency at a particular point in time. All of these students were at a loss to explain why their Listening results had not improved, some saying they had expected a higher score. One explained the lack of the improvement in Writing to poor time management in completing the Test. Most of the students whose Reading score had not improved were at a loss to explain why, as reading was a skill in which they had daily practice as part of their universities studies. The student who scored only 5.5 on Reading commented in an email after Test 2 that she found the ‘questions and answers were very tricky so I was chasing from limited time’. Nevertheless, she expected a Band score of 6.5. In regard to speaking English, all these students thought their speaking skills had improved since they had taken Test 1. One whose Speaking score was lower attributed it to his having been asked to speak about a topic in which he had no interest. Some of these students who were ‘repeat’ test-takers expressed the same frustration identified in the IELTS research of Mickan and Motteram (2009), some of whose study participants, having experienced variations in scores, thought ‘achievement on the Test was a matter of luck’ (p 241).
6 DISCUSSION
This section of the report reviews the five research questions in the light of the main findings of the study.
How much improvement, if any, on the IELTS Test can be expected of undergraduates who are completing higher education courses in an English-medium context in an English-speaking country?
The simple response to this question is that some improvement in English language proficiency as measured by the IELTS Test can be expected from undergraduate students who are completing higher education courses in an English-medium context, but the degree of improvement will vary greatly from student to student, and not all students will improve. According to the most recent IELTS Test results for the students in this study, some students may even achieve a lower Band score in the IELTS Test towards the end of their studies compared to what they achieved on enrolment in the university. Even for those students who do gain higher IELTS Test results after a period of two or three years of undergraduate study, this improvement is relatively slight. If they enter the university with the minimum English language proficiency requirements (as measured by the IELTS Test) for their course of study, most students are likely to improve to some extent. However, they are unlikely to have achieved the English language proficiency requirements for registration by the professional associations that apply to their area of study or those set by DIAC for a Skilled Independent Residence visa.
It has been acknowledged throughout this report that the sample of students is quite small and that any generalisations should be made with caution. Nevertheless, the findings suggest that the current practice of universities throughout Australia accepting into their programs students with the minimum required proficiency level of English (an Overall score of 6.5 in IELTS with 6.0 in Writing) is problematic. Many of these students have expectations of employment or permanent residence in Australia on graduation but, while professional organisations and DIAC require evidence of ‘good’ to ‘very good’ proficiency in English, these expectations are unlikely to be met, and the students, therefore, likely to be dissatisfied. The students who participated in this study did have sufficient proficiency in English to undertake their studies satisfactorily; however, in most cases, they did not have sufficient proficiency in English (as measured by the IELTS Test) to achieve their employment and permanent residence goals. Without concurrent support in developing proficiency in English (and most of the participants in this study did not access the concurrent English language support available, and accessed by some students, at the university), developing the proficiency required for employment is unlikely. (It should, nevertheless, be added that it cannot be assumed that their proficiency would have developed to the advanced degree required even if they did access such support.)
Is improvement in some components of the Test (Listening, Reading, Writing, Speaking) more or less likely than in others?
For the 40 participants in this study, the greatest improvement from Test 1 to Test 2 was in the Reading component. Some students improved by two bands in Reading, which contributed to the mean of improvement in Reading for the group as a whole as being 0.6 of a band - just over a half band score. When asked during the interviews to comment on their marked improvement in Reading, few students were surprised. In every subject there had been a great deal of reading required. While it was generally acknowledged that the type of reading required was different - the texts were much
longer, for example - most students felt they could transfer skills in recognising text structure, skimming and scanning to the test situation. A greater familiarity with sentence structure and a much wider recognition vocabulary acquired during their studies were also acknowledged as contributing to improved Reading scores.
The mean improvement for the group in Listening was 0.33 of a band. Given that these students had been attending classes and participating in Australian society for two to three years, the level of improvement was relatively small. Some students suggested that the result in Listening in their most recent IELTS Test did not fully reflect the improvements they thought they had made, and that this was the result of the testing situation itself. Nevertheless, the slight improvement after two or three years living and studying in Australia might be seen as disappointing.
The mean for the Listening improvement was, however, greater than the improvement for Speaking and Writing. The mean for the Speaking improvement for this group was just 0.16 of a band, and the mean for the Writing improvement for this group was even lower, just 0.11 of a band. Neither the improvement in Speaking nor in Writing was statistically significant. When interviewed, the students were more likely to contest the validity of their Speaking score than their Writing score. Most felt their ability to speak intelligibly in English had improved while they had been living and studying in Australia, and that they had direct evidence of this in their personal experience of being understood by the people to whom they talked, when once they had not. As previously noted, a number of the students when interviewed expressed some dissatisfaction with the selection of topics about which they were asked to talk.
Some students also expressed dissatisfaction with the topics they were asked to write about in the Writing tasks, although there was also some recognition by a few students that their ability to master the forms of written English had not improved a great deal between Test 1 and Test 2. While some students said that they were able to transfer skills they had developed in writing assignments in English to completing the IELTS Writing tasks, others focused on the differences in the tasks from their assignments and also in the method of assessment. Those students who had not improved in Writing between Test 1 and Test 2 emphasised the difference between the IELTS Writing tasks and university assessment tasks in sources of ideas and arguments for content, time allowed for completion and in the assessment criteria used. Most of the students said that comments provided by lecturers on their written assignments related to the subject information and arguments in their assignments but not to form at the sentence level. That all of these students were achieving at least a Pass grade and often Credits and Distinctions in subjects in which a great deal of the assessment is based on written tasks, appears to support their explanations.
The question arises from this finding as to whether universities have a responsibility for not only ensuring that their students master the content - the ideas, arguments and practices specific to the discipline areas in which the students are enrolled - but also, more generally, for developing the students’ communication skills and, specifically, English language proficiency. This has long been a disputed question among academics, with many continuing to hold the view that the development of English language skills is not their responsibility.
However, universities are now beginning to address this question. In 2008, DEEWR funded a project to develop a set of good practice principles for English language proficiency in academic studies. These principles are currently being extended into a set of implementation guidelines. The university in which the students in this study are enrolled adopted an English Language policy in 2010, the purpose of which is to recognise the role of the university in developing all students’ English language proficiency.
Which aspects of language use are most likely or least likely to contribute to improvement in Speaking and Writing?
While students’ comments during the interviews suggested that the feedback they had received for their assignments focused more on content than on grammatical range and accuracy, the sub-scores for the Grammatical Range and Accuracy criterion for the Speaking component of the IELTS Test 2 indicated that, while studying in Australia they had, in fact, acquired a better grasp of English grammar. The mean increase for Grammatical Range and Accuracy was 0.35 of a band. They had also improved to some extent in their pronunciation of English. Their sub-score for this criterion had improved by 0.23 of a band. Only one student in the study indicated that he had had some specific teaching to help him improve his pronunciation between Test 1 and Test 2. So, once again this positive development for a number of the students might best be explained by acquisition based on exposure and progressive attempts at modifying their speech to make themselves understood by others. The means for increases on the criteria of Fluency and Coherence and of Lexical Resource were much smaller - 0.05 and 0.1 of a band respectively - which may be consistent with the student comments during the interviews that, in many cases, they did not have very much to say about some of the topics they were asked to discuss.
The sub-scores for Writing indicated a similar problem for the students in the test situation in terms of their ability to respond appropriately to the questions asked. In regard to Task Achievement in the data description task (Task 1), and in Task Response in the essay task (Task 2), there was a mean decrease in score - minus 0.3 for the data description task and minus 0.13 for the essay task. There was a modest increase in the mean for the criteria of Lexical Resource and of Grammatical Range and Accuracy in both tasks and also in Coherence and Cohesion for the essay task, although not for the description task.
What these results suggest is that some English language development is taking place, even in the absence of specific English language tuition. However, in spite of the students’ professed ability to provide appropriate content in their written assessment tasks in their subjects (confirmed by satisfactory GPAs), many are hampered by limitations in their ability to talk or write about topics of which they do not have direct experience. Some students were inclined to blame the Test for this, arguing that the topics in both the Speaking and Writing components of the Test were not all of equal difficulty. Some suggested it was a matter of luck whether one was asked to talk or write about a familiar topic or not. On the one hand, this is a concern for the face validity of the Test itself. On the other hand, the students should be aware that to achieve a higher score, they should be able to handle less familiar contexts of language use. In other words, someone who aspires to professional employment should be able to converse on and write about a wide range of topics.
Does field of study have an influence on this improvement or lack of improvement?
Unfortunately, it was not possible to recruit equal numbers of students with similar backgrounds from each of the faculties targeted for this research. European students were over-represented within the students from the Faculty of Business, while the students recruited from the Faculties of Nursing, Midwifery and Health and Engineering and IT were almost exclusively Asian. In each of the faculties from which the students were drawn, there were cases of considerable gains in IELTS scores, as well as no gains and some regression. From the findings of this study, it appears that a student’s background may be more likely to affect the likelihood of improvement in IELTS scores than the particular program they are studying. At the university in which these students are enrolled, there is
some variation in the minimum IELTS requirement for enrolment. While most faculties require an Overall score of 6.5, Engineering programs have required an Overall score of 6.0, and Humanities and Social Science programs have required an Overall score of 7.0. These requirements may have been based on the likelihood of students satisfying the academic requirements of the programs.
What demographic and affective factors are associated with score gains or regression?
It is clear from this study that there is no ‘level playing field’ when it comes to developing proficiency in English. Some students are more likely to begin with a greater advantage than others. It helps if one has a European language background or if one has been educated in well-provisioned English-medium schools in a country where English is widely used as a second language, if one is relatively young, and if one is female. It also helps if one does have some sense of agency in improving one’s English. This can be achieved through seeking out English-speaking flatmates, part-time work opportunities, church social groups or engaging in reading above and beyond what is required for study. Affective factors also matter. It helps if one enjoys the activities in which one is using English.
If universities are concerned that some students are graduating with the same degree of proficiency in English they had when entering the university, or even with less proficiency, then they will need to institute programs that assist those students who have commenced their study in Australia with fewer advantages than others and less sense of agency. ‘Buddy’ programs that pair NESB students with local students (who may have to be rewarded for their efforts in some way), volunteer programs (for example, those involving retired university graduates who might assist the less advantaged students in regard to English proficiency development), and the embedding of English language support across all university courses are all strategies that can be implemented and, where they already exist, extended.
7 CONCLUSION
The research reported here was motivated by perceptions of the inadequacy in the use of English by many NESB international student graduates of Australian universities, as evidenced by their failure to find employment in the occupations for which they were academically qualified or to meet the English language proficiency requirements (as measured by the IELTS Test) of Skilled Independent Residence visas for settlement in Australia. The overarching research question was to establish whether it was reasonable to expect that the majority of students who had enrolled in undergraduate study programs with the minimum English language proficiency requirements as measured by the IELTS Test, could develop their English language proficiency sufficiently to graduate with the IELTS Test score required for professional registration or for permanent residence in Australia. The findings have indicated that the answer is that those students who do achieve this degree of improvement are the exception rather than the rule. No student among this group of 40 achieved an Overall score of at least 8.0, as well as a score of at least 8.0 in all components of the Test - the requirement for maximum points for English language proficiency in the new points system for Skilled Independent Residence visas that came into practice in July 2011.
There are implications for all stakeholders in the IELTS Test from this finding. If Australian universities are not inclined to raise English language proficiency requirements for entry into university courses, and there is every indication that they are not, then it is vital that they adopt a wide range of measures to ensure strategies to address issues of English language proficiency development are in place. The Good practice principles for English language proficiency for international standards in Australian universities published by DEEWR (2008) has endorsed this need. There is
now much scope for the implementation of these principles. It might, however, be argued that for those university programs for which achievement of a particular IELTS score is, effectively, a requirement for graduation, such as is the case in Nursing, students be accepted into the program only if they have already achieved the IELTS requirement for professional registration, in other words, if they already have an Overall IELTS score of 7.0, with 7.0 in each component.
Students who have chosen to study in Australia with a view to applying for a visa leading to permanent residence upon graduation need to be made aware of how difficult it is to progress from an IELTS score of 6.0 in Speaking and Writing (at which one might still be translating from one’s own language) to an IELTS score of 7.0 (at which one is likely to be ‘thinking’ in English). If their previous experience in pre-sessional English language study was that of progressing from IELTS score 5.0 to IELTS score of 6.0 after three months of intensive English language study, a not uncommon experience, then it is important that they understand that this rate of progress is much less likely at the higher band levels. Those who promote study in Australia and other English-speaking countries have a responsibility to raise students’ awareness of this fact.
Students should also be aware that their own agency is important in English language proficiency development. Satisfying their academic study requirements alone is unlikely to prepare them to meet the ‘unfamiliar’ topics they may encounter in the IELTS Test, particularly in the Speaking and Writing components. Language is always used to communicate about something, it is not purely form. Students need to be aware that a ‘good’ user of English can talk or write about a wide variety of topics, including those that may be less familiar to them. The IELTS Test is a proficiency test that looks forward to what the test candidate might be able to do in future situations, not an achievement test assessing a body of content of which the candidate has been notified in advance. It may be more difficult for students with some demographic characteristics than others to immerse themselves in an English-speaking environment. Nevertheless, from the interviews conducted for this research, it is clear that those students who do make the effort to broaden their experience of English do benefit.
Finally, there are implications for those responsible for the development of the IELTS Test and for its use. While it has been argued in the previous paragraph that it is incumbent on students to broaden their range of interests and be prepared to discuss relatively unfamiliar topics in the Speaking and Writing components of the Test, it is equally incumbent on the item writers for the Test, that the topics are ones with which a reasonably educated user of English should have some awareness, if not immediate experience.
As Davies (2008) makes clear, the IELTS Test was developed to assess whether a student’s proficiency in English was sufficient for them to be able to participate successfully in English-language medium university study. In Australia in recent years, however, there has been a growth in students using other means of English language proficiency assessment to satisfy university English language requirements, mostly through intensive English for Academic Purposes ‘direct entry’ courses provided by institutions attached to the universities. Candidates for the IELTS Test in Australia today are not only students hoping to begin university studies, but increasingly they are students at the point of finishing their university studies who are hoping to display a level of proficiency in English that indicates they could be employed in professions for which they are academically qualified. Relatively little research to date has investigated the relationship of IELTS scores to the proficiency of English required in a range of different professions. There is much scope now for research in this area.
ACKNOWLEDGEMENTS
I would like to thank IELTS Australia, the British Council and Cambridge ESOL for supporting this research, as well as the two anonymous reviewers. I am grateful to Anton Leung and Dianne Moffat from the UTS IELTS Centre for facilitating the enrolment of the students in the July 2010 IELTS Test, and to Dr Roslyn Appleby, Dr Ross Forman, Associate Professor Bob Pithers and Joseph Yeo who read earlier drafts of the report and provided valuable feedback. I would particularly like to thank Sang-Eun Oh whose research assistance included undertaking the statistical analysis for this research. Finally, I am grateful to all the students who participated in the research and who responded so articulately during the interviews.
References
- Arkoudis, S, Hawthorne, L, Baik, C, Hawthorne, G, O’Loughlin, K, Leach, D and Bexley, E, 2009, Executive Summary, The impact of English language proficiency and workplace readiness on the employment outcomes of tertiary international students, Centre for the Study of Higher Education, The University of Melbourne, Melbourne
- Avdi, E, 2011, ‘IELTS as a predictor of academic achievement in a Master’s Program’ in EA Journal, vol 26, no 2, pp 42-49
- Birrell, B, 2006, ‘Implications of low English standards among overseas students at Australian universities’, People and Place, vol 14, no 4, p 60
- Cresswell, J, 2003, Research design: qualitative, quantitative and mixed method approaches, 2nd edn, Sage, Thousand Oaks, California
- Davies, A, 2008, Assessing academic English: Testing English proficiency 1950-1989 - the IELTS solution, Studies in Language Testing 23, Cambridge University Press, Cambridge
- Department of Education, Employment and Workplace Relations, 2008, Good practice principles for English language proficiency for international students in Australian universities, accessed 16 November 2010 from <www.deewr.gov.au/HigherEducation/Publications/Pages/GoodPracticePrinciples.aspx>
- Department of Immigration and Citizenship, 2010, Introduction of new points test, DIAC, accessed 11 November 2010 from < www.immi.gov.au/skilled/general-skilled-migration/pdf/points-fact.pdf>
- Dooey, P and Oliver, R, 2002, ‘An investigation into the predictive validity of the IELTS Test’ in Prospect, vol 17, no 1, pp 36-54
- Elder, C, 1993, ‘Language proficiency as a predictor of performance in teacher education’ in Melbourne Papers in Language Testing, vol 2, no 1, pp 68-85
- Elder, C and O’Loughlin, K, 2003, ‘Investigating the relationship between intensive English language study and band score gain on IELTS’, IELTS Research Reports Volume 4, ed R Tulloh, IELTS Australia Pty Limited, Canberra, pp 207-241
- Feast, V, 2002, ‘The impact of IELTS scores on performance at university’ in International Education Journal, vol 3, no 4, pp 70-85
- Green, A, 2004, ‘Making the grade: score gains on the IELTS writing test’ in Research Notes, 16, University of Cambridge ESOL examinations, pp 9-13
- Green, A, 2005, ‘EAP recommendations and score gains on the IELTS Academic Writing test’ in Assessing Writing, vol 10, pp 44-60
- Humphreys, P and Mousavi, A, 2010, ‘Exit testing: a whole of university approach’ in Language in Education in Asia, vol 1, pp 1-15, accessed 13 December 2010 from <http://camtesol.org/language_education_in_asia_vol1_2010.html>
- Ingram, D and Bayliss, A, 2007, ‘IELTS as a predictor of academic language performance, Part 1’, IELTS Research Reports Volume 7, IELTS Australia, Canberra and British Council, London, pp 137-191
- International English Language Testing System, 2009, Information for candidates, University of Cambridge ESOL Examinations, the British Council and IDP Education Australia
- International English Language Testing System, 2010a, IELTS: institutions - professional associations, accessed 10 November 2010 from <www.ielts.org/institutions/global_recognition/professional_associations.aspx>
- International English Language Testing System, 2010b, IELTS speaking band descriptors (public version), accessed 10 November 2010 from <www.ielts.org/PDF/UOBDs_SpeakingFinal.pdf>
- International English Language Testing System, 2010c, IELTS task 1 writing band descriptors (public version), accessed 10 November 2010 from <www.ielts.org/PDF/UOBDs_WritingT1.pdf>
- International English Language Testing System, 2010d, IELTS task 2 writing band descriptors (public version), accessed 10 November 2010 from <www.ielts.org/PDF/UOBDs_WritingT2.pdf>
- International English Language Testing System, 2010e, Percentile ranks 2009, accessed 3 November 2010 from <www.ielts.org/researchers/analysis_of_test_data/percentile_ranks_2009.aspx>
- Kerstjens, M and Nery, C, 2000, ‘Predictive validity in the IELTS Test’, IELTS Research Reports Volume 3, IELTS Australia Pty Limited, Canberra, pp 85-108
- Merrifield, G, 2008, ‘An impact study into the use of IELTS as an entry criterion for professional associations - Australia, New Zealand and the USA’, IELTS Research Reports Volume 8, ed J Osborne, IELTS Australia, Canberra, pp 283-323
- Mickan, P and Motteram, J, 2009, ‘The preparation practices of IELTS candidates: case studies’, IELTS Research Reports Volume 10, ed J Osborne, IELTS Australia, Canberra and British Council, London, pp 223-262
- Miles, M and Huberman, A, 1994, Qualitative data analysis, Sage, Thousand Oaks, California
- Moore, T and Morton, J, 2005, ‘Dimensions of difference: a comparison of university writing and IELTS writing’ in Journal of Academic Purposes, vol 4, no 1, pp 43-66
- Nursing and Midwifery Board of Australia 2010, Explanatory notes and frequently asked questions: English language skills, 17 August 2010, accessed 10 November 2010 from <www.nursingmidwiferyboard.gov.au/FAQ-and-Fact-Sheets.aspx>
- O’Loughlin, K and Arkoudis, S, 2009, ‘Investigating IELTS exit score gains in higher education’, IELTS Research Reports Volume 10, ed J Osborne, IELTS Australia, Canberra and British Council, London, pp 95-180
- Woodrow, L, 2006, ‘Academic success of international postgraduate education students and the role of English proficiency’, University of Sydney Papers in TESOL, vol 1, pp 51-70
- University of Technology, Sydney 2010, UTS at a glance, accessed 29 October 2010 from <www.uts.edu.au/about/facts/index.html>
APPENDIX 1: INTERVIEW SCHEDULE
Identifier: _____________
Investigating IELTS Score Gains in Higher Education
(This interview guide is to be used as a basis for discussion between interviewer and student participant. The form is completed by the interviewer.)
Bio-data
| Field | Response |
|---|---|
| Gender | Male / Female |
| Age | _____________ |
| Country of origin | _______________________________________ |
| First language | _______________________________________ (If Chinese, note dialect) |
| Other languages spoken | _______________________________________ |
Area of Study
| Option |
|---|
| Business |
| Communication |
| Design, Architecture and Building |
| Education |
| Information Technology |
| Engineering |
| International Studies |
| Law |
| Nursing, Midwifery and Health |
| Science |
Year of course: ________________
Principal motivation for participating in this research
Choose one only.
| Option |
|---|
| To support an application for a permanent residence visa to Australia |
| To support an application for a permanent residence visa to another country |
| For recognition of professional qualifications |
| To support an application for further study |
| To get an idea of one’s current English language proficiency level |
| Other: _________________________________________________________________ |
Formal English Study apart from IELTS Preparation
| In country of origin | Duration |
|---|---|
| Years in school | ______ |
| Years in university | ______ |
| Months/years in other institution | ______ |
| Other details | _________________________________ |
| In Australia | Duration |
|---|---|
| Years in school | ______ |
| Years in university foundation program | ______ |
| Months/years in ELICOS program | ______ |
| Months/years in other institution | ______ |
| Other details | _________________________________ |
| In country other than home country or Australia | Duration |
|---|---|
| Where? | ____________________________ |
| Years in school | ______ |
| Months/years in ELICOS program | ______ |
| Months/years in other institution | ______ |
| Other details | _________________________________ |
Previous exposure to English
| Experience | Details |
|---|---|
| Length of time living in Australia | Years ______________ Months ______________ |
| Length of time living in other English-speaking country, if any | Country _______________________________________________ Years ______________ Months ______________ |
| Length of time living in other English-speaking country, if any (if more than one) | Country _______________________________________________ Years ______________ Months ______________ |
Additional notes:
University study
| Question | Options | Follow-up |
|---|---|---|
| When you began your UG course at UTS did you think your English was good enough to cope well with your studies in Australia? | Yes / No / Unsure | Why or why not? |
| Do you feel your English has improved while you have been studying at UTS? | Yes / No / Unsure | Why or why not? |
| Have you been enrolled in a ‘communication’ subject as part of your program, e.g. Engineering Communication, Communication for IT professional? | Yes / No / Unsure | If ‘yes’, which one? |
| Have you attended any ELSSA Centre workshops? | Yes / No / Unsure | If ‘yes’, which one(s)? |
| Have you sought any other English language support to help you cope with your studies, e.g. help with your assignments? | Yes / No / Unsure | If ‘yes’, what kind of help? |
Additional notes:
IELTS Experience
Number of previous attempts at IELTS (excluding July 2010): ______
IELTS Results (Academic module after July 2007; before July 2008) provided as part of research
Overall: ____ Speaking ____ Listening ____ Reading ____ Writing ______ Date: _______
| Preparation for test | Response |
|---|---|
| No specific preparation | ______ |
| Self-study | ______ |
| IELTS Preparation classes | ______ |
| Number of weeks | ______ |
Other IELTS Results (not including those used in quantitative research project)
Academic/General Training
Overall: ____ Speaking ____ Listening ____ Reading ____ Writing ______ Date: _______
| Preparation for test | Response |
|---|---|
| No specific preparation | ______ |
| Self-study | ______ |
| IELTS Preparation classes | ______ |
| Number of weeks | ______ |
Other IELTS Results (not including those used in quantitative research project)
Academic/General
Overall: ____ Speaking ____ Listening ____ Reading ____ Writing ______ Date: _______
| Preparation for test | Response |
|---|---|
| No specific preparation | ______ |
| Self-study | ______ |
| IELTS Preparation classes | ______ |
| Number of weeks | ______ |
IELTS Results (July 2010)
Overall: ____ Speaking ____ Listening ____ Reading ____ Writing ______ Date: _______
| Question | Options | Follow-up |
|---|---|---|
| Do you think the latest IELTS Test results are overall a good indication of your proficiency in English? | Yes / No / Not sure | |
| How does your current Speaking score compare with the first one? | Improved / Same / Lower | How do you account for this? |
| How does your current Listening score compare with the first one? | Improved / Same / Lower | How do you account for this? |
| How does your current Reading score compare with the first one? | Improved / Same / Lower | How do you account for this? |
| How does your current Writing score compare with the first one? | Improved / Same / Lower | How do you account for this? |
Use of English outside class
| Topic | Notes |
|---|---|
| Accommodation experience (with whom, how long) | |
| Work experience in Australia or other English-speaking country (with whom, how long) | |
| English-medium media exposure (television, radio, films, etc., how often) | |
| Sporting activities with use of English (with whom, how often) | |
| English-medium social activities at university (with whom, how often) | |
| English-medium social activities outside university (with whom, how often) |
Thank student for participation and assure them of anonymity in any report produced.
APPENDIX 2: DIFFERENCE IN TEST 1 AND TEST 2 SCORES
Differences in Test 1 and Test 2 scores according to field of study
Listening
ANOVA
| Sum of Squares | df | Mean Square | F | Sig. | |
|---|---|---|---|---|---|
| Between Groups | 0.4828 | 2 | 0.241 | 0.430 | 0.654 |
| Within Groups | 20.7922 | 37 | 0.562 | ||
| Total | 21.2750 | 39 |
,
Reading
ANOVA
| Sum of Squares | df | Mean Square | F | Sig. | |
|---|---|---|---|---|---|
| Between Groups | 2.7494 | 2 | 1.375 | 1.676 | 0.201 |
| Within Groups | 30.3506 | 37 | 0.820 | ||
| Total | 33.1000 | 39 |
,
Writing
ANOVA
| Sum of Squares | df | Mean Square | F | Sig. | |
|---|---|---|---|---|---|
| Between Groups | 1.1545 | 2 | 0.577 | 1.037 | 0.364 |
| Within Groups | 20.5893 | 37 | 0.556 | ||
| Total | 21.7438 | 39 |
,
Speaking
ANOVA
| Sum of Squares | df | Mean Square | F | Sig | |
|---|---|---|---|---|---|
| Between Groups | 1.5184 | 2 | 0.759 | 1.138 | 0.331 |
| Within Groups | 24.6753 | 37 | 0.667 | ||
| Total | 26.1938 | 39 |
,
Overall
ANOVA
| Sum of Squares | df | Mean Square | F | Sig. | |
|---|---|---|---|---|---|
| Between Groups | 0.2701 | 2 | 0.135 | 0.547 | 0.583 |
| Within Groups | 9.1299 | 37 | 0.247 | ||
| Total | 9.4000 | 39 |
,
Differences between Test 1 and Test 2 scores according to language background
Listening
ANOVA
| Sum of Squares | df | Mean Square | F | Sig. | |
|---|---|---|---|---|---|
| Between Groups | 1.3072 | 2 | 0.654 | 1.211 | 0.309 |
| Within Groups | 19.9678 | 37 | 0.540 | ||
| Total | 21.2750 | 39 |
,
Reading
ANOVA
| Sum of Squares | df | Mean Square | F | Sig. | |
|---|---|---|---|---|---|
| Between Groups | 0.2510 | 2 | 0.126 | 0.141 | 0.869 |
| Within Groups | 32.8490 | 37 | 0.888 | ||
| Total | 33.1000 | 39 |
,
Writing
ANOVA
| Sum of Squares | df | Mean Square | F | Sig. | |
|---|---|---|---|---|---|
| Between Groups | 0.8661 | 2 | 0.433 | 0.767 | 0.471 |
| Within Groups | 20.8776 | 37 | 0.564 | ||
| Total | 21.7438 | 39 |
,
Speaking
ANOVA
| Sum of Squares | df | Mean Square | F | Sig. | |
|---|---|---|---|---|---|
| Between Groups | 3.1756 | 2 | 1.588 | 2.552 | 0.092 |
| Within Groups | 23.0182 | 37 | 0.622 | ||
| Total | 26.1938 | 39 |
,
Overall
ANOVA
| Sum of Squares | df | Mean Square | F | Sig. | |
|---|---|---|---|---|---|
| Between Groups | 0.4935 | 2 | 0.247 | 1.025 | 0.369 |
| Within Groups | 8.9065 | 37 | 0.241 | ||
| Total | 9.4000 | 39 |
,
Difference between Test 1 and Test 2 scores according to gender
Listening
ANOVA
| Sum of Squares | df | Mean Square | F | Sig. | |
|---|---|---|---|---|---|
| Between Groups | 0.9361 | 1 | 0.936 | 1.749 | 0.194 |
| Within Groups | 20.3389 | 38 | 0.535 | ||
| Total | 21.2750 | 39 |
,
Reading
ANOVA
| Sum of Squares | df | Mean Square | F | Sig. | |
|---|---|---|---|---|---|
| Between Groups | 0.1473 | 1 | 0.147 | 0.170 | 0.683 |
| Within Groups | 32.9527 | 38 | 0.867 | ||
| Total | 33.1000 | 39 |
,
Writing
ANOVA
| Sum of Squares | df | Mean Square | F | Sig. | |
|---|---|---|---|---|---|
| Between Groups | 0.0353 | 1 | 0.035 | 0.062 | 0.805 |
| Within Groups | 21.7084 | 38 | 0.571 | ||
| Total | 21.7438 | 39 |
,
Speaking
ANOVA
| Sum of Squares | df | Mean Square | F | Sig. | |
|---|---|---|---|---|---|
| Between Groups | 1.0889 | 1 | 1.089 | 1.648 | 0.207 |
| Within Groups | 25.1049 | 38 | 0.661 | ||
| Total | 26.1938 | 39 |
,
Overall
ANOVA
| Sum of Squares | df | Mean Square | F | Sig. | |
|---|---|---|---|---|---|
| Between Groups | 0.4512 | 1 | 0.451 | 1.916 | 0.174 |
| Within Groups | 8.9488 | 38 | 0.235 | ||
| Total | 9.4000 | 39 |
,
Differences between Test 1 and Test 2 scores according to gap between tests
Listening
ANOVA
| Sum of Squares | df | Mean Square | F | Sig. | |
|---|---|---|---|---|---|
| Between Groups | 0.261 | 2 | 0.130 | 0.241 | 0.787 |
| Within Groups | 18.950 | 35 | 0.541 | ||
| Total | 19.211 | 37 |
,
Reading
ANOVA
| Sum of Squares | df | Mean Square | F | Sig. | |
|---|---|---|---|---|---|
| Between Groups | 0.579 | 2 | 0.289 | 0.328 | 0.722 |
| Within Groups | 30.875 | 35 | 0.882 | ||
| Total | 31.454 | 37 |
,
Writing
ANOVA
| Sum of Squares | df | Mean Square | F | Sig. | |
|---|---|---|---|---|---|
| Between Groups | 1.588 | 2 | 0.794 | 1.473 | 0.243 |
| Within Groups | 18.866 | 35 | 0.539 | ||
| Total | 20.454 | 37 |
,
Speaking
ANOVA
| Sum of Squares | df | Mean Square | F | Sig. | |
|---|---|---|---|---|---|
| Between Groups | 1.341 | 2 | 0.671 | 1.030 | 0.368 |
| Within Groups | 22.797 | 35 | 0.651 | ||
| Total | 24.138 | 37 |
,
Overall
ANOVA
| Sum of Squares | df | Mean Square | F | Sig. | |
|---|---|---|---|---|---|
| Between Groups | 0.261 | 2 | 0.130 | 0.540 | 0.587 |
| Within Groups | 8.450 | 35 | 0.241 | ||
| Total | 8.711 | 37 |
,
Difference between Test 1 and Test 2 scores according to age
Listening
ANOVA
| Sum of Squares | df | Mean Square | F | Sig. | |
|---|---|---|---|---|---|
| Between Groups | 0.275 | 1 | 0.275 | 0.498 | 0.485 |
| Within Groups | 21.000 | 38 | 0.553 | ||
| Total | 21.275 | 39 |
,
Reading
ANOVA
| Sum of Squares | df | Mean Square | F | Sig. | |
|---|---|---|---|---|---|
| Between Groups | 0.736 | 1 | 0.736 | 0.865 | 0.358 |
| Within Groups | 32.364 | 38 | 0.852 | ||
| Total | 33.100 | 39 |
,
Writing
ANOVA
| Sum of Squares | df | Mean Square | F | Sig. | |
|---|---|---|---|---|---|
| Between Groups | 0.394 | 1 | 0.394 | 0.701 | 0.408 |
| Within Groups | 21.350 | 38 | 0.562 | ||
| Total | 21.744 | 39 |
,
Speaking
ANOVA
| Sum of Squares | df | Mean Square | F | Sig. | |
|---|---|---|---|---|---|
| Between Groups | 0.435 | 1 | 0.435 | 0.642 | 0.428 |
| Within Groups | 25.759 | 38 | 0.678 | ||
| Total | 26.194 | 39 |
,
Overall
ANOVA
| Sum of Squares | df | Mean Square | F | Sig. | |
|---|---|---|---|---|---|
| Between Groups | 0.683 | 1 | 0.683 | 2.977 | 0.093 |
| Within Groups | 8.717 | 38 | 0.229 | ||
| Total | 9.400 | 39 |
,
Author biodata
Elizabeth Craven
Elizabeth Craven is a lecturer in academic language and learning at the University of Technology, Sydney. She has many years of experience in secondary, pre-university and university educational settings as a teacher, a program coordinator and a researcher. She has worked in a number of countries in Asia, as well as in Australia, and has been involved with IELTS examining since 1990.