
Investigating the cognitive and social aspects of IELTS speaking performances across proficiency levels: Comparing the CAF-based and register-linguistic analyses
Official IELTS research report on Examiners and Scoring - Speaking; IELTS Test - Speaking; Scoring, published in 2023.
Abstract
Identifying linguistic correlates of speaking ability is an important domain of research in second language (L2) speaking assessment, which contributes to the understanding of speaking ability as a theoretical construct.
The standard practice of linguistic analysis in validation research starts with quantifying an array of linguistic features of test performances, followed by dimension reduction techniques to identify underlying dimensions of speaking ability. However, existing research varies considerably in the selection of linguistic features, falling largely under one of three approaches, namely, (1) the CAF-based approach which operationalises speaking ability through form-focused features; (2) the register-linguistic approach which explores lexico-grammatical features in relation to linguistic functions; and (3) acoustic-pronunciation features related to speech intelligibility and comprehensibility.
While there is a large body of literature in each strand, fewer studies have combined features from all three strands.
The present study examined a wide range of linguistic features selected from all three approaches on 280 benchmark performances from Band 5 to 8 on the IELTS speaking test, to identify meaningful linguistic correlates of IELTS speaking ability.
Descriptive statistics and correlational analyses revealed a number of linguistic features in each category that correlate significantly with IELTS band scores. Findings of this study reflect the different subconstructs of speaking ability and provide validity evidence for the IELTS speaking test.
1. Introduction
The project examined the relationships among an array of performance features and holistic band levels of speaking proficiency. The performance features investigated in this study largely correspond to the four rating criteria used to score IELTS speaking performances and are features that have been found to characterise spoken discourse and advanced L2 speaking proficiency (e.g., Biber, 1988; 2006; Biber, Gray, & Staples, 2016; Jamieson & Poonpon, 2013; Kang, 2013; LaFlair, Staples, & Egbert, 2015).
Specifically, this project will examine speaking performance features in two approaches: complexity, accuracy, fluency-based (CAF-based) and register-linguistic analyses (Biber, 1988; Biber et al., 2016). While CAF-based analysis follows a more cognitively-oriented framework, register-linguistic analysis explicates language performance from more social and functional perspectives.
2. Theoretical framework and background
2.1. Socio-cognitive framework for test validation
This project is situated within the socio-cognitive framework for test development and validation (O’Sullivan & Weir, 2011; Weir, 2005). The validation framework contains five key components (i.e., cognitive validity, context validity, scoring validity, criterion-related validity, and consequential validity) and stresses the interaction among different types of validity evidence in building a coherent validity argument for language tests. This project will examine performance features on the IELTS speaking test from both cognitive and social perspectives, providing evidence of the cognitive, context, and scoring validity of the test. Specifically, an array of complexity, accuracy, and fluency (CAF) features will be examined to represent speech production under cognitive frameworks, e.g., the Cognition Hypothesis (Robinson, 2001) and the Trade-off Hypothesis (Skehan, 1998). The social aspects of speaking performance will be examined through register-based linguistic analysis of lexico-grammatical features (Biber, 1988; Biber et al., 2016). This analysis will explicate speaking performance from a more socially and functionally oriented perspective, thus providing evidence of the context validity of the test. While both approaches provide evidence of scoring validity for the IELTS speaking test, the comparison of the effectiveness of these two approaches will shed light on the interactions among these different types of validity evidence and contribute to a coherent validity argument for the test.
2.2. L2 speech production under cognitive frameworks: Complexity, accuracy, and fluency features
The construct of L2 performance and proficiency has long been recognised as multi-componential and multi-dimensional. A cognitive perspective operationalises proficiency as comprising three principal components: complexity, accuracy, and fluency (Ellis, 2008; Ellis & Barkhuizen 2005; Skehan, 1998). As such, CAF features have been widely used to characterise test performances and test-taker proficiency levels in both L2 speaking and writing assessments (Housen & Kuiken, 2009). The CAF framework is most notably tied to the cognitive perspective through the Cognition Hypothesis (Robinson, 2001) and the Trade-off Hypothesis (Skehan, 1998). Under both hypotheses, manipulation of task design is assumed to lead to greater cognitive complexity, which in turn has been associated with greater grammatical complexity, operationalised in terms of holistic T-unit measures for writing and C- or AS-unit measures for speech.
In Skehan’s model, there is a trade-off between complexity, accuracy, and fluency due to constraints on performance, while in Robinson’s model, task complexity can lead to increases in all three areas. In terms of lexical complexity, the most commonly included feature in the CAF framework is type-token ratio. Accuracy is generally operationalised as type and frequency of errors (e.g., percentage of error-free T-units, frequency of errors, types of errors) while fluency in the CAF approach has most often been examined at the macro level, measuring and correlating temporal features with other linguistic features or overall language proficiency. Although most validation studies from both perspectives have only included macro-level fluency features, micro-level fluency features that focus more on disfluencies (the cognitive processes of pausing and recovery) have been shown to be related to general language proficiency, reflecting speakers’ automaticity in accessing lexico-grammatical resources while maintaining the flow of speech (see, e.g., Clark & Fox Tree, 2002; Corley & Stewart, 2008; Dornyei & Kormos, 1998).
2.3. Register-linguistic features of spoken discourse
Different from the CAF perspective, the register-linguistic perspective takes a functional approach to language use, and is based on sociolinguistic principles (e.g., Hymes, 1974; Biber & Conrad, 2019; Biber et al., 2022). Under this framework, a register is a situation of language use. Linguistic features vary according to contextual factors, such as setting, mode, topic, communicative purpose, and proficiency level, and can be interpreted functionally. Register-linguistic features of speaking performances were initially investigated mostly to highlight differences between spoken and written discourse. The foundation of this research is the work of Biber (1988; 2006) and his colleagues (e.g., Biber, Gray & Poonpon, 2011), who argue that complexity of spoken discourse is represented by clausal subordination, rather than phrasal features (e.g., attributive adjectives). Biber, Gray and Staples (2016) used this approach to investigate spoken and written performances on the TOEFL iBT and found different patterns of development based on both mode and task type (integrated or independent).
This approach varies dramatically from the T-unit based measures found in CAF-based studies.
The register-linguistic approach not only examines the complexity of spoken discourse but also highlights its functional aspects. First, taking the clausal complexity features mentioned above (e.g., finite adverbial clauses, relative clauses), these have been found to differ depending on their function in spoken discourse. For example, studies of spoken language have shown that finite adverbial clauses expressing causation are used more at lower levels of proficiency (Biber et al., 2016; Thirakunkovit et al., 2019). This particular structure was highlighted by Biber et al. (2011) as “Stage 1” of development, and is used for creation of arguments but at a less sophisticated level when compared with other structures (i.e., verb complement clauses, relative clauses). On the other hand, relative clauses have been found to increase with proficiency level across oral texts (Thirakunkovit et al., 2019), as they allow speakers to incorporate more extended discussion of information (i.e., they elaborate the noun phrase). In addition, pragmatic skills such as expression of stance are known to be important aspects of spoken interactions and may vary across spoken registers (Biber, 1988; Biber, 2006; Staples & Biber, 2014). Using a register-based linguistic framework, LaFlair, Staples and Egbert (2015) showed that higher scoring test-takers on the MELAB speaking task used more stance features such as certainty and likelihood adverbs (definitely, possibly, maybe) and mental verbs (e.g., think) in their Oral Proficiency Interviews. On the other hand, Yan and Staples (2016) found that overt stance expressions such as mental verbs (e.g., think) were characteristic of lower-scoring argumentative essays. These differences reflect in part the relatively higher interpersonal functions found in speech, even within assessment contexts. Stance in academic writing is expected to be less overt and more nuanced, due to the need to appear objective.
2.4. Acoustic-pronunciation features relevant to spoken proficiency
Although L2 pronunciation constitutes an important domain of research in applied linguistics, the incorporation of acoustic-pronunciation features and constructs of comprehensibility, intelligibility, and accentedness in language testing research is relatively sparse. Previous L2 pronunciation research shows that perceptions of comprehensibility and accentedness are closely associated with speaker’s fluency (e.g., Derwing, Rossiter, Munro & Thomson, 2004; Trofimovich & Isaacs, 2012) and complexity (e.g., Saito, Trofimovich & Isaacs, 2015). Pronunciation features were also found to significantly discriminate IELTS score levels in Isaacs, Trofimovich, Yu and Chereau (2015). In addition, Kang and Moran (2014) made a distinction between errors on high and low functional-load sounds and found that errors related to the former were more discriminating across learners of different proficiency levels. Therefore, we argue that micro-level fluency features and pronunciation features should be included as part of the validation process for speaking assessment.
There have been several studies that examined linguistic features of IELTS speaking performances in the domains of cohesion and coherence (Iwashita & Vasquez, 2015), lexical resources (Read & Nation, 2006), pronunciation (Isaacs et al., 2015), and discourse organisation (Seedhouse & Harris, 2011). Instead of examining an individual domain, Brown (2006) operationalised all four rating criteria for the IELTS speaking test in a wider range of CAF-based features, in order to identify individual linguistic features that best distinguish speaking performances across proficiency levels. However, to our knowledge, a register-linguistic approach to analysing language performance has not been applied on IELTS speaking performances to explore its ability to distinguish speaking performances across IELTS proficiency levels. This study will represent the first endeavour to investigate the linguistic features in IELTS speaking performance in both CAF and register-linguistic approaches. In addition, this study will incorporate acoustic-pronunciation features in the linguistic analysis of IELTS speaking performances.
3. Research design and method
Using a mixed-methods approach, this project aims to achieve three goals: (1) to identify salient CAF features that distinguish IELTS speaking performance across proficiency levels; (2) to identify salient register-linguistic features that distinguish speaking performances across proficiency levels; and (3) to identify salient acoustic-pronunciation features that distinguish speaking performances across proficiency levels.
3.1. Research questions
Specifically, this project seeks to address the following three research questions.
- What CAF-based features tend to distinguish test-taker performances at different band levels on the IELTS speaking test?
- What register-linguistic based features tend to distinguish test-taker performances on the IELTS speaking test?
- What pronunciation-acoustic features tend to distinguish test-taker performances on the IELTS speaking test?
3.2. Corpus
The spoken corpus used for this study comprises 282 benchmark speech samples drawn from responses to the Long Run (Part II) task on the IELTS speaking test.
Table 1 shows the specific breakdown of speakers across band levels. As can be seen, the data is mostly evenly spread across the four bands. Each speech sample was edited to include only the test-taker speech. In addition, we used only the initial response of the test-taker (i.e., when the examiner started to ask any follow up questions, we treated this as a shift to the next section of the exam and omitted that speech from our analysis). Trained transcribers segmented the audio file into speech and silence (using Praat), then adjusted pause boundaries as necessary and transcribed speech orthographically (using ELAN).
Table 1: Corpus used for the study
| Level | L1 background | Gender | Total number of words | Mean length of interaction (words) |
|---|---|---|---|---|
| Band 5 (71 files) | Chinese (23) Punjabi (22) Arabic (26) | Female (24) Male (21) Unknown (26) | 16,774 | 236.25 |
| Band 6 (72 files) | Chinese (22) Punjabi (23) Hindi (1) Arabic (26) | Female (35) Male (11) Unknown (26) | 20,329 | 282.35 |
| Band 7 (74 files) | Chinese (24) Punjabi (24) Arabic (25) | Female (27) Male (21) Unknown (25) | 23,118 | 312.41 |
| Band 8 (65 files) | Chinese (18) Punjabi (20) Hindi (2) Arabic (25) | Female (24) Male (16) Unknown (25) | 21,118 | 324.89 |
3.3. Data analysis
3.3.1 Linguistic analysis
Variables included in this study were divided roughly into three categories: register-linguistic features, CAF measures, and fluency and pronunciation features, which fell into both categories. Table 2 summarises the dependent variables included in the study.
3.3.1.1 CAF-based features
CAF features included a range of distinguishing features identified in previous research. In terms of complexity, syntactic complexity was operationalised in terms of commonly used AS-unit measures. These measures include: number of AS-unit (Foster et al., 2000). Lexical complexity was operationalised as type-token ratio. In terms of lexical appropriateness and grammatical accuracy, errors were identified in the domains of syntax, morphology, and lexicon. The frequency of errors were transformed into normalised frequencies of errors per type.
Fluency features included both rate and pausing features. Macro-level rate and pausing features of each speech sample (i.e., speech rate, articulation rate, number of silent pauses) were extracted using the combination of the mark-pause Praat script by Mietta Lennes (http://www.helsinki.fi/\~lennes/praat-scripts/) and the “qdap” R package, a transcription-based syllable counter (https://www.rdocumentation.org/packages/qdap/versions/2.4.3). In addition, several micro-level pausing features were either manually coded or extracted directly from ELAN, which include (1) pause type (i.e., silent vs. filled pause); (2) pause duration; and (3) pause recovery (i.e., repetition and reformulation).
3.3.1.2 Register-linguistic features
Register-linguistic features were determined based on previous research on spoken corpora (e.g., Biber, 1988; Biber, 2006), as well as analysis of assessment-specific corpora (e.g., Biber et al., 2016; LaFlair et al., 2015; Thirakunkovit et al., 2019). These features fall roughly into three categories: clausal complexity features (e.g., finite adverbial clauses and relative clauses); phrasal complexity features (e.g., pre-modifying nouns, attributive adjectives); and stance features (e.g., modals, personal pronouns).
These features were identified using the Biber tagger and TagCount (Biber, 1988; Biber, 2006). The Biber tagger automatically identifies linguistic features, including those listed in Table 2. First, fixtagging scripts developed by Author 2 were run to improve the accuracy of tags using known issues with the tagger. Next, a 10% subset of the data was examined for accuracy (focusing on precision and recall). This led to several modifications to the text files (e.g., removing false starts and hesitation markers for this part of the analysis), which improved the accuracy of most of the features of interest to >90%. However, further remediation was needed for verb complement clauses, and thus files were manually fixtagged to ensure accuracy of this feature.
3.3.1.3 Acoustic-pronunciation features
Pronunciation features were analysed manually with Praat. Two prosodic features that have been found to show meaningful differences across score levels from previous research were included in the analysis: tone choice (level, falling, or rising), and prominence (stressed syllables). Tone choice was manually coded by two coders, using the theoretical framework provided by Brazil (1987) and coding procedures established in Staples (2015). Two coders coded 10% of the data, and were able to reach a kappa of .77, which was deemed acceptable for proceeding with the analysis. The rest of the data was coded separately by one of the two coders. Prominence was similarly coded by two coders, and accuracy evaluated on 10% of the data. Intraclass correlation coefficients were used to establish accuracy of prominence. The two-way mixed, single measures reached an ICC of .83, which was deemed acceptable for proceeding with the analysis. The rest of the data was coded separately by one of the two coders.
In terms of pronunciation errors, we also manually identified pronunciation errors associated with high functional-load vowels, initial consonants, and final consonants. Upon identification of the errors, we transformed them into normalised frequencies.
Table 2: Dependent variables included in the study
| Variable | Description/Example |
|---|---|
| CAF features | |
| Complexity | Type-token ratio, number/mean length of AS-unit |
| Accuracy | Number of morphological/syntactic/lexical errors |
| Fluency | Speech, articulation rate, mean length of run, number/duration of pauses, number of repair |
| Register-linguistic features: clausal complexity | |
| Finite adverbial clauses-causative | e.g., The source on internet are not that reliable because anybody can post on internet |
| Finite relative clauses-that | e.g., The first country that I really wanted to go to was Spain |
| Verb complement clauses-that | e.g., I think that it is a great experience to live there. |
| Verb complement clauses-to | e.g., Before I joined college I want to study economic |
| Register-linguistic features: phrasal complexity | |
| Attributive adjectives | e.g., good friend |
| Premodifying nouns | e.g., graduation ceremony |
| Register-linguistic features: stance | |
| First person pronouns | I, me, my, we, our, ours |
| Second person pronouns | You, your, yours |
| Modals-all | e.g., can, could, would, should |
| Stance adverbials-certainty | e.g., certainly, definitely |
| Stance adverbials-likelihood | e.g., maybe, possibly |
| Mental verbs | e.g., know, think, believe |
| Acoustic-pronunciation features | |
| Prominence (space) | Proportion of prominent words to total number of words. Prominence was determined manually, by two coders, using pitch height, length, and volume to identify prominent syllables. |
| Tone choice (level, falling, rising) | Proportion of each of the three tone choices. Tone choice is operationalised as the pitch movement from the final prominent syllable in a tone unit to the end of the tone unit. Tone units were operationalised as runs for the purposes of this study. Tone choice was determined manually, by two coders. |
| Pronunciation errors | Number of high functional load errors - vowel, initial consonant, final consonant |
3.3.2 Data analysis
Upon the identification of the linguistic features described above, frequencies for each performance feature were calculated for each speech sample. Descriptive statistics of individual performance features were examined. To address RQ 1, frequencies of all CAF features were subject to correlation analyses with IELTS band scores. To address RQ 2, frequencies of all register-linguistic features were subjected to correlation analysis with IELTS band scores. Similarly, to answer RQ 3, we correlated acoustic pronunciation features with IELTS band scores.
4. Results
4.1. CAF features
Table 3 shows the descriptive statistics by IELTS score level on the CAF-based features. In terms of complexity, there is an increasing trend in type-token ratio with proficiency level. In addition, test-takers with higher scores (Level 7 and 8) tend to produce more AS units.
With respect to accuracy, there is a gradually decreasing trend in normalised frequencies of syntactic, morphological, and lexical errors as proficiency level increases. However, the trend for morphological errors is more pronounced than syntactic and lexical errors.
For fluency features, the majority of features presented an expected trend with proficiency. That is, as proficiency level increases, test-takers tend to be able to produce speech at a fast rate, with fewer and shorter pauses and fewer repairs. Among these features, speech rate, mean length of run, and mean duration of pauses showed stronger associations with proficiency level.
Correlations between individual features and IELTS band scores corroborate with the descriptive statistics (see Table 4), suggesting the following most meaningful linguistic correlates with IELTS speak scores in this category: speech rate (.67), mean length of run (.40), mean length of pause (-.44), type-token ratio (.54), normalised morphological error (-.51). Figures 1 to 5 present the means plots for the meaningful correlations across IELTS band score levels. With the exception of mean pause length, all other features, i.e., type-token ratio, speech rate, mean length of run, and normalised morphological errors showed linear increasing or decreasing trends with IELTS band scores. In the case of pause length, although it is clear that higher scoring test-takers have shorter pauses, the decreasing trend is not linear.
Table 3: Descriptive statistics for CAF-based features by score level
| Variable | Level 5 (N = 71) M (SD) 95% CIs | Level 6 (N = 71) M (SD) 95% CIs | Level 7 (N = 74) M (SD) 95% CIs | Level 8 (N = 65) M (SD) 95% CIs |
|---|---|---|---|---|
| Complexity | ||||
| Number of AS_unit | 15.89 (5.51) | 18.41 (5.64) | 21.88 (7) | 21 (5.82) |
| Number of AS_unit | (15.89, 5.51) | (17.1, 19.72) | (20.31, 23.45) | (19.22, 22.78) |
| Type-token ratio | 19.45 (3.96) | 22.26 (2.40) | 23.79 (2.13) | 24.43 (2.80) |
| Type-token ratio | (18.51, 20.39) | (21.69, 22.83) | (23.29, 24.28) | (23.74, 25.13) |
| Accuracy | ||||
| Syntactic errors | 4.14 (2.98) | 4.18 (3.15) | 4.01 (2.85) | 2.88 (2.35) |
| Syntactic errors | (4.14, 2.98) | (3.45, 4.92) | (3.37, 4.65) | (2.16, 3.6) |
| Morphological errors | 12.6 (6.8) | 10.69 (6.36) | 8.32 (5.94) | 4.85 (3.74) |
| Morphological errors | (12.6, 6.8) | (9.21, 12.17) | (6.98, 9.65) | (3.71, 6) |
| Lexical errors | 2.16 (2) | 1.79 (1.48) | 1.24 (1.21) | 0.83 (0.9) |
| Lexical errors | (2.16, 2) | (1.44, 2.13) | (0.97, 1.52) | (0.55, 1.1) |
| Fluency | ||||
| Speech rate | 2.6 (0.59) | 3.14 (0.72) | 3.41 (0.49) | 3.68 (0.63) |
| Speech rate | (1.44, 2.74) | (1.73, 3.3) | (2.45, 3.52) | (2.45, 3.83) |
| Articulation rate | 3.43 (0.57) | 3.95 (0.81) | 4.14 (0.49) | 4.4 (0.53) |
| Articulation rate | (2.32, 3.57) | (2.35, 4.14) | (3.18, 4.25) | (3.37, 4.53) |
| Mean length of run | 8.06 (3.96) | 9.5 (4.03) | 10.75 (3.35) | 12.94 (4.87) |
| Mean length of run | (0.3, 8.98) | (1.6, 10.44) | (4.19, 11.52) | (3.39, 14.12) |
| Number of filled pauses | 31.04 (19.52) | 29.51 (16.11) | 26.4 (11.77) | 23.43 (13.09) |
| Number of filled pauses | (31.04, 19.52) | (25.74, 33.29) | (23.7, 29.1) | (19.37, 27.48) |
| Number of silent pauses | 24.23 (8.76) | 26.76 (11.47) | 23.99 (8.36) | 21.08 (10.48) |
| Number of silent pauses | (24.23, 8.76) | (24.09, 29.43) | (22.08, 25.89) | (17.83, 24.32) |
| Mean duration of silent pauses | 0.71 (0.28) | 0.58 (0.17) | 0.53 (0.12) | 0.55 (0.21) |
| Mean duration of silent pauses | (0.15, 0.78) | (0.25, 0.62) | (0.29, 0.56) | (0.14, 0.6) |
| Number of repetitions | 11.05 (7.33) | 9.03 (7) | 7.63 (5.25) | 7.65 (8.52) |
| Number of repetitions | (11.05, 7.33) | (7.39, 10.67) | (6.43, 8.84) | (5.01, 10.29) |
| Number of reformulations | 8.11 (4.73) | 7.57 (4.1) | 7.44 (3.63) | 6.75 (4.08) |
| Number of reformulations | (8.11, 4.73) | (6.6, 8.53) | (6.61, 8.27) | (5.49, 8.01) |
Table 4: Correlations between score level and CAF variables
| Variable | Pearson’s correlation with score level | P value |
|---|---|---|
| Complexity | ||
| Type-token ratio | 0.54 | <.001 |
| Accuracy | ||
| Morphological errors | -0.51 | <.001 |
| Fluency | ||
| Speech rate | 0.67 | <.001 |
| Mean length of run | 0.40 | <.001 |
| Mean duration of silent pauses | -0.44 | <.001 |
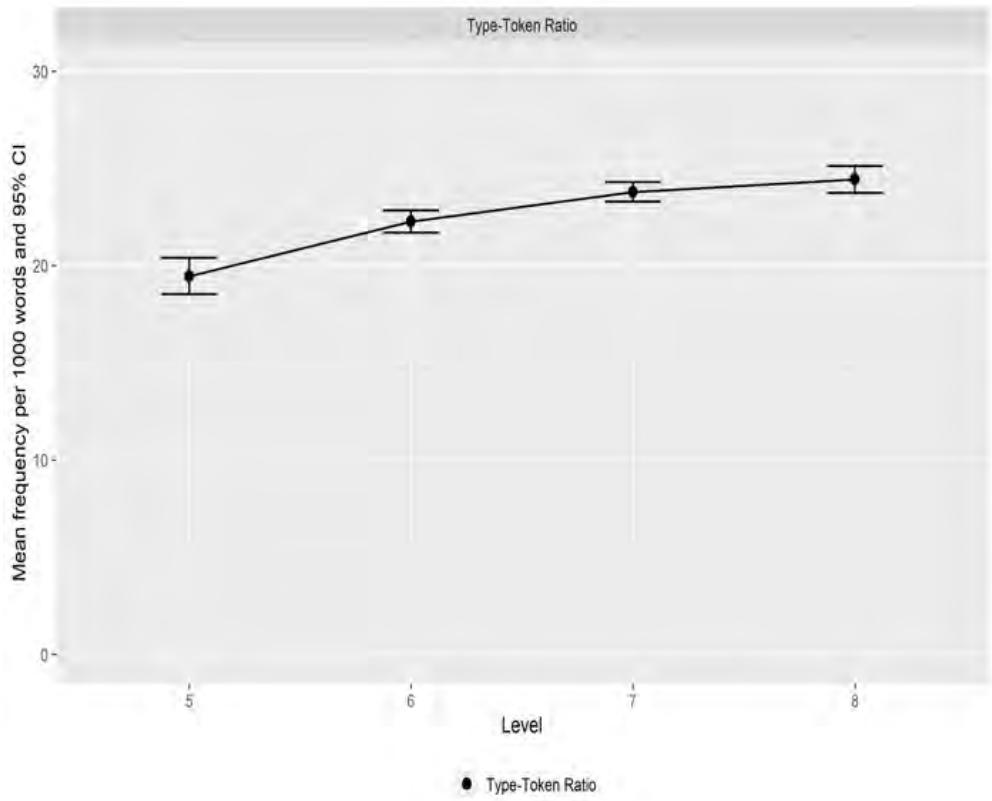
Figure 1: Means and 95% CIs for type-token ratio across IELTS level.
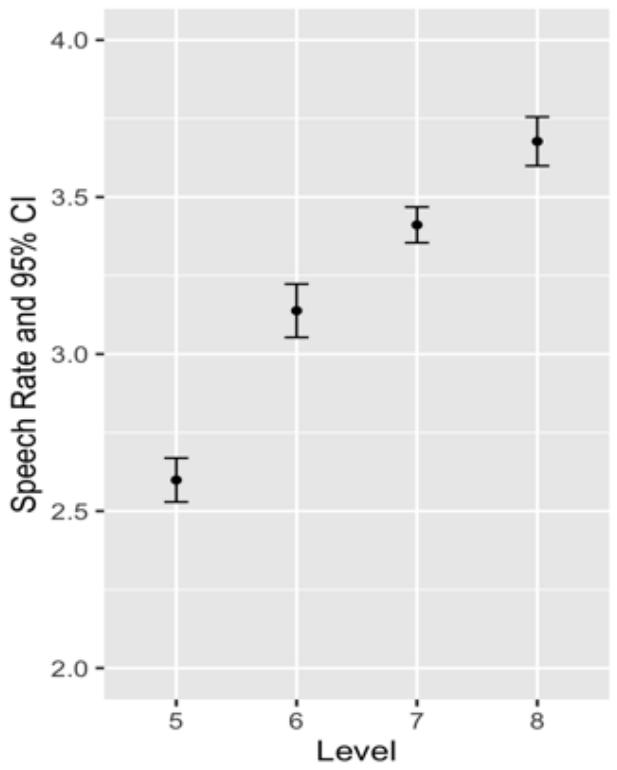
Figure 2: Means and 95% CIs for speech rate across IELTS level
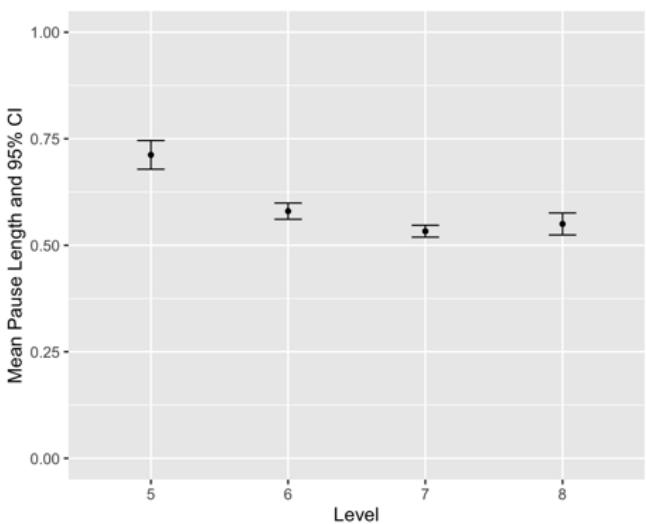
Figure 3: Means and 95% CIs for mean pause length across IELTS level
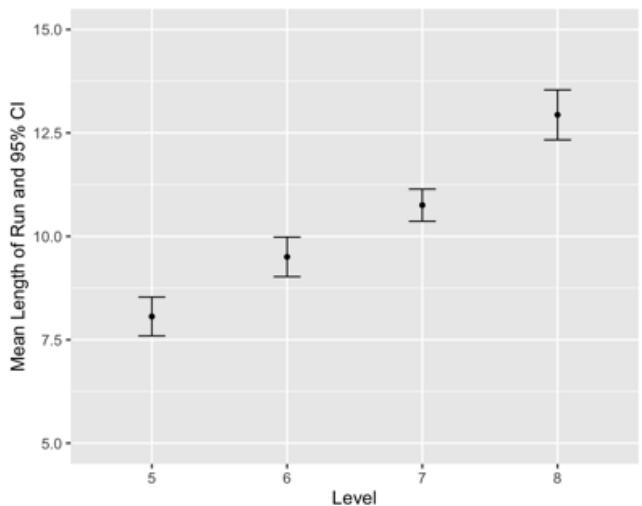
Figure 4: Means and 95% CIs for mean length of run across IELTS level
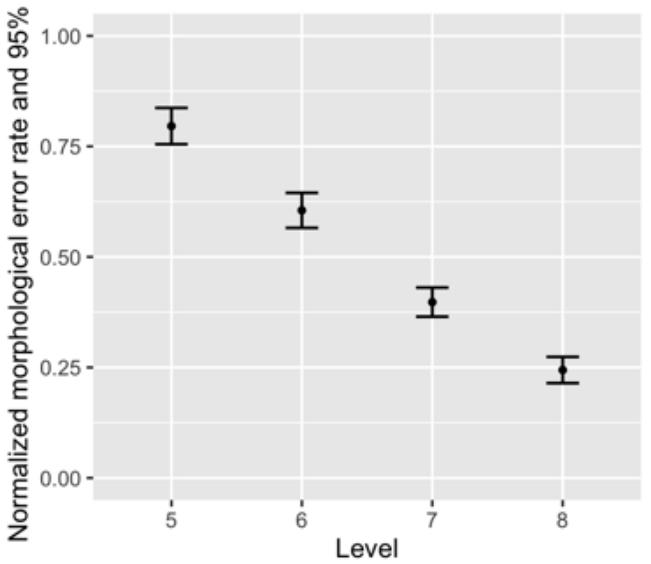
Figure 5: Means and 95% CIs for normalised morphological error rate across IELTS level
4.2. Register-linguistic features
Tables 5 and 6 below show the mean frequencies and correlations of each of the linguistic features across score level. As can be seen from Table 5, there were a number of differences across levels for clausal complexity features and stance features, but phrasal complexity features were used about the same across levels.
Table 5: Descriptives of register-linguistic features by level
| Variable | Level 5 (N = 71) M (SD) 95% CIs | Level 6 (N = 71) M (SD) 95% CIs | Level 7 (N = 74) M (SD) 95% CIs | Level 8 (N = 65) M (SD) 95% CIs |
|---|---|---|---|---|
| Clausal complexity features | ||||
| Subordinate clauses-causative | 9.83 (8.84) | 8.21 (7.42) | 7.24 (5.73) | 5.55 (5.55) |
| Subordinate clauses-causative | 7.74-11.92 | 6.46-9.97 | 5.92-8.57 | 4.18-6.93 |
| That relative clauses | 3.06 (5.94) | 5.34 (7.72) | 5.49 (5.93) | 6.05 (6.72) |
| That relative clauses | 1.66-4.47 | 3.51-7.17 | 4.12-6.87 | 4.38-7.71 |
| That verb compl clauses | 1.36 (2.82) | 3.90 (6.06) | 3.39 (4.48) | 5.38 (5.41) |
| That verb compl clauses | 0.69-2.03 | 2.47-5.34 | 2.35-4.42 | 4.04-6.72 |
| To verb compl clauses | 12.21 (11.03) | 8.70 (7.02) | 9.47 (8.45) | 8.74 (8.29) |
| To verb compl clauses | 9.60-14.82 | 7.04-10.37 | 7.52-11.43 | 6.69-10.79 |
| Phrasal complexity features | ||||
| Attributive adjectives | 21.11 (14.68) | 24.46 (15.73) | 25.95 (14.27) | 25.96 (14.62) |
| Attributive adjectives | 17.63-24.58 | 20.74-28.18 | 22.65-29.26 | 22.34-29.58 |
| Premodifying nouns | 13.29 (10.74) | 11.67 (9.28) | 13.77 (9.07) | 12.20 (7.94) |
| Premodifying nouns | 10.75-15.83 | 9.50-13.85 | 11.67-15.87 | 10.23-14.17 |
| Stance features | ||||
| First person pronouns | 112.04 (49.37) | 92.06 (34.04) | 85.07 (34.10) | 81.63 (33.88) |
| First person pronouns | 100.35-123.72 | 84.00-100.12 | 77.17-92.97 | 73.23-90.02 |
| Second person pronouns | 6.11 (14.36) | 6.20 (10.11) | 8.51 (9.61) | 13.04 (13.86) |
| Second person pronouns | 2.71-9.51 | 3.80-8.59 | 6.29-10.74 | 9.61-16.48 |
| All modal verbs | 17.17 (15.31) | 16.31 (12.58) | 17.71 (12.33) | 18.09 (13.39) |
| All modal verbs | 13.54-20.79 | 13.33-19.29 | 14.85-20.57 | 14.77-21.40 |
| Stance adverbials-certainty | 5.49 (9.48) | 7.79 (9.17) | 11.19 (10.47) | 12.72 (10.31) |
| Stance adverbials-certainty | 3.24-7.73 | 5.62-9.96 | 8.77-13.62 | 10.16-15.27 |
| Stance adverbials-likelihood | 1.69 (4.11) | 2.07 (4.18) | 1.82 (3.81) | 1.52 (3.20) |
| Stance adverbials-likelihood | 0.72-2.67 | 1.08-3.06 | 0.94-2.70 | 0.72-2.31 |
| Mental verbs | 45.38 (27.51) | 35.81 (19.31) | 41.92 (20.66) | 39.95 |
| Mental verbs | 38.87-51.90 | 31.24-40.38 | 37.13-46.71 | 35.56-44.34 |
Figure 6 shows the means and 95% CIs for the clausal complexity features that showed non-overlapping CIs (finite adverbial clauses-causatives and verb + that complement clauses). These two features showed different patterns: causative finite adverbials decreased across score level and finite verb complement clauses increased across score level.
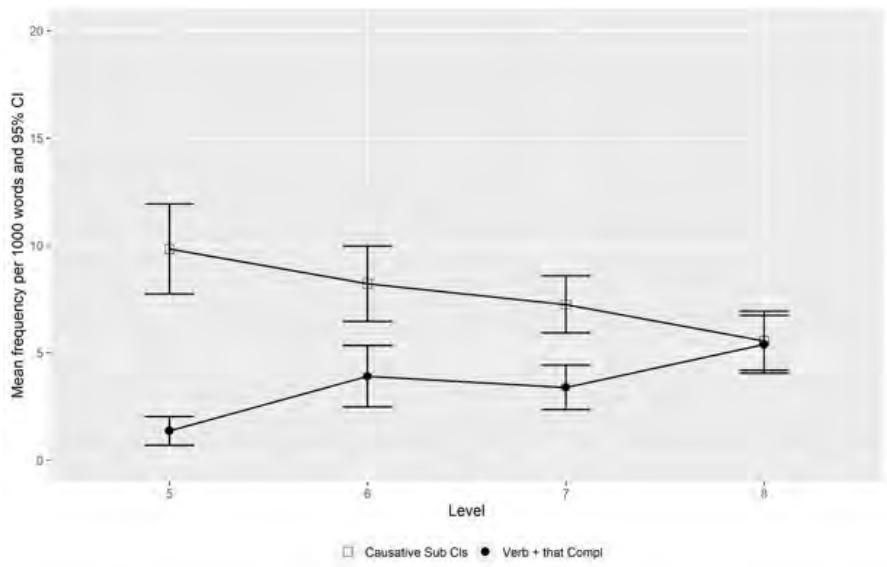
Figure 6: Means and 95% CIs for clausal variables across IELTS level
Figures 7 and 8 show the stance features across score level (note the different scales for frequency of occurrence). As can be seen, second-person pronouns and certainty adverbials increase with score level while first-person pronouns decrease.
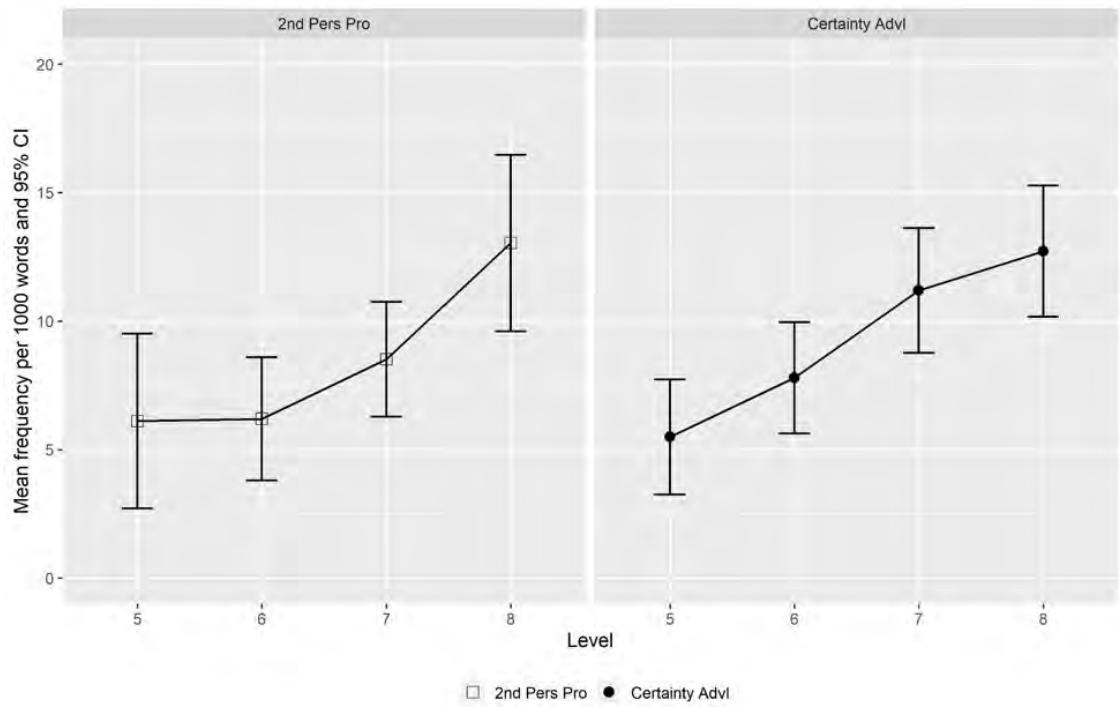
Figure 7: Means and 95% CIs for second-person pronouns and certainty adverbials across IELTS level
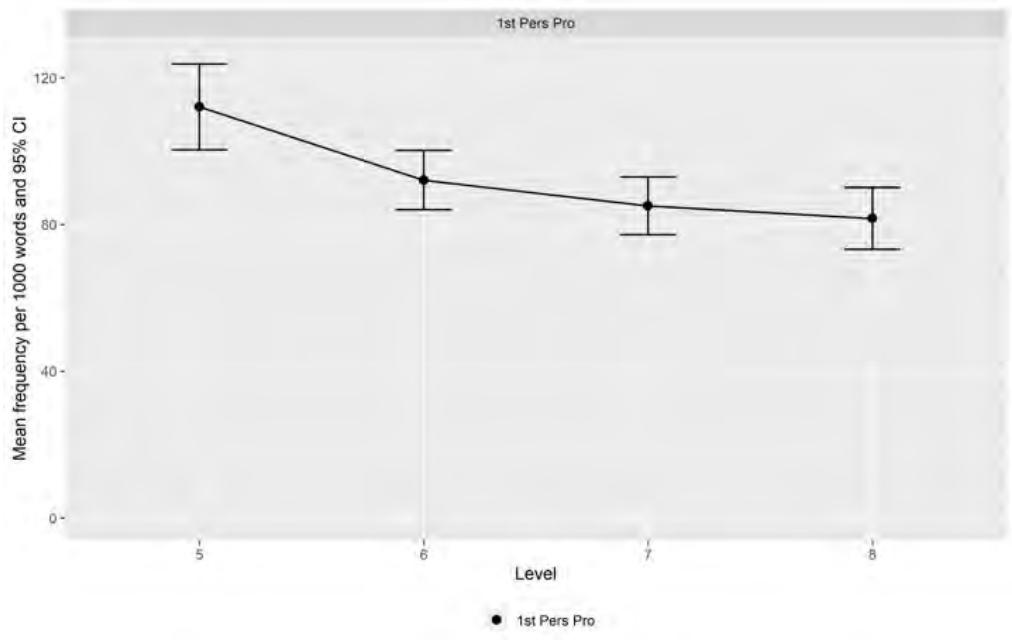
Figure 8: Means and 95% CIs for first-person pronouns across IELTS level
The descriptive findings are bolstered by the correlation results. As can be seen, all of the variables that showed meaningful differences across score levels show meaningful relationships with score level as well. In addition, we can see that relative clauses and attributive adjectives show significant positive relationships with score level and to verb complements show a significant negative relationship with score level.
Table 6: Correlations between score level and register-linguistic variables
| Variable | Pearson’s correlation with score level | P value |
|---|---|---|
| Clausal complexity features | ||
| Subordinate clauses-causative | -0.22 | <.001 |
| That relative clauses | 0.15 | .02 |
| That verb compl clauses | 0.22 | <.001 |
| To verb compl clauses | -0.12 | .04 |
| Phrasal complexity features | ||
| Attributive adjectives | 0.12 | .05 |
| Premodifying nouns | -0.02 | .79 |
| Stance features | ||
| First-person pronouns | -0.27 | <.001 |
| Second-person pronouns | 0.20 | .001 |
| All modal verbs | 0.03 | .59 |
| Stance adverbials-certainty | 0.27 | <.001 |
| Stance adverbials-likelihood | -0.02 | .68 |
| Mental verbs | -0.06 | .35 |
4.3. Acoustic-pronunciation features
As Table 7 shows, there was a steady decrease in both proportion of prominent words and level tone. Proportion of falling tone, conversely, rose as score level rose.
Figure 9 shows the proportions that represent non-overlapping CIs for at least two levels.
Table 7: Descriptive statistics of prosodic features by score level
| Variable | Level 5 (N = 70) M (SD) 95% CIs | Level 6 (N = 71) M (SD) 95% CIs | Level 7 (N = 73) M (SD) 95% CIs | Level 8 (N = 65) M (SD) 95% CIs |
|---|---|---|---|---|
| Space (proportion prominent words to total words) | .39 (.07) | .37 (.08) | .32 (.06) | .31 (.07) |
| Space (proportion prominent words to total words) | .37-.41 | .35-.38 | .30-.33 | .29-.32 |
| Proportion rising tone | .31 (.22) | .35 (.24) | .32 (.21) | .34 (.21) |
| Proportion rising tone | .26-.36 | .29-.40 | .78-.37 | .28-.39 |
| Proportion falling tone | .40 (.21) | .41 (.21) | .47 (.23) | .49 (.21) |
| Proportion falling tone | .35-.45 | .36-.46 | .41-.52 | .44-.54 |
| Proportion level tone | .29 (.19) | .24 (.21) | .21 (.16) | .17 (.14) |
| Proportion level tone | .25-.34 | .19-.29 | .17-.25 | .14-.21 |
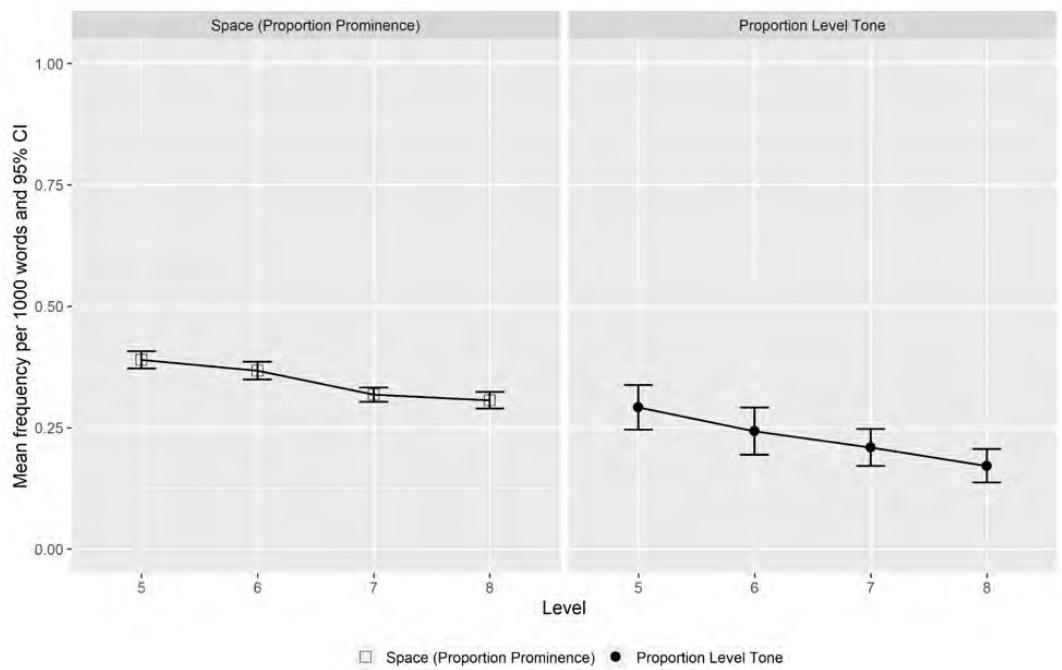
Figure 9: Space and level tone across score levels
The descriptive findings are bolstered by the correlation results. As can be seen, all of the variables that showed meaningful differences across score levels show meaningful relationships with score level as well, with space showing a particularly strong negative relationship with score level.
In addition to prosodic features, we also examined pronunciation errors that are related to high-functional load sounds and divided these errors into three types, namely, vowel, initial consonant, and final consonant errors. As Table 8 shows, we noticed that there is a meaningful trend with proficiency in the vowel errors but not so much for consonants. The correlations also aligned with the descriptives, suggesting that high functional-load vowel errors have a meaningful, negative correlation with proficiency level (r = -.43). Figure 10 presents the means plot for this feature across proficiency levels.
Table 8: Pronunciation errors by score level
| Variable | Level 5 (N = 70) M (SD) 95% CIs | Level 6 (N = 71) M (SD) 95% CIs | Level 7 (N = 73) M (SD) 95% CIs | Level 8 (N = 65) M (SD) 95% CIs |
|---|---|---|---|---|
| High functional-load vowel errors | 1.82 (2.5) | 2.16 (2.32) | 1.01 (1.6) | 0.7 (1.02) |
| High functional-load vowel errors | (1.82, 2.5) | (1.62, 2.7) | (0.65, 1.37) | (0.38, 1.01) |
| High functional-load initial consonant errors | 0.69 (1.99) | 0.66 (1.25) | 0.81 (1.86) | 0.34 (0.8) |
| High functional-load initial consonant errors | (0.69, 1.99) | (0.37, 0.95) | (0.39, 1.23) | (0.1, 0.59) |
| High functional-load final consonant errors | 0.15 (0.43) | 0.39 (1.17) | 0.13 (0.82) | 0.09 (0.25) |
| High functional-load final consonant errors | (0.15, 0.43) | (0.12, 0.67) | (-0.05, 0.32) | (0.01, 0.16) |
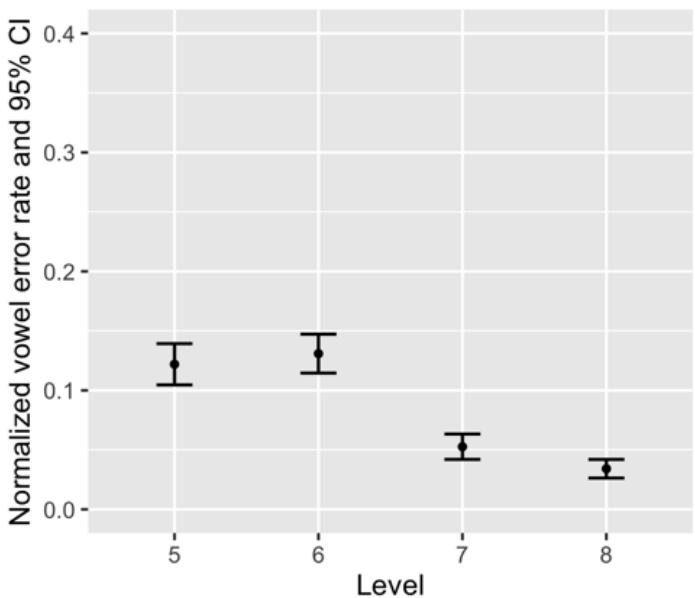
Figure 10: Normalised high functional-load vowel errors across score levels
Table 9: Correlations between score level and prosodic variables
| Variable | Pearson’s correlation with score level | P value |
|---|---|---|
| Space (proportion prominent words to total words) | -0.42 | <.001 |
| Proportion rising tone | 0.03 | .60 |
| Proportion falling tone | 0.17 | .004 |
| Proportion level tone | -0.24 | <.001 |
| High functional-load vowel errors | -0.43 | <.001 |
5. Discussion and conclusions
This study examines a wide range of CAF-based, register-linguistic, and acoustic-pronunciation features on the IELTS speaking test and their relationships with IELTS speaking scores. Findings of this study reveal a set of meaningful correlates with IELTS speaking ability in each of the three categories. As summarised in Table 10, these features correspond to the four scoring criteria for IELTS speaking test.
Under CAF features, whereas speech rate, mean length of run, and mean length of pause are related to fluency and coherence, type-token ratio and morphological errors are related to lexical resource and grammatical range and accuracy.
In terms of register-linguistic features, the meaningful features identified in the IELTS speaking data appear to be associated with the expression of stance and clausal complexity.
As to acoustic-pronunciation features, we also identified both segmental and suprasegmental features that are meaningful correlates with pronunciation.
Taken together, these findings provide supportive evidence for the construct and scoring validity of the IELTS speaking test.
Table 10: Summary of meaningful linguistic correlates of IELTS speaking ability
| Corresponding IELTS criteria | Meaningful features | ||
|---|---|---|---|
| 1 | CAF-based features | Fluency and coherence, Lexical resource, Grammatical range and accuracy | Speech rate, Mean length of run, Mean length of pause, Type-token ratio, Morphological error |
| 2 | Register-linguistic features | Lexical resource, Grammatical range and accuracy | Causative subordinate clause, Verb+that complement clause, First/second person pronouns, Stance adverbials |
| 3 | Acoustic-pronunciation features | Pronunciation | High functional load vowel error, Space, Level tone |
The findings of this study also stand to have meaningful implications for quality control of the IELTS speaking test. The discriminating CAF features can help characterise speech production by test-takers at different proficiency levels; these characteristics can help raters identify test-taker proficiency level more efficiently. Thus, these features can also assist in rater training and calibration, scale development and validation, as well as other quality control procedures related to the scoring process of the IELTS speaking test.
References
- Biber, D. (2006). University language: A corpus-based study of spoken and written registers. John Benjamins.
- Biber, D. (1988). Variation across speech and writing. Cambridge University Press.
- Biber, D., & Conrad, S. (2019). Register, genre and style. Cambridge University Press.
- Biber, D., Gray, B., & Staples, S. (2016). Predicting patterns of grammatical complexity across textual task types and proficiency levels. Applied Linguistics, 37(5), 639-668.
- Biber, D., Gray, B., & Poonpon, K. (2011). Should we use characteristics of conversation to measure grammatical complexity in L2 writing development?. TESOL Quarterly, 45(1), 5-35.
- Biber, D., Gray, B., Staples, S., & Egbert, J. (2022). The register-functional approach to grammatical complexity: Theoretical foundation, descriptive research findings, and applications. New York: Routledge.
- Brazil, D. (1997). The communicative value of intonation in English. Cambridge University Press.
- Brown, A. (2006). An examination of the rating process in the revised IELTS Speaking Test. IELTS Research Reports, 6, 50-84.
- Clark, H. H., & Fox Tree, J. E. (2002). Using uh and um in spontaneous speaking. Cognition, 84, 73-111.
- Corley, M., & Stewart, O. W. (2008). Hesitation disfluencies in spontaneous speech: The meaning of um. Language and Linguistics Compass, 2(4), 589-602.
- Derwing, T. M., Rossiter, M. J., Munro, M. J., & Thomson, R. I. (2004). Second Language Fluency: Judgments on Different Tasks. Language Learning, 54, 655-679.
- Dornyei, Z., & Kormos, J. (1998). Problem-solving mechanisms in L2 communication. Studies in Second Language Acquisition, 20, 349-385.
- Foster, P., Tonkyn, A., & Wigglesworth, G. (2000). Measuring spoken language: A unit for all reasons. Applied Linguistics, 21(3), 354-375.
- Housen, A., & Kuiken, F. (2009). Complexity, accuracy and fluency in second language acquisition. Applied Linguistics, 30(4), 461-473.
- Hymes, D. (1974). Foundations in sociolinguistics: An ethnographic approach. University of Pennsylvania Press.
- Isaacs, T., Trofimovich, P., Yu, G., & Chereau, B.M. (2015). Examining the linguistic aspects of speech that most efficiently discriminate between upper levels of the revised IELTS Pronunciation scale. IELTS Research Reports Online Series. British Council, Cambridge Assessment English and IDP: IELTS Australia.
- Iwashita, N., & Vasquez, C. (2015). An examination of discourse competence at different proficiency levels in IELTS Speaking Part 2. IELTS Research Reports Online Series. British Council, Cambridge Assessment English and IDP: IELTS Australia.
- Jamieson, J., & Poonpon, K. (2013). Developing analytic rating guides for TOEFL iBT integrated speaking tasks. TOEFL iBT Research Report 20. Princeton, NJ: Educational Testing Service.
- Kang, O. (2013). Linguistic analysis of speaking features distinguishing general English exams at CEFR levels. Cambridge English: Research Notes, 52, 40-48.
- Kang, O., & Moran, M. (2014). Functional loads of pronunciation features in non-native speakers’ oral assessment. TESOL Quarterly, 48(1), 176-187.
- https://doi.org/10.1002/tesq.152
- LaFlair, G., Staples, S., & Egbert, J. (2015). Variability in the MELAB speaking task: Investigating linguistic characteristics of test-taker performances in relation to rater severity and score. CaMLA Working Papers.
- O’Sullivan, B., & Weir, C. J. (2011). Test development and validation. In O’Sullivan, B. (Ed.) Language Testing: Theories and Practices (pp. 13-32), Basingstoke: Palgrave Macmillan.
- Read, J., & Nation, P. (2006). An investigation of the lexical dimension of the IELTS speaking test. IELTS Research Reports, Vol 6, 1-24. British Council, Cambridge Assessment English and IDP: IELTS Australia.
- Robinson, P. (2001). Task complexity, task difficulty, and task production: exploring interactions in a componential framework, Applied Linguistics, 22, 27-57.
- Saito, K., Trofimovich, P., & Isaacs, T. (2015). Second language speech production: Investigating linguistic correlates of comprehensibility and accentedness for learners at different ability levels. Applied Psycholinguistics, 37(2), 217-240.
- Seedhouse, P., & Harris, A. (2011). Topic development in the IELTS Speaking Test. IELTS Research Reports, Vol 12, 69-124. British Council, Cambridge Assessment English and IDP: IELTS Australia.
- Skehan, P. (1998). A cognitive approach to language learning. Oxford University Press.
- Staples, S. (2015). The discourse of nurse-patient interactions: Contrasting the communicative styles of U.S. and international nurses. Philadelphia: John Benjamins.
- Staples, S. & Biber, D. (2014). The expression of stance in nurse-patient interactions: An ESP perspective. In M. Gotti & D.S. Giannoni (Eds.), Corpus analysis for descriptive and pedagogical purposes: ESP perspectives (123-142). Peter Lang.
- Thirakunkovit, S., Rodriguez-Fuentes, R., Park, K., & Staples, S. (2019). A corpus-based analysis of grammatical complexity as a measure of international teaching assistants’ oral English proficiency. English for Specific Purposes Journal, 53, 74-89.
- Trofimovich, P. & Isaacs, T. (2012). Disentangling accent from comprehensibility. Bilingualism: Language and Cognition, 15, 905-916.
- Isaacs, T., Trofimovich, P., Yu, G., & Chereau, B. M. (2015). Examining the linguistic aspects of speech that most efficiently discriminate between upper levels of the revised IELTS pronunciation scale. IELTS Research Reports Online Series. British Council, Cambridge Assessment English and IDP: IELTS Australia.
- Weir, C. J. (2005). Language testing and validation: An evidence-based approach. Palgrave Macmillan.
- Yan, X., & Staples, S. (2016). Investigating lexico-grammatical complexity as construct validity evidence for the ECPE writing tasks. CaMLA Working Papers, 2016-01.
Author biodata
Xun Yan
Xun Yan is Associate Professor of Linguistics, Second Language Acquisition and Teacher Education, and Educational Psychology at the University of Illinois at Urbana-Champaign. He is a faculty member in the Beckman Institute for Advanced Science and Technology. His research interests include speaking and writing assessment, psycholinguistic approaches to language testing, and language assessment literacy. His work has been published in applied linguistics journals such as Language Testing, TESOL Quarterly, Assessing Writing, System, and the Journal of Second Language Writing.
Shelley Staples
Shelley Staples is Associate Professor of English and Second Language Acquisition and Teaching at University of Arizona. Her work focuses on corpus-based analyses of spoken and written corpora, for applications to language teaching, language testing, and to understand language development across situations of use (registers). Her publications can be found in Applied Linguistics, TESOL Quarterly, Language Testing, Modern Language Journal, and English for Specific Purposes, along with other applied linguistics journals.