
Investigating Japanese undergraduates' English language proficiency with IELTS: Predicting factors and washback
Official IELTS research report on Impact and Washback - Impact theory and practice; Impact and Washback - Improvement in test scores; Impact and Washback - Performance data of candidates and IELTS; Impact and Washback - Stakeholder attitudes; Impact and Washback - Test preparation; Impact and Washback - Use of test scores, published in 2017.
Abstract
The present study investigated 190 first-year Japanese undergraduates’ performance on the IELTS test and the factors that influenced this performance. Participants took two IELTS tests and completed a survey about their language learning history during pre-tertiary and tertiary education and about their preparation for the IELTS test. Nineteen students also participated in follow-up interviews.
Test results showed that the participants excelled at reading, followed by listening, while they were relatively much weaker in writing and speaking. Mean overall and speaking scores significantly increased, with greater gain occurring at lower proficiency levels.
Regression tree analyses were performed on the score data with 70 variables selected from the survey data as covariates. Key explanatory factors for the first and second test scores and for the subset of participants whose score increased included experience of living and/or studying abroad, motivation to study writing, amount of writing practice, and the type of test preparation (i.e. spoken fluency, test techniques).
Survey and interview data revealed that pre-tertiary education in Japan is highly focused on university entrance exam preparation, leading to a bias towards studying reading and, to a lesser extent, listening and writing, while speaking in English is virtually non-existent in the curriculum. These findings demonstrate a strong washback effect from current university entrance exams and help to explain the imbalance of skills identified using the IELTS test.
Regarding test-takers’ preparation for IELTS, they reported practicing speaking and writing, being motivated to study these skills and, as a result, perceived the greatest improvement in these skills. It is likely that this increase in practice of productive skills led to the actual increase in speaking test performance observed over the period.
Recommendations for using IELTS in the Japanese tertiary context are presented in light of the observed benefits, particularly regarding the potential for positive washback on productive skills.
Author biodata
David Allen
David Allen gained his PhD from the University of Nottingham, UK. He is Associate Professor at the Foreign Language Education Centre at Ochanomizu University, Tokyo, where he teaches applied linguistics and English language courses. David has extensive language teaching experience in the U.K. and Japan, and holds language teaching and examining certifications.
His previous research has focused on Japanese-English bilingual lexical processing, learner corpora, simplified materials, and peer feedback in second language writing. His previous research has been published in journals such as PLOS One, Behaviour Research Methods, The Mental Lexicon, Language Teaching Research, System and Reading in a Foreign Language.
Principal researcher:
David Allen
In-house research team (in alphabetical order):
Sayaka Meguro, Masaaki Ogura, Shoko Tanaka, Kimie Yamamura
1 Introduction
Language proficiency tests are routinely used in the Japanese university context for a variety of purposes. The present study fits within this context as the University of Tokyo (UT) offered funded IELTS (International English Language Testing System) Tests to 300 undergraduates for the purpose of promoting interest in study abroad programs and in English learning, in general. Students were required to take the test twice, once in the first year of study and once in the second year. This opportunity sample allowed for investigation of a variety of questions concerning proficiency levels and proficiency development during the first two years of study at UT.
We were particularly interested in looking at the factors that may influence learners’ initial language proficiency and its development. To understand the participants’ initial proficiency in the four skills, it was necessary to consider a range of factors. Firstly, because participants had recently entered a highly competitive university and, thus, studied intensively for the challenging university English entrance exam, it was likely that this exam influenced learners’ initial proficiency level. That is, a strong washback effect from the university exam was expected. Other factors related to the participants’ learning context, such as study abroad experience and attendance of English-medium schools, were also expected to contribute to the variation in learners’ proficiency. These ‘past learning experiences’ were thus researched to provide a basis for understanding the learners’ proficiency, as well as to provide the background with which to understand any changes in proficiency over the testing period.
Participants’ proficiency, and particularly its development, was also expected to be influenced by ‘current English learning experiences’, such as university education and IELTS test preparation, which occurred during the testing interval. Most importantly, participants’ preparation for the IELTS test, including intensity and strategies employed, was expected to influence development. In other words, washback from the IELTS test on test-takers’ behaviour was expected to lead to positive changes in proficiency. By considering the context and the test-takers’ prior learning experiences (i.e. in preparation for the university entrance exams), it was possible to understand how washback from the IELTS test was generated.
The following research questions were posed to address these aims. In research question 3, learning situations refer to English language study at high school, cram school and university.
2 Research questions
- Research Question 1: Is proficiency equally distributed across the four skills and does this proficiency develop over the period?
- Research Question 2: Which factors related to learning experience and test preparation predict proficiency and its development in the four skills?
- Research Question 3: How does the IELTS test influence learners’ test preparation strategies, their perceived proficiency development and their motivation to study? Similarly, how do the past and present learning situations influence these aspects of language learning?
3 Literature review
3.1 Language proficiency and learning gain
The first research question (RQ1) investigates whether participants have similar proficiencies in each of the four skills, and whether there is any change in these abilities across the period. Following previous research (e.g. Green, 2005; 2007a; 2007b), development in language proficiency is referred to as learning gain, and is calculated as Test 2 Score - Test 1 Score (e.g. 5.5 - 5.0 = 0.5 (half-band) increase; 5.5 - 6.5 = -1.0 (one band) decrease).
There are a number of important considerations regarding learning gain. Firstly, time is required to improve language proficiency and, thus, to see progress through the band scales. For example, in Green (2007b), only one in 10 test-takers improved their score by a band or more on the IELTS Writing component following an IELTS preparation or EAP course of study (course duration 8-9 weeks, 20 hours per week). Thus, following a 160-180 hour course and while living in an English-speaking environment, only a small proportion of students made considerable learning gains on IELTS Writing. Secondly, personal, environmental and test difficulty factors will lead to variation in scores (e.g. half a band in the case of IELTS) on different versions of a test taken during a short period (i.e. regression to the mean: Green, 2005). Scores may increase or decrease by half a band, but this is not necessarily a true reflection of language proficiency change. For example, a third of participants scored lower on the second test in Green (2007b) and the mean learning gain of participants in Green (2005) was -0.4 (an overall decrease in scores). Thirdly, test-takers’ initial proficiency is a strong predictor of learning gain (Elder & O’Loughlin, 2003; Green, 2005: Humphreys et al., 2012). Green (2005) showed that learners’ initial IELTS Writing test scores were a strong predictor of the second test scores, with lower proficiency test-takers gaining more over the period than higher-level test-takers. He concluded that a two-month intensive pre-sessional course is unlikely to lead to increased proficiency scores for learners who achieved a Band 6 any higher on the scale, though it may impact those who gained a Band 5 or lower.
Considering potential learning gain (RQ1) within the present study’s context, participants who take two 90-minute classes per week over a 13-week semester and do two hours of homework for each class will study English for 127 hours per semester, or 254 hours during the full academic year. Given that there will be considerable variation in the courses taken, the amount of homework, as well as participation in extra-curricular activities, amongst other factors, it is not certain that students will make significant gains on the IELTS test over the period of one year. There is likely to be considerable individual variation and there may be greater gain made by those learners who score lower on the initial test (Elder & O’Loughlin, 2003; Green, 2005; Humphreys et al., 2012).
The second question (RQ2) investigates the factors that explain variance in proficiency and learning gain amongst the test-takers in the study. These factors may be specific to the present learning situation (i.e. while at university and preparing for the IELTS test) or past learning experiences, such as study abroad and medium of instruction in schools attended. Previous research (e.g., Green, 2007a; 2007b; Mickan & Motteram, 2009; Xie, 2013; Xie & Andrews, 2012) provided a starting point for determining which factors to include in the investigation.
The purpose of the third question (RQ3) was to create a profile of test-takers’ preparation for the IELTS tests and also their study at university, high school and cram school, in terms of the amount and type of study done, motivation and perceived development. Through analysis of these learning situations, it was possible to assess how much learners’ behaviour and perceptions were shaped by the particular context and/or the test that they were preparing for. Moreover, the impact of these learning experiences upon language proficiency and proficiency development was investigated.
3.2 Washback
Washback is generally defined as the effect of a test upon teaching and learning. It fits under the umbrella of test impact, which is more broadly concerned with the effect of a test on individuals, policies and practices, inside and outside the classroom (Wall, 1996). The scope of washback is, therefore, narrower than that of test impact and deals specifically with the effect that tests have on what (and how) teacher’s teach and what (and how) students learn.
Within the socio-cognitive framework of test validation (O’Sullivan & Weir, 2011; Weir, 2005), washback is an aspect of the consequential validity of a test. In order to make an argument for consequential validity, evidence must be provided about the washback that a test generates. Such evidence supports the use of tests in particular contexts. Moreover, seeking and providing such evidence is in line with an ethical approach to language test development (O’Sullivan & Weir, 2011).
Since Alderson and Wall’s (1993) study, washback has received considerable attention in the language testing literature, though studies have tended to investigate washback on teaching, not learning (Cheng, 2014). This research has shown that teachers’ beliefs and experience are key to understanding whether and how washback occurs in instructed contexts (Watanabe, 1996; 1997; 2004). However, learning is considered to be the most important outcome and learners the central participants in the washback process (Hughes, 2003). Consequently, a growing body of research has emerged that is more directly concerned with washback to the learner and upon learning (e.g. Mickan & Motteram, 2009; Shih, 2007; Xie, 2013; Xie & Andrews, 2012; Zhan & Andrews, 2014). The present study is also primarily concerned with learning and thus seeks to contribute to this literature. Moreover, in non-instructed test preparation contexts, such as that of the present study, the influence of teaching is minimised, allowing for a direct investigation into washback from the test upon learning.
In this study, washback upon learning was investigated primarily in terms of the test preparation strategies that test-takers employed when preparing for the IELTS test. These preparation strategies included the focus on particular activities, skills, and types of knowledge. If the IELTS test stimulates the use of strategies that are beneficial for language learning, it can be argued to generate positive washback in this context, while if it leads to the use of strategies that are detrimental, it could be said to generate negative washback.
In addition, the impact the test has upon students’ motivation to study particular skills was assessed. Taking a language test provides a proximal sub-goal to the primary goal of learning a language and, thus, ‘may have a powerful motivating function in that they mark progress and provide immediate incentive and feedback’ (Dörnyei, 1998: 121). Consequently, taking the IELTS test can raise awareness of ability and provide an incentive to persist in studying language and particular language skills. Of course, this test-derived motivation is part and parcel of a test-taker’s general language learning motivation: if a learner is motivated, a test can serve as an additional boost to that motivation; but if the learner is not motivated, a test is unlikely to influence the learner to the same extent. Therefore, the effect of tests upon motivation to study must always be understood within the context of the study and the individuals taking part.
It is also crucial in washback research to consider the perceived importance and difficulty of the test. These two factors dictate the degree of washback on learning, or washback intensity (Cheng, 1997). If the test is not perceived as important, or high stakes, then it will not be prepared for intensely and washback will be minimal. Also, if the test is not perceived to be difficult, test-takers will not prepare for it intensely, again limiting washback. When a test is perceived to be important, while also being challenging but achievable, the optimum degree of washback is expected (Green, 2005). Furthermore, a variety of participant factors (Hughes, 2003) such as test-takers’ knowledge and understanding of the test demands, their resources to meet these demands and their acceptance of them, are all crucial for determining the effect that a test can have upon learning (Green, 2005). In other words, how well the test-takers understand the tasks and how to prepare for them, and whether they have the ability and are willing to prepare for them, can all influence the washback process. Such participant factors are arguably most suitably investigated through interviews with test-takers.
Finally, the context in which tests are introduced plays a significant role in determining the washback process (e.g. Gosa, 2004; Shih, 2007). The present study context is a prestigious university in Japan, which entailed a number of considerations in order to evaluate the washback from the IELTS test. Most importantly, entrance to the university requires applicants to first pass the National Center for University Entrance Examinations (NCUEE) exam with a top score (somewhere between 80-100%) in order to qualify for the highly competitive UT entrance exam. Applicants must, therefore, devote much of their time, especially at high school, to serious study and preparation for these exams. Given the extremely high-stakes nature of the UT exam, a strong washback effect is expected upon test-takers’ knowledge of English, their ability to use English in the four skills and their knowledge of how to study English (i.e. learning strategies and test preparation strategies). It would have been inappropriate to simply assume that this washback effect exists; therefore, it was crucial to investigate learners’ previous language learning experiences, especially regarding the entrance exams. Only by doing so was it possible to understand how the IELTS test generates washback in this context.
3.3 Overview of the exams
To formulate more detailed predictions about the potential washback on learning, a brief overview of the two entrance exams is presented, followed by a comparison with the IELTS test.
The NCUEE is a syllabus-based test based on the national course of study (e.g. MEXT, 2011). The exam focuses on vocabulary, grammar, pronunciation and receptive skills; there are no writing or speaking tasks.
The reading and listening tests are separate. All responses are multiple-choice. The reading test begins with pronunciation questions (e.g. odd-one-out for stress placement), which are intended to be indirect tests of speaking ability, followed by multiple-choice sentence completion for single items (i.e. vocabulary knowledge) and sentences (i.e. phrasal vocabulary and discourse comprehension). Dialogues are primarily used in the first half of the test, emphasising a communicative focus. Longer texts feature in the second half of the exam, and include film reviews, quasi-academic/news texts and advertisements. The listening test primarily contains numerous short dialogues between two people, most of which are three to four turns in length, followed by two longer monologues. Overall, the topics are general and the focus is comprehension of ‘everyday English’ in written and dialogic form, emphasising a ‘practical’ focus (Henrichsen, 1989, cited in Watanabe, 2004).
The 2013 UT exam (which participants in this study had taken) included reading and grammar, listening, and writing sections. Estimated weightings were 60% for reading/grammar, 25% for listening, and 15% for writing. The reading section included a variety of tasks that tested general reading comprehension and grammatical knowledge, including summarising a 500-word English text in Japanese (70-80 characters), gap-filling exercises (complete a text with omitted sentence parts/clauses), ordering words within a text (five jumbled words within a sentence in the text), translation from English to Japanese (sentence/clause level), multiple-choice/selection of single words (grammatical knowledge, e.g. articles/demonstrative pronouns) or sentences (comprehension, choosing a sentence with the closest meaning to that in the text). Reading comprehension was tested mainly by translation, followed by multiple-choice items. Purely grammatical questions made up the smallest proportion of items in the reading section. Texts were generally academic in nature. The listening comprehension section included three texts across three sections. Items included multiple-choice and sentence completion. The writing section consisted of two items (a free response and a guided response item): writing a 50-60 word answer in response to a prompt (What is the most important thing you have learned and why?) and writing a short 60-70 word dialogue in response to a picture-prompt (In the picture, what are the two people talking about?). This latter task presumably aims to be, at least partially, an indirect test of speaking ability. Reading and listening are objectively scored and writing is rated using a holistic scoring method. The reading and listening sections particularly reflect a ‘cultural’ focus of English study, i.e. that English ability is required to gain access to higher, cultural knowledge (Henrichsen, 1989, cited in Watanabe, 2004).
Comparing the NCUEE, UT and IELTS tests, a number of key differences are apparent. Firstly, while all tests are high-stakes, their purpose differs: the NCUEE assesses learning of the high-school English curriculum; the UT test is a tool for candidate selection based on test performance; and IELTS is used to ensure only applicants with sufficient academic English proficiency can enter English-medium universities. Secondly, there is a difference in the construct being assessed. For proficiency exams, such as IELTS, a theoretical model of communicative language ability is defined and skills and sub-skills from this model are assessed (e.g. Bachman & Palmer, 1996; Weir, 2005). The NCUEE exam is based on the syllabus taught in high schools, and thus utilises a syllabus-based construct. The UT exam aims to test higher-level abilities than those tested in the NCUEE exam but no documentation is publicly available that reports either the test specifications or the theoretical model of language ability. Thus, to determine the construct, one must reverse engineer it from the test itself, which will naturally lead to different interpretations. Ultimately, the UT test construct remains ambiguous. Thirdly, the skills tested and their weightings differ markedly (Table 1). While there is some overlap in terms of receptive skills and their formats, there is little such overlap in the productive skills. In terms of the potential washback on language abilities, this is perhaps the most important difference between the tests.
Table 1: Comparison of NCUEE, UT entrance exam and IELTS proficiency test
| NCUEE | UT Entrance Exam | IELTS (Academic) | |
|---|---|---|---|
| Weighting of skills tested directly | Reading > listening | Reading > listening > writing | Reading = listening = writing = speaking |
| Answer formats for reading and listening | Multiple choice | Multiple choice, short answer, English-to-Japanese translation | Multiple choice, short answer, information transfer |
| Writing task format | N/A | Write a short paragraph on familiar, personal topic (50-60 words): write a 4-turn conversation (50-60 words) | Describe data and trends in tables and graphs (150 words): short academic essay (250 words) |
| Speaking test format | N/A | N/A | One-to-one, face-to-face interactive, (semi-) structured interview |
3.4 Predicted washback on learning
Washback effects were investigated by considering the types of learning and teaching experienced during high school and cram school (preparation for NCUEE and UT exams), and during preparation for the IELTS tests. Based on the above analysis, it was possible to make some predictions regarding potential washback effects.
Washback was expected in terms of the focus on receptive and productive skills. At high school (16-18 years), a greater focus on reading and listening skills, and also vocabulary, grammar and, to a lesser extent, pronunciation was expected, in order to prepare for the NCUEE examination. At cram school (Juku or Yobiko), a focus on reading, and, to a lesser extent, listening and writing, was expected in preparation mainly for the challenging UT entrance examinations. Very little focus was expected on speaking during preparation for either the NCUEE or UT test, as this skill does not feature in the tests at all. Test-taking techniques, especially at cram school, and a bias towards grammar and vocabulary, and away from pronunciation and spoken fluency, were also expected. Regarding classroom interaction patterns, how traditional or innovative they are depends greatly on the teacher’s beliefs and training (Watanabe, 1996) but also may also be influenced by the test tasks. In terms of perceived development and motivation to study, these were expected to be in line with the requirements of the high-stakes test. For instance, as reading is the primary skill tested on the UT test, it was assumed that learners would be most motivated to study reading and they would perceive the greatest development in this skill.
Washback from the IELTS test was expected to entail a greater focus on speaking, particularly spoken fluency and interactive speaking skills, and writing, particularly describing graphs and other visually presented data and writing argumentative essays. Test-takers were expected to study test-taking techniques, e.g. familiarising themselves with the question and answer formats featured in the tests, and study aspects of grammar, vocabulary and pronunciation. Preparation for the IELTS tests was undertaken in a non-instructed context and, thus, comparison of teaching environments in other situations was not possible. In terms of perceived proficiency development and motivation, it was expected that test-takers would be motivated to study productive skills and, if they did so, would perceive the most improvement in those skills.
3.5 Summary of research design
To address RQ1, scores from the first and second IELTS tests and learning gain across the period were summarised and compared. To address RQ2, the test data were analysed with covariate factors derived from the survey data to investigate which variables predicted test scores and learning gain. To address RQ3, survey and interview data regarding the preparation done for the IELTS tests and within the three learning environments (high school, cram school, and university) were analysed.
4 Methods and procedure
4.1 Participants
Three hundred first-year undergraduates were recruited on a first-come, first-served basis. Of those, 255 took the first IELTS examinations and 45 failed to attend (85% completion rate). Of the 255 students, 204 also took the second test (80% completion rate).
4.2 Test preparation
The British Council provided two half-day test-preparation sessions before the first exam. The purpose of these sessions was to introduce the IELTS test, especially the speaking and writing components because these sections differ more markedly from other tests that participants may have been familiar with. A total of 64 students attended the session before the first test and 21 attended the session before the second test. The British Council also provided limited-duration, free access to their IELTS preparation website (http://www.britishcouncil.jp/exam/ielts/resources/free-practice) to which 173 students signed up prior to the first test, and 23 students signed up prior to the second test.
4.3 Test administration
The first test was administered at four Eiken testing centre locations: Tokyo (n=73), Yokohama (n=17), UT (n=160), Eiken head office (n=3). Participants took the test on one of 17 different dates during the period from September 2013 to February 2014.
The second test was administered over six full-day sessions at UT (all components administered on the same day) between September and December 2014.
4.4 Survey design
The purpose of the survey was to provide quantitative measures that could be used to predict test performance and proficiency development (RQ2), and to provide data that could be used to assess how previous education, current language education and IELTS test-preparation impacted study habits, learner motivation and perceived proficiency (RQ3).
The survey was designed by reference to previous surveys and commentaries as found in Brown (2001) and Dörnyei and Taguchi (2009), and administered using www.surveymonkey.com. Likert scale responses were used wherever possible to facilitate comparison of responses across sections.
The survey items were created though discussion between the members of the research team and external reviewers and were then translated into Japanese and verified. Two focus groups were arranged with two to four student in each, who were paid 1000 yen (5 GBP) for volunteering. Sessions were conducted in Japanese and used a reduced version of the survey. They were video-recorded and an analysis of the comments led to further refinement of the survey design and content, leading to a final version. The final survey included 122 items, which took around 25 minutes to complete.
Table 2 shows the information collected from the surveys. Appendix 1 lists the questions (in English) used in the surveys.
Table 2: Content of the survey
Participant variables
| Variable group | Variables |
|---|---|
| Personal information | Age Gender |
| Language history | Languages known and used |
| English language learning history | Age began learning Experience of living and schooling abroad Study abroad experience Extra-curricular English activities English test-taking experience Expectations to study abroad |
| IELTS preparation and results (All items repeated for Test 1 and Test 2) *Items that are comparable to those in the following section | Amount of preparation (hours) Motivation for taking IELTS Spoken fluency focus* Form (grammar, vocabulary, pronunciation) focus* Skills focus* Activities focus* Test-taking techniques focus* BC website use, preparation sessions, and additional tuition Motivation* Perceived proficiency development* |
| English study experience at - High school - Cram school - University | English courses taken Classroom organisation Teacher/student-centred instruction Main language used by teacher / students Amount / focus of homework Spoken fluency focus Form focus Skills focus Activities focus Test-taking techniques focus Satisfaction Motivation Perceived proficiency development Additional information |
Participants completed the survey online within a week following the second test. An incentive of a 500 yen (2.50 GBP) gift card was provided by EIKEN and these were mailed to participants upon completion of the survey. Of the 204 students who completed both IELTS tests, 190 completed the survey (93% completion rate).
All ethical procedures adhered to the general guidelines in line with those of UK higher education institutions. All participants were required to complete informed consent forms for surveys, focus groups and interviews.
4.5 Interviews
The purpose of the interviews was to complement the survey data and capture more detailed information about individual perceptions, circumstances and learning experiences (RQ3). The Interviews focused on three topic areas listed below.
- Perceptions of language learning behaviour in preparation for the IELTS test and in high school, cram school and university.
- Perceptions of motivation for learning English and the relationship between this and study behaviour.
- Perceptions of own proficiency development and the factors that influenced this (see Appendix 2).
The interviews were semi-structured and the question prompts were developed by the principal researcher and interviewers, working first in English and then translating prompts into Japanese.
The interviewers were recruited from the English department of UT and were postgraduates currently engaged in language research. They were fully trained through readings, workshops, practice interviews and feedback sessions. Interviewees were recruited via the survey.
The sessions took place on campus in a quiet, comfortable location, and were conducted in Japanese. Interviewers had access to interviewees’ survey responses and these were referred to at times during the interviews. Participants appeared comfortable talking to the interviewers in an informal and relaxed manner.
Following the interviews, the interviewers transcribed the discourse with minimal annotation for hesitation (long pauses), surprise, emphasis, and emotion, where appropriate. The transcripts were entered into a spreadsheet grid and organised according to the focus of the questions. Transcripts were read and re-read iteratively by the principal researcher and salient themes both within and across interview data were identified. First, the individual interviews were read and notes were taken on the defining characteristics of each interviewee’s discourse (e.g. particular focus of discussion, repeated and emphasised thoughts and feelings regarding language education, tests). Secondly, recurring themes and summary notes were made for the whole set of interviews. Following this, the responses to particular questions were re-read to identify recurring themes and information, and to identify similarities and differences across participants. English translations were all checked for accuracy.
5 Results
5.1 IELTS tests scores (RQ1)
Although 255 participants took the first IELTS test, only 204 of these also took the second test. In line with the aims of the present study, only the data of these 204 participants is presented here (though it should be noted there is little difference between the Test 1 data with 255 and 204 participants).
5.1.1 Test 1 and Test 2 scores
The score distributions for Test 1 and Test 2 are shown in Figures 1 and 2, respectively. Based on the figures and the skewness and kurtosis values presented in Table 3, it was determined that the data appear to be sufficiently normally distributed.
Figure 1: Initial IELTS band scores for four skills
IELTS test band scores for four skills: Test 1
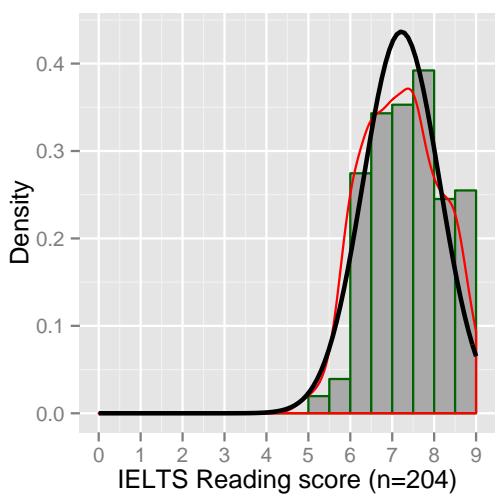
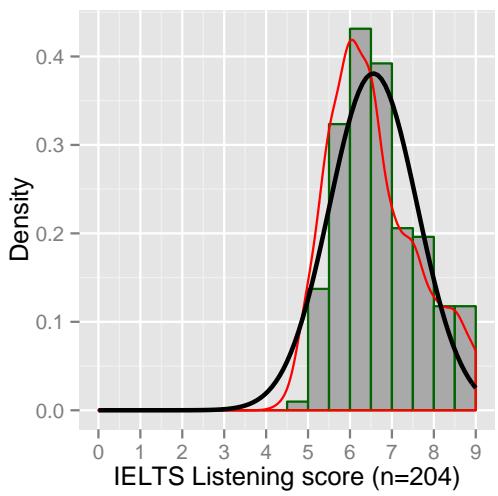
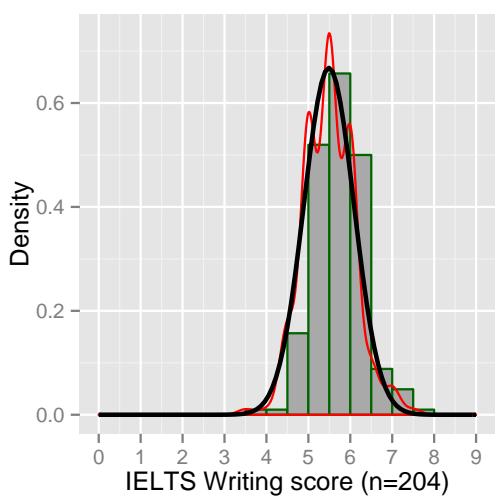
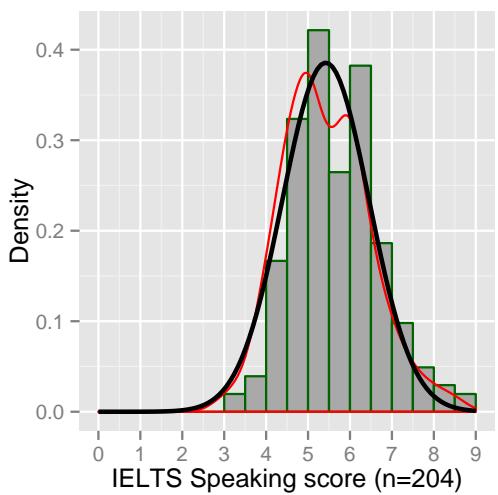
Figure 2: IELTS band scores for four skills on Test 2
IELTS test band scores for four skills: Test 2
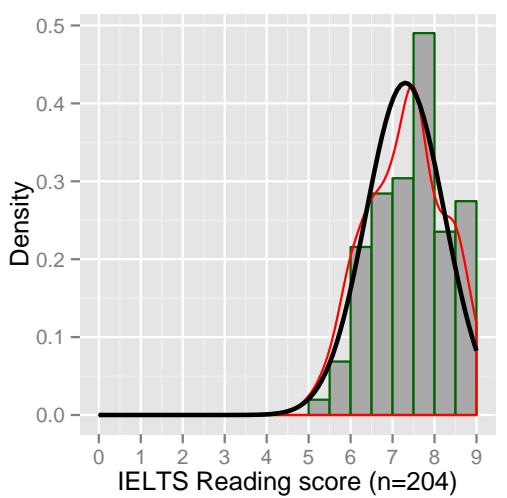
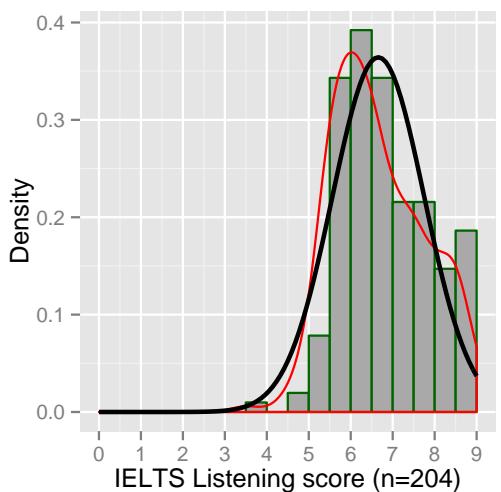
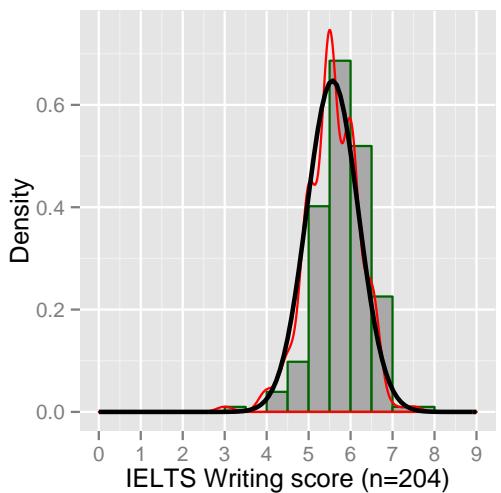
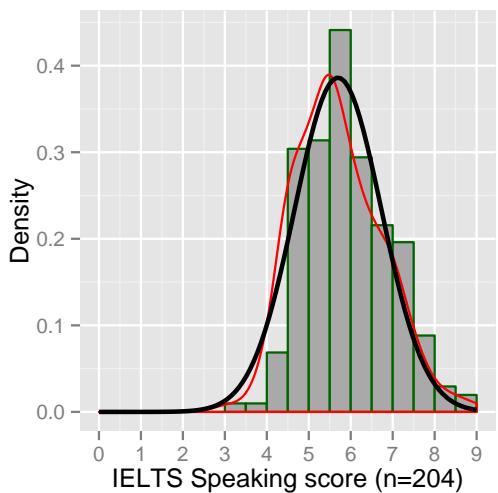
Table 3: Descriptive data for Test 1 and Test 2 scores
| Mean | Standard Deviation | Min. | Max | Skewness | Kurtosis | |
|---|---|---|---|---|---|---|
| Test 1 (n=204) | ||||||
| Overall | 6.2 | 0.8 | 4.5 | 8.5 | 0.34 | -0.33 |
| Reading | 7.2 | 0.9 | 5.0 | 9.0 | 0.04 | -0.79 |
| Listening | 6.6 | 1.1 | 4.5 | 9.0 | 0.58 | -0.42 |
| Writing | 5.5 | 0.6 | 3.5 | 7.5 | 0.19 | 0.62 |
| Speaking | 5.4 | 1.0 | 3.0 | 8.5 | 0.40 | 0.06 |
| Test 2 (n=204) | ||||||
| Overall | 6.4 | 0.8 | 4.5 | 8.0 | 0.20 | -0.63 |
| Reading | 7.3 | 0.9 | 5.0 | 9.0 | -0.12 | -0.69 |
| Listening | 6.7 | 1.1 | 3.5 | 9.0 | 0.30 | -0.60 |
| Writing | 5.6 | 0.6 | 3.0 | 7.5 | -0.40 | 1.20 |
| Speaking | 5.7 | 1.0 | 3.0 | 9.0 | 0.43 | -0.01 |
As the actual results show, there is a large discrepancy between productive and receptive skills of the present sample. Participants scored, on average, highest on reading (Test 1 = 7.2 / Test 2 = 7.3), followed by listening (6.6/6.7), while writing (5.5/5.6) and speaking (5.4/5.7) scores were considerably lower. Thus, there is a considerable difference evident in the receptive versus productive language abilities of the present population sample.
One may ask whether there is typically a difference in the scores for receptive and productive skills amongst IELTS test-takers in general. Considering the average scores on IELTS tests taken worldwide in 2012 (Table 4), scores for reading, listening and speaking were similar (between 5.9 and 6.0), while writing was lower at 5.5. Thus, the average scores for the different skills vary more strikingly for the present sample compared to the world averages. The higher than average scores for reading and listening and the lower score for speaking all indicate a marked bias towards receptive abilities.
Compared to the average IELTS scores of Japanese first language test-takers (Table 4), the participants scored 0.4/0.6 bands higher overall, and scored higher on all skills, except for speaking (5.4/5.7 vs. 5.6), which was roughly equivalent. The most striking difference, however, lies in the reading and listening scores (7.2/7.3 vs. 6.0 and 6.6/6.7 vs. 5.9, respectively), with the biggest difference between reading ability (1.2/1.3 bands). There was less difference in performance on the writing component (5.5/5.6 vs. 5.3) and no overall difference for speaking. Thus, compared to the national averages the present sample is notably strong in receptive skills, especially reading, while they are slightly better at writing, but no better at speaking.
Table 4: IELTS mean test results for participants who took both tests (Test 1 and Test 2)
| Test 1 mean band score (n=204) | Test 2 mean band score (n=204) | Paired samples t-tests (df =203) | IELTS 2012 Average* | IELTS 2012 Japanese L1 Average* | |
|---|---|---|---|---|---|
| Overall | 6.2 | 6.4 | t = -4.2, p < .001, D=0.29 | 5.9 | 5.8 |
| Reading | 7.2 | 7.3 | t = -1.5, p = 0.131, D=0.11 | 6.0 | 5.9 |
| Listening | 6.6 | 6.7 | t = -1.9, p = 0.056, D=0.13 | 6.0 | 6.0 |
| Writing | 5.5 | 5.6 | t = -1.9, p = 0.053, D=0.14 | 5.5 | 5.3 |
| Speaking | 5.4 | 5.7 | t = -4.9, p < .001, D=0.34 | 5.9 | 5.6 |
*Average of female and male candidates data taken from: http://www.ielts.org/researchers/analysis-of-test-data/test-taker-performance-2012.aspx
5.1.2 Learning gain
The proportion of overall band scores that increased (by half a band or more) over the period was 34%, that of those which did not change was 51%, and that of those which decreased was 15%. Comparing the mean scores from Test 1 and Test 2 (Table 4), they all increased slightly, with the greatest increase in the overall and speaking scores (0.2 and 0.3 bands, respectively). Paired samples t-tests were used to compare differences in test scores for the repeated tests (Table 4). The differences across tests for the overall and speaking scores were highly significant (p<.001), while other differences were not statistically significant (p>.05). However, both listening and writing score differences were close to significance (p=0.06). According to the benchmarks for Cohen’s D effect sizes, where small = 0.2 and medium = 0.5, the differences for overall and speaking scores both fall between the range of small and medium effect size.
We investigated whether learning gain was greater for participants with lower initial proficiency. As shown in Table 5, test-takers whose initial proficiency was either 4.5 or 5.0 gained the most overall. Conversely, learning gain was smaller for high proficiency test-takers (i.e. 7.5-8.5).
Table 5: Learning gain for test-takers at different initial band scores (gain=T2 - T1)
| Overall proficiency band (Test 1) / Learning Gain | 4.5(n=2) | 5.0(n=10) | 5.5(n=43) | 6.0(n=45) | 6.5(n=42) | 7.0(n=28) | 7.5(n=14) | 8.0(n=5) | 8.5(n=1) | Mean(n=190) |
|---|---|---|---|---|---|---|---|---|---|---|
| Overall Gain | 0.25 | 0.55 | 0.20 | 0.10 | 0.11 | 0.11 | -0.04 | -0.20 | -0.50 | 0.13 |
| Reading Gain | 0.00 | 0.40 | 0.24 | 0.1 | 0.04 | -0.02 | -0.14 | 0.10 | -1.0 | 0.09 |
| Listening Gain | 0.25 | 0.25 | 0.06 | 0.11 | 0.23 | 0.18 | 0.04 | -0.05 | -0.05 | 0.12 |
| Writing Gain | -0.75 | 0.45 | 0.16 | -0.01 | 0.06 | 0.04 | 0.18 | -0.4 | -0.5 | 0.07 |
| Speaking Gain | 1.00 | 0.60 | 0.31 | 0.33 | 0.25 | 0.25 | 0.00 | -0.40 | 0.50 | 0.28 |
Note: The highest two mean scores for each row are shown in bold; the lowest two scores are shown in italics.
5.2 Test score and survey data (RQ2)
5.2.1 Response and predictor variables
The purpose of the analysis was to investigate which factors predicted higher/lower IELTS scores. Data from the 190 participants were used in the analyses. Response (dependent) measures included the scores (overall, reading, listening, writing and speaking) for the first and second tests, giving a total of 10 individual measures. In addition, a learning gain analysis was performed to see which factors predicted improved scores. To do this, test scores (overall, reading, listening, writing and speaking) of the subset of participants whose scores improved over the duration were used as dependent measures. It was not possible to use learning gain as a dependent measure because gain was almost exclusively restricted to either 0.5 or 1.0 bands. In other words, positive learning gain was not varied enough to enable investigation of factors that predict the amount of gain.
Seventy predictor variables comprising of categorical, ordinal, and continuous data were selected from the survey data and are indicated in Appendix 1. Variables were selected from the following sections: English language learning history (e.g. study abroad experience), IELTS preparation and results, and English study at university. Other items were omitted for technical reasons and high school and cram school data were omitted because the responses were very similar across participants. For Test 1, all predictors except for ‘motivation to study reading/listening/writing/speaking following Test 1’ were included (i.e. 66 variables), while Test 2 included these as well (i.e. 70 variables).
Due to logistics of administering the tests, dates and locations varied for participants and for both the first and second tests, and so it was necessary to control for these factors statistically. Three control variables (test location, date, duration between tests) were included in Test 1 analyses, though ‘duration’ was only included for Test 2 analyses.
Green (2005) showed that the scores on an initial IELTS test were strong predictors of scores on a subsequent test taken reasonably soon thereafter (his study had a two-month gap). Preliminary analyses showed that this was indeed true for the present data set, however, as previous test scores are highly correlated with new test scores and because this essentially does not reveal anything interesting about the present sample’s language history or test preparation, initial test score was excluded from the following analyses.
5.2.2 Overview of analyses
To investigate which factors predicted the IELTS test scores, it was necessary to select an appropriate statistical procedure that can reduce the large number of predictor variables/ covariates down to those that are most explanatory. Green (2007) notes that researchers exploring the factors influencing learning gain have used a variety of techniques, such as structural equation modelling, cluster analysis and neural networks (p. 80). All of these methods can deal with large numbers of variables that are used to predict test scores and/or learning gain. In the present study, however, a novel approach was adopted in which a series of regression tree analyses, specifically referred to as conditional inference trees (Hothorn et al., 2006) were performed.
Conditional inference trees are calculated using an algorithm that recursively partitions the observations using univariate (two-way) splits for covariates. They utilise permutation tests developed by Strasser and Weber (1999). First, the algorithm estimates a regression relationship for the response and each covariate and selects the covariate that is most explanatory, indicated by the lowest Bonferroni-corrected p-value. This statistical approach to variable selection means that conditional inference trees are ‘unbiased’ as they do not preference selection of covariates based on the type of data (e.g. continuous, nominal or binary) or whether they have missing values. Next, the optimal split point in the observations is estimated, which divides them into two groups. A significance criterion is generated from a two-sample non-parametric permutation test, to ascertain whether the groups resulting from the split represent different populations. This procedure avoids the problem of over-fitting the model to the data. If the test is significant, the split is made and a constant regression model is fitted in each cell of the resulting partition. If the test is not significant, the covariate is excluded. This recursive selection and partitioning procedure continues for all covariates, and for each new leaf (or ‘node’) in the regression tree. To illustrate with an example, using a dependent measure ‘overall test score’ (Bands 0-9) and the variable ‘motivation to study’ (on a Likert 1-6 scale), the algorithm first determines whether the covariate is significantly associated (to our criterion of Bonferroni-corrected p-value) with the response, and let’s say it is. Next, the algorithm estimates the optimal split point at which two different groups can be formed (e.g. motivation to study ≤2 and >2) and for which the observations form two distinct proficiency groups (e.g. ≤5.5, >5.5). If the permutation test for the resulting partitioned groups is significant , the split is made. The algorithm then repeats this process for the next covariate using both groups/leaves of the tree that resulted from the previous split. In other words, the process proceeds independently from each new leaf in the tree, until all covariates have been assessed.
Regression trees are relatively simple tools that combine variable reduction and regression model fitting procedures, while providing intuitive visualisation of the structural relationships between the predictors and the observations (see Hothorn & Everitt, 2014). The recursive two-way splitting procedure is, however, a somewhat blunt method of dealing with the potential complexity of the inter-relationships between variables and the observations, especially when dealing with continuous covariates. Moreover, different algorithms may represent the structure of the regression relationship in different ways through the criteria employed (Hothorn et al, 2006: 18). It is accepted, as with comparisons of other statistical procedures, that the final representations are not the only way of viewing the structure of the data. Nevertheless, for the purposes of the present report, the method’s primary advantage, visualising an estimated regression relationship in an intuitive way, makes it a suitable choice.
Analyses were conducted using R open source software version 3.0.2 (R Development Core Team, 2013). The function ctree was used for calculating and plotting the conditional inference trees in the package ‘party’ (Hothorn et al, 2015; see also Hothorn et al, 2006).
Reading the tree diagrams is straightforward: significant predictor variables are represented in ovals (see Figures 3 to 10), alongside the significance value from the permutation test resulting in the univariate split. Each branch of the tree shows the level of the factor that has been split: for a categorical variable this may be ‘yes’ or ‘no’, and for a continuous/ordinal variable (e.g. Likert scale) the split will indicate the ‘less than or equal to’ point and the ‘greater than’ point. The number of participants in each Node is shown above the box and whisker plots (n). The box and whisker plots for each group/node provide the following information: the y (vertical) axis shows the band score, the median score is illustrated by the thick black line in the box, the box itself represents the upper and lower quartiles, and the whiskers show the minimum and maximum scores.
5.2.3 Regression tree analyses
5.2.3.1 Overall scores
Figures 3 and 4 show regression trees for the overall scores for Test 1 and Test 2.
Figure 3 shows that experience living in an English-speaking country is an important factor determining highest overall proficiency, followed by experience studying abroad.
Ten test-takers who had not lived or studied abroad but reported studying test techniques extensively for the first test (>4) also gained high scores. The remaining participants who had not lived or studied abroad, or studied test techniques much before the first test, were subsequently divided by general motivation to study writing while at university, with those rating their motivation between 4-6 on the Likert scale being significantly higher scorers.
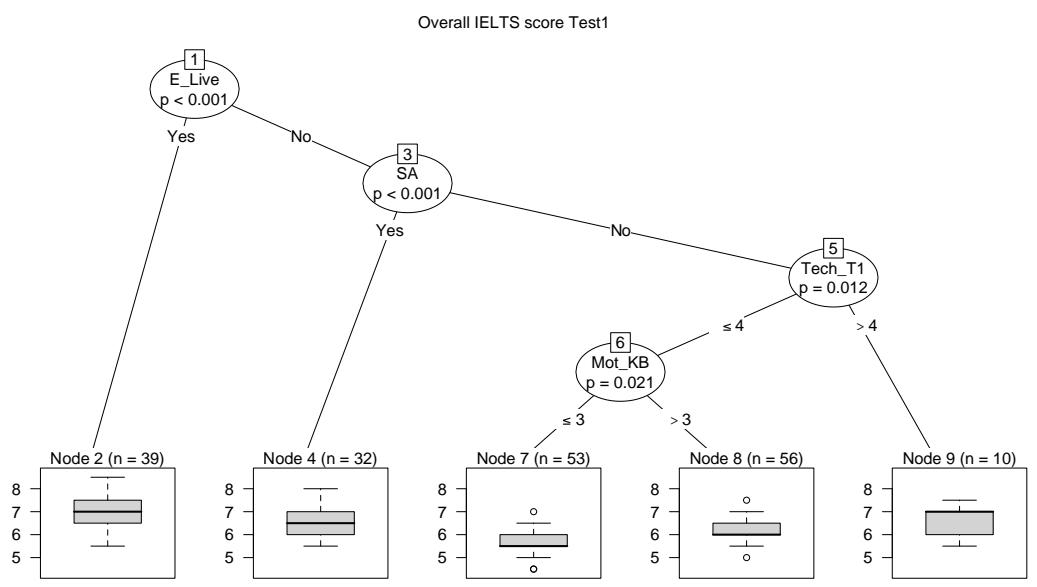
Figure 3: Regression tree for overall scores on Test 1
Figure 4 shows that living abroad is the primary variable distinguishing the highest overall scorers on the second test. Of those high scorers, whether or not they used the website further distinguishes them into two groups. Those who did not use the website (n=22) scored the highest. This finding indicates that those who opted to use the website were lower in English proficiency. Another factor was ‘motivation to study writing after Test 1’, where those who had very high motivation (i.e. they rated ‘6’ on the 6-point scale) scored higher (n=21). Thus, being highly motivated to improve writing was related to higher overall scores.
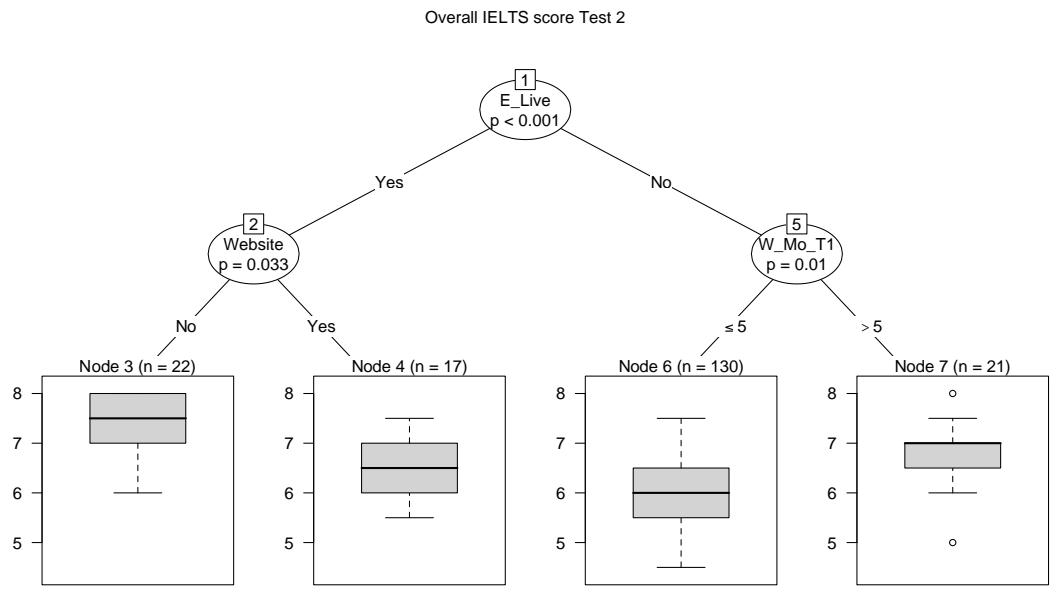
Figure 4: Regression tree for overall scores on Test 2
Only one variable, ‘motivation to study writing after Test 1’, significantly explained the variance in the group of test-takers who increased their overall scores across tests, such that those with higher motivation (>3, n=35) scored higher (median band score=6.5). Thus, writing motivation appeared to be an important factor predicting overall IELTS score increases.
5.2.3.2 Reading scores
Living abroad significantly predicted higher reading scores (n=39, median band score=8) on Test 1, while no other variables were significant in explaining variance in the reading scores. The result was almost identical for Test 2 (statistic: 17.661, p=0.002) with partitioned groups being identical. There were no significant predictors for the subset of participants who increased their score (n=45). The lack of explanatory variables for reading scores suggests a ceiling effect, where variables are less predictive due to the mean scores being uniformly very high. The test-takers were all highly skilled at reading and doing reading tests, as the test scores suggested, and thus there is less variation to separate out with the predictor variables.
5.2.3.3 Listening scores
Figures 5 and 6 show regression trees for the listening scores for Test 1 and Test 2. Figure 5 shows that living and studying abroad are key factors explaining variance in the listening scores on the first test. Figure 6 shows that the amount of spoken fluency practice that test-takers did prior to Test 2 was also a significant predictor (p<.01), such that those who practiced fluency more, got higher scores in the listening test. This finding may reflect the fact that practicing fluency, which was defined as ‘responding spontaneously to question prompts during speaking practice’ can also involve listening to an interlocutor, or perhaps speaking aloud, required test-takers to concentrate on their own output, i.e. monitoring their own speech, which concurrently led to increased listening ability. This is an interesting finding, pointing to the overlap across skills. For the group of test-takers whose listening scores increased, only living abroad distinguished amongst the scores: a small group who had lived abroad (n=16) outperformed those who had not.
IELTS Listening score Test 1
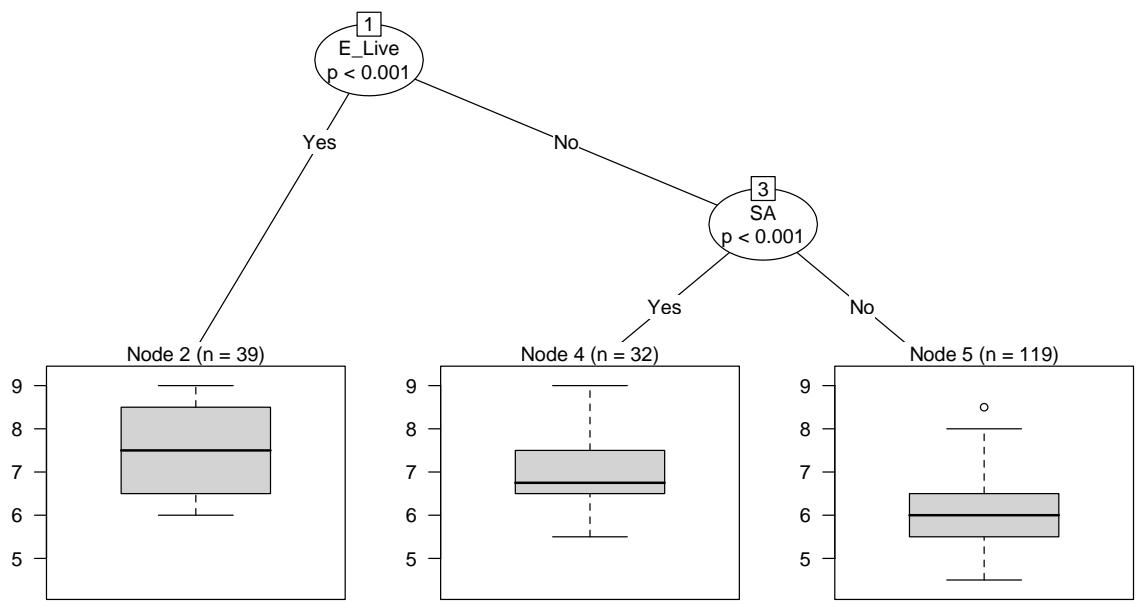
Figure 5: Regression tree for listening scores on Test 1
IELTS Listening score Test 2
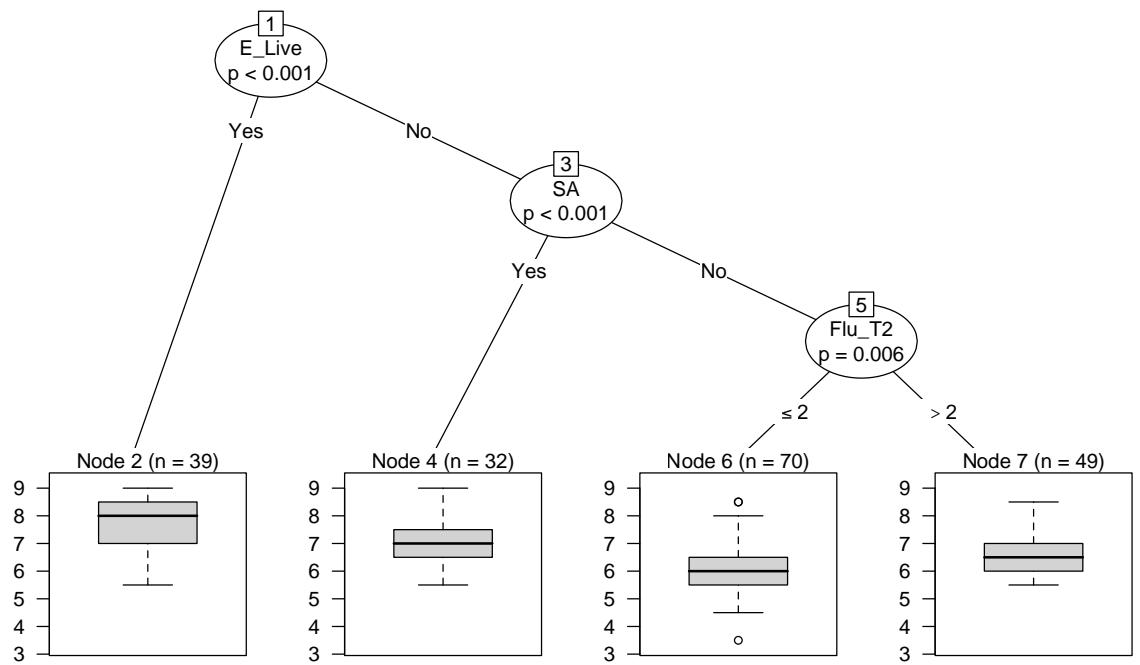
Figure 6: Regression tree for listening scores on Test 2
5.2.3.4 Writing scores
Figures 7 and 8 show regression trees for the writing scores for Test 1 and Test 2. Figure 7 shows that studying abroad and studying test techniques were predictive of writing performance on the first test. As observed for the overall scores on Test 1, test techniques were an important factor and this may partly derive from the fact that studying techniques for writing was related to higher overall scores. In addition, general motivation to learn English further divided the participants into groups, with more motivated learners scoring higher on the test.
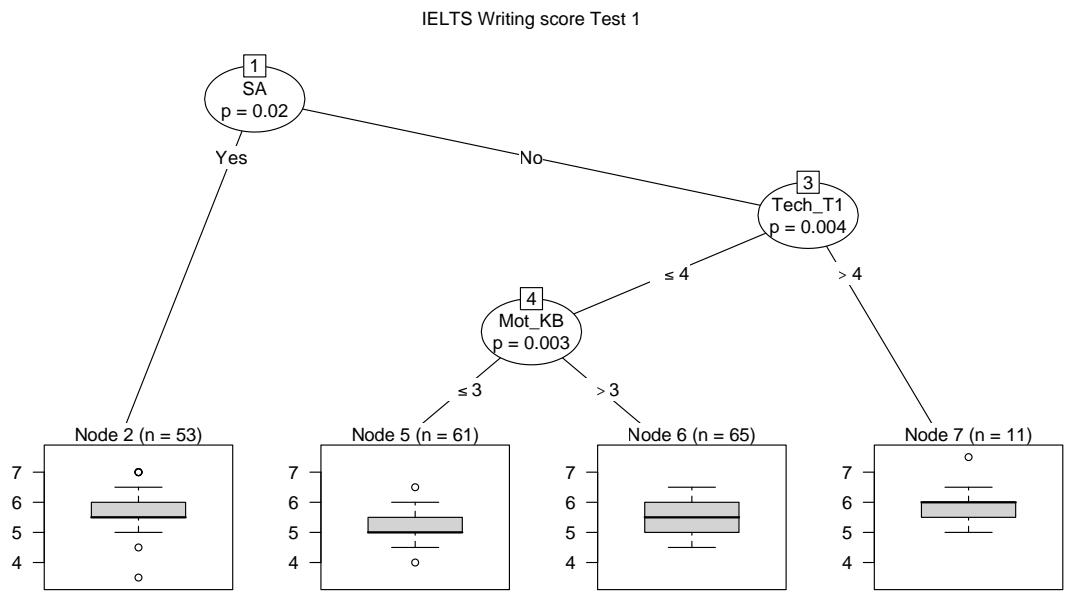
Figure 7: Regression tree for writing scores on Test 1
Figure 8 shows that experience of attending English-medium school was a significant predictor of writing performance on Test 2, as well as the amount of practice of writing done prior to the test. While studying test techniques was important for Test 1, indicating that test-takers spent time studying the format of the writing test, actual writing practice impacted scores for Test 2. This highlights the finding that test-takers prepared more for the second test, that is, over and above simply reading through the test format. It is not clear why study abroad was predictive for Test 1 writing but English-medium schooling was predictive for Test 2 writing, though the scores and number of participants in both groups are similar, suggesting some overlap. ‘Motivation to study writing after Test 1’ was the only significantly explanatory predictor of test scores for those whose scores increased. When considering the group whose scores increased on both the overall and the writing tests, this factor identifies the higher scorers in both data sets, making it an important factor predicting high scores and improvement on the IELTS test.
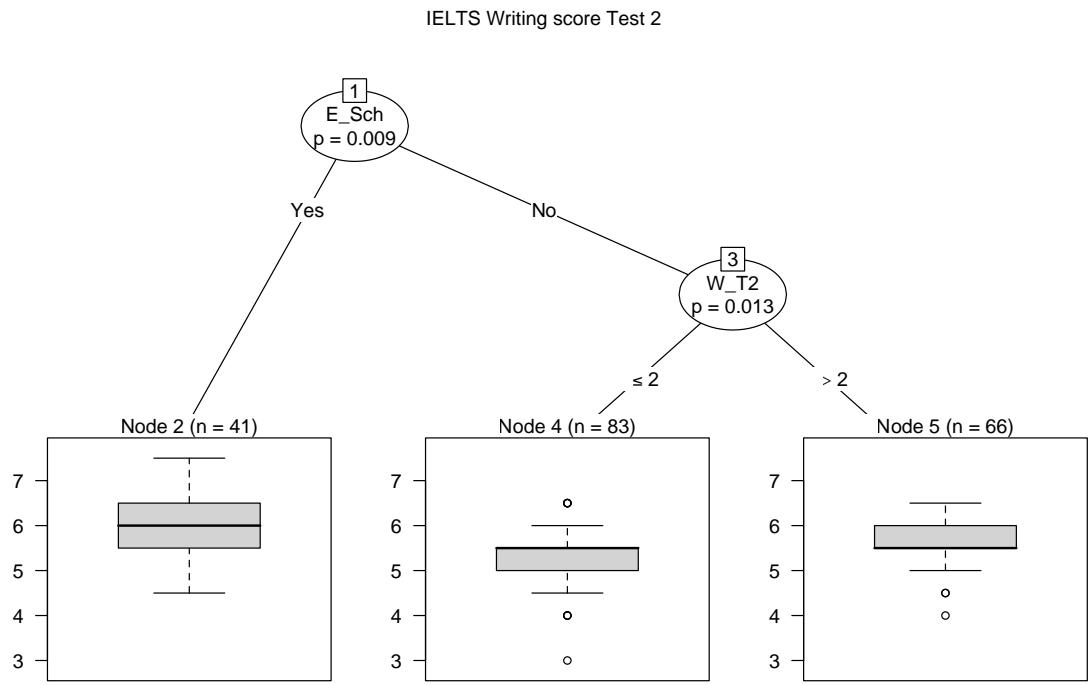
Figure 8: Regression tree for writing scores on Test 2
5.2.3.5 Speaking scores
Figures 9 and 10 show regression trees for the speaking scores for Test 1 and for the subset whose scores increased. Figure 9 shows that living and studying abroad were important factors predicting Test 1 scores. In addition, those who practiced spoken fluency also had higher scores than those who did not (5.5 vs. 4.5, respectively). Living abroad was the only significant factor explaining variance in speaking scores on Test 2 (n=39, median band score=6.5).
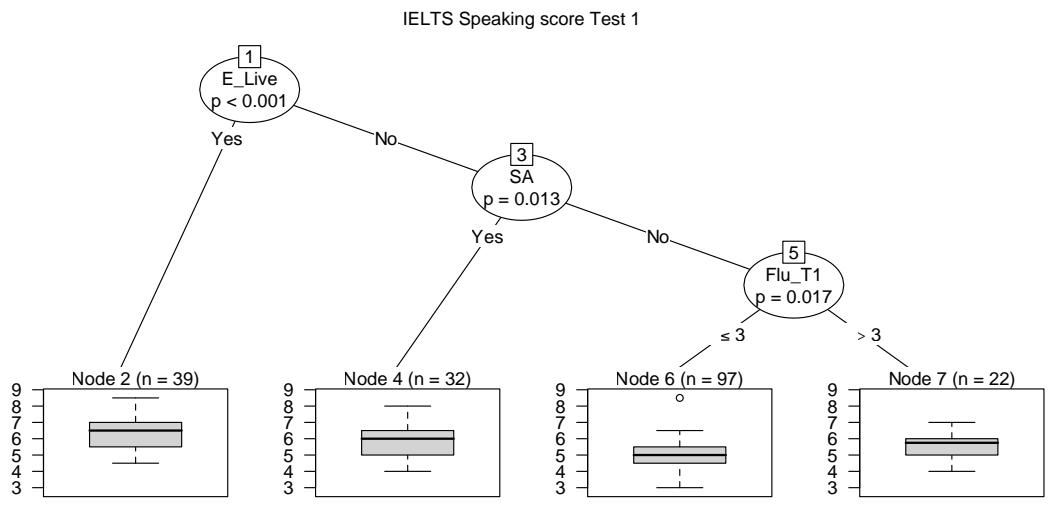
Figure 9: Regression tree for speaking scores on Test 1
Figure 10 shows that for those who improved their speaking score over the period, high writing motivation after Test 1, English-medium schooling and spoken fluency practice all explained variance in the speaking scores. Interestingly, 13 respondents who rated 6 (the highest possible rating) for the agreement statement ‘I was highly motivated to study writing after the first test’, improved their speaking score. Motivation to study writing, thus, predicts higher overall and writing scores on Test 2, and also higher speaking scores for those that improved in speaking. It is unclear why English-medium schooling is predictive of Test 2 scores for writing and speaking (of those who improved); perhaps those who had received at least some schooling in English had a stronger underlying ability in productive skills which only became apparent in the second test. For these participants, it was easier to gain higher scores in the productive skills due to their experience of using English in the past. IELTS Speaking score Test 2: Positive development only
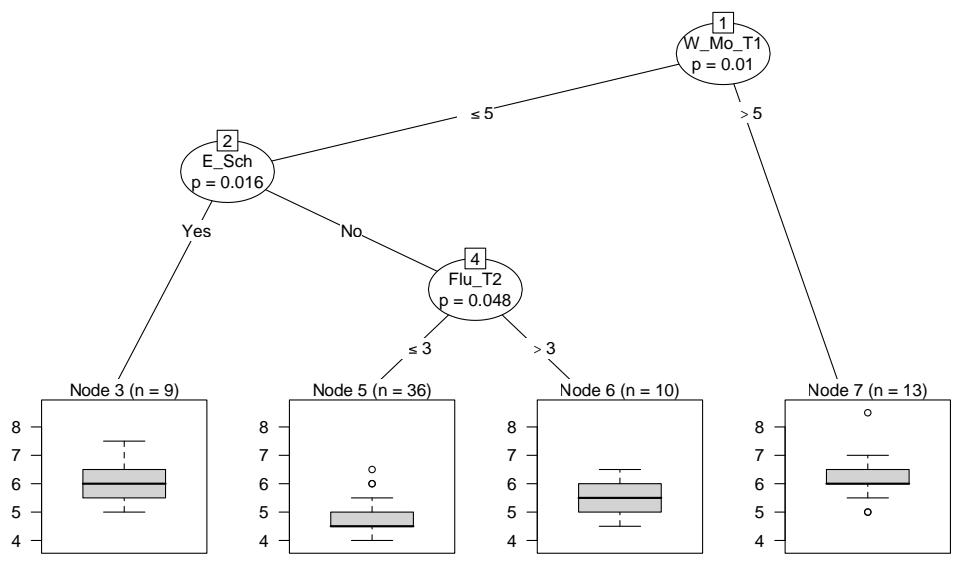
Figure 10: Regression tree for speaking scores for test-takers whose scores increased
5.3 Survey responses (RQ3)
5.3.1 Language history
The same 190 participants’ survey responses were analysed. The mean age of the participants (127 male, 62 female, 1 no response) was 20.2 years (SD=2.3 years). Information on languages known and used is omitted here and from the analyses due to problems in the survey question formats.
Of the respondents, 167 had always lived in Japan, received schooling solely in Japanese and only used Japanese at home, while 23 participants had not. Of the 23 respondents, five were considered to be international students based on the age range in which they began learning Japanese, length of stay and schooling in Japan, their own self-perceived Japanese language proficiency (<7 on scale of 0-9 with 9 being native speaker level), and additional information provided by these respondents. These respondents made up a very small proportion (3%) of the data. The remaining 18 respondents (9.5% of data) were considered to be ‘returnees’ based on the same criteria; that is, they had lived in Japan and abroad, but had Japanese as a first language.
The proportion of those who had lived in an English-speaking country was 21% (mean length of stay was 2.9 years) and 28% of participants had studied abroad prior to university; while a further 23% had done so while at university (mode duration in both cases = <1 month).
In response to the question ‘Would you like to study abroad in the future?’, 50% of participants responded ‘yes’, 36% ‘maybe’ and 14% ‘no’. The main reasons selected were to improve speaking ability (68%), to study an academic subject in English (58%), to learn culture (42%), to improve English in general (37%), and to study discipline-specific English (27%). All of these findings suggest that the sample was in general quite motivated to study English, as a quarter of them had either studied or lived in an English-speaking country, and half were keen to study abroad in the future.
Only a few participants were engaged in English club activities while at high school and university (7% each), while almost a quarter of participants had attended English conversation school while at high school (24%), and fewer while at university (8%). The popularity of conversation schools perhaps underscores students’ desires to practice speaking English, which was not being fulfilled at high schools.
5.3.2 IELTS preparation
Responses for the Items 34/40 ‘How many hours did you study for the first/second test?’ (Table 6) indicated that around a quarter of participants did not study at all, and a total of studied less than 20 hours for the first test, and studied less than 20 hours for Test 2. From this, it is clear that overall, although test-takers studied more for Test 2, the majority did not study much for either. This is important as often or more of the responses for the following Likert scale items indicate ‘strongly disagree’, which reflects the fact that around this proportion of test-takers prepared very little for the IELTS tests.
Table 6: Number of hours studied for each IELTS test
| 0 hours | 20 hours or less | 20 to 40 hours | 40 to 60 hours | 60 to 80 hours | More than 80 hours | |
|---|---|---|---|---|---|---|
| Test 1 | 23% | 65% | 9% | 2% | 1% | 0% |
| Test 2 | 25% | 54% | 15% | 4% | 3% | 0% |
Only 19 participants (10%) had taken IELTS in the past, meaning that most were taking the test for the first time. The reasons selected for taking the IELTS tests were because it was free (93% selected this response), for study abroad (50%), for the qualification (48%), for work (9%), and for other reasons (<2%). Thus, one reason why test-takers did not prepare much for the exams is probably the lack of financial incentive (i.e. the test was free) and also the lack of plans to study abroad (for 50%), even though in a previous question, 36% thought they may like to study abroad and only 14% said they did not want to study abroad.
In preparation for the IELTS tests, some participants attended the British Council workshops (28%), used the British Council website (36%), attended conversation school (2%), or sought help from English-speaking acquaintances (3%). Again, this may indicate less than strong motivation to prepare for the test.
Figure 11 below shows agreement responses for Item 33/39: ‘In preparation for the first/second test I studied mainly for reading/listening/writing/speaking’. While the majority of responses indicated minimal preparation for all skills on both tests, test-takers prepared more for writing and speaking, and less for reading and listening, prior to the second test.
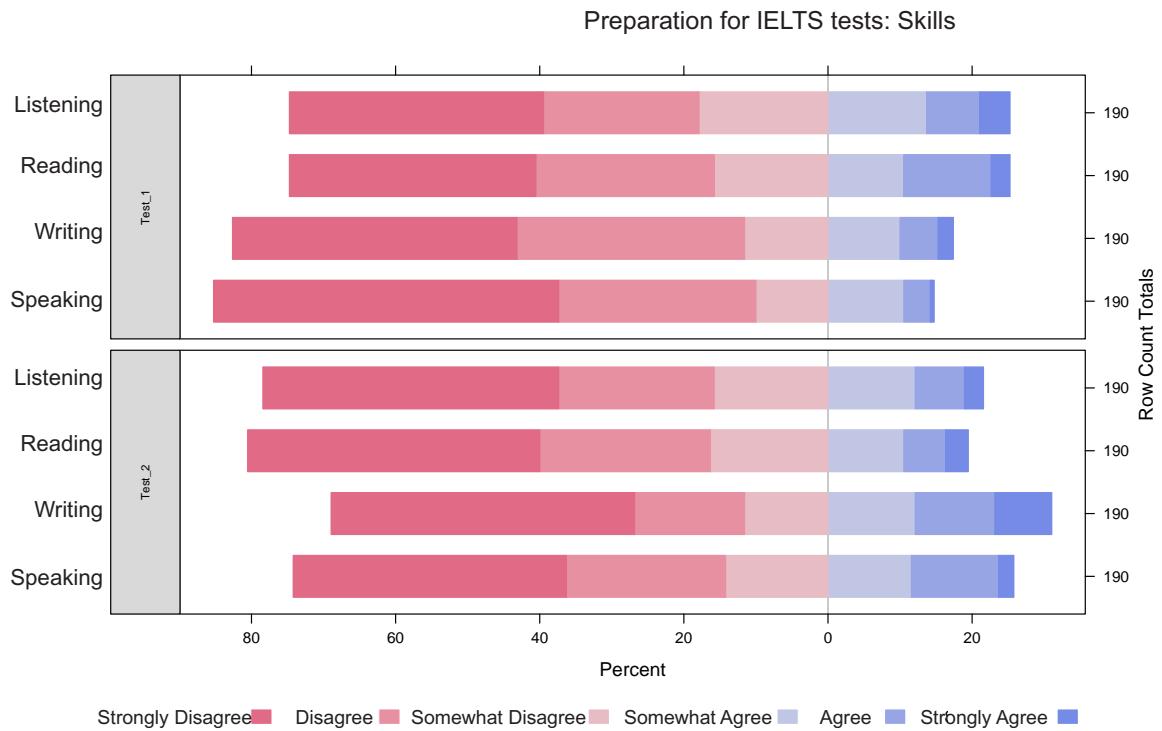
Figure 11: Responses to Items 33 and 39
Figure 12 shows agreement responses for Items 35/41: ‘In preparation for the first/second test I spent a lot of time on (tasks)’. Similar to the above, test-takers focused more on writing and speaking, and less on reading and listening, when preparing for the second test.
Preparation for IELTS tests: Activities
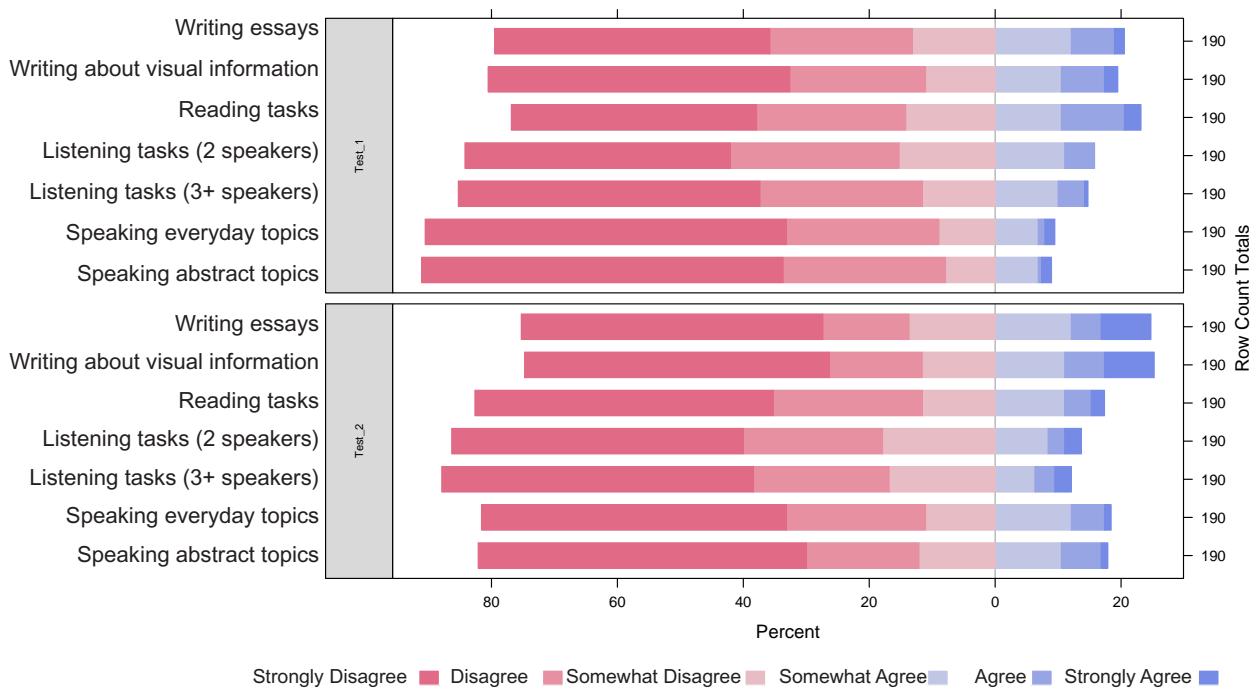
Figure 12: Responses to Items 35 and 41
Figure 13 shows agreement responses for three items: Items 37/43: ‘My preparation activities focused on grammar/vocabulary/pronunciation’, Items 36/42: ‘I practiced speaking immediately with little or no preparation time’ (i.e., unprepared spoken fluency activities), and Items 38/44: ‘I studied test-taking techniques a lot’. While most respondents disagreed, around 20% of respondents agreed for vocabulary, test-taking techniques and fluency. The least agreement was found for pronunciation. There were few differences across tests, though participants focused slightly more on fluency, and slightly less on grammar, in preparation for Test 2.
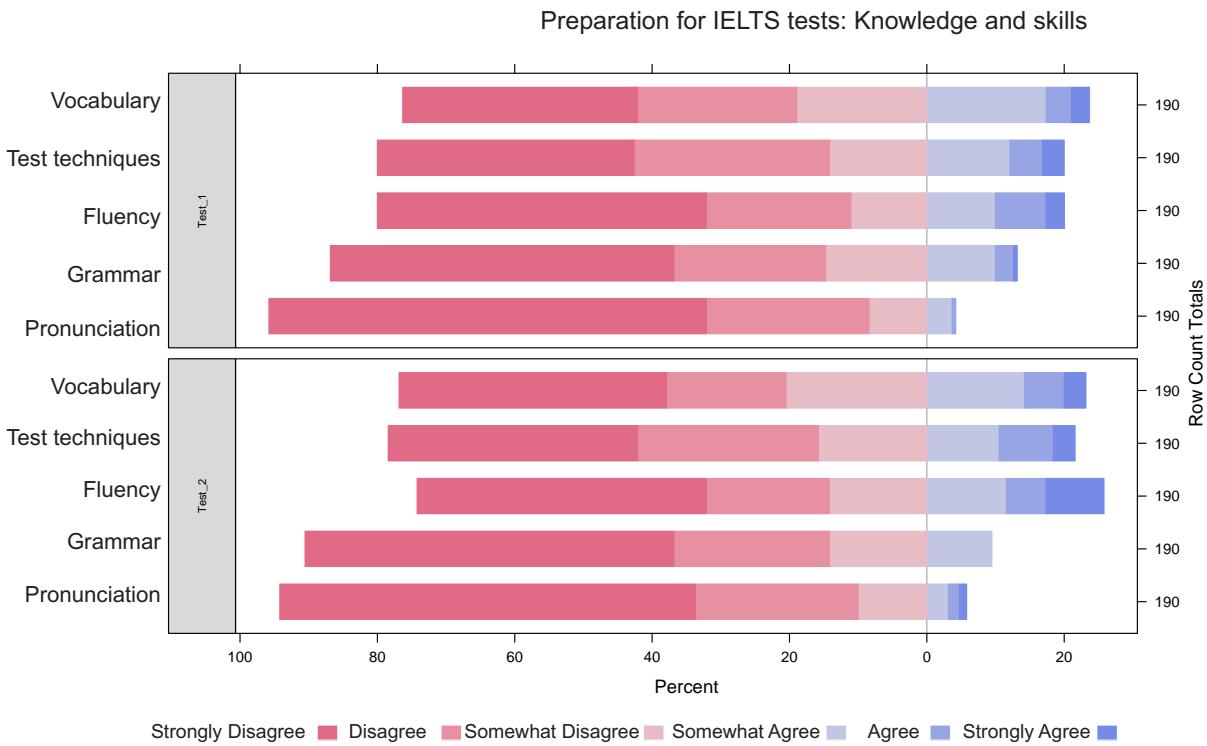
Figure 13: Responses to Items 36/42, 37/43 and 38/44
Figure 14 shows agreement responses for Items 50/52: ‘After the first/second test, I think my proficiency increased a lot in (skill)’. Test-takers felt that they improved the most in speaking, and then writing, particularly after the second test. There were slight drops in perceived improvements for the receptive skills following Test 2.
Perceived development following IELTS tests
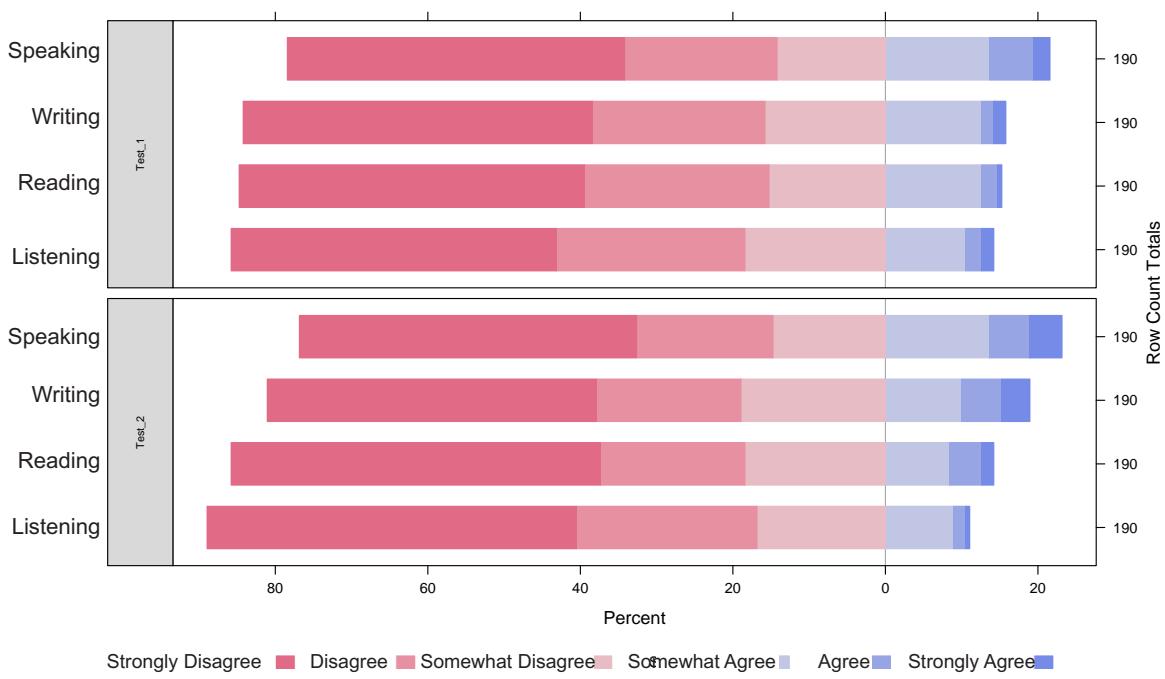
Figure 14: Responses to Items 50 and 52
Figure 15 shows agreement responses for Items 49/51: ‘After the first/second test, I was motivated to study more (skill)’. Of all the IELTS-related items, this is the only one to elicit greater than 50% agreement. Following Test 1, over half of participants were motivated to study speaking and writing, while less than half were motivated to study reading and listening. Following Test 2, these proportions increased for all skills. After both tests, fewer than 40% were motivated to study reading, which is probably due to the fact that test-takers had studied this skill the most until now, and had scored the highest on this skill in both tests.
Motivation to study following IELTS tests
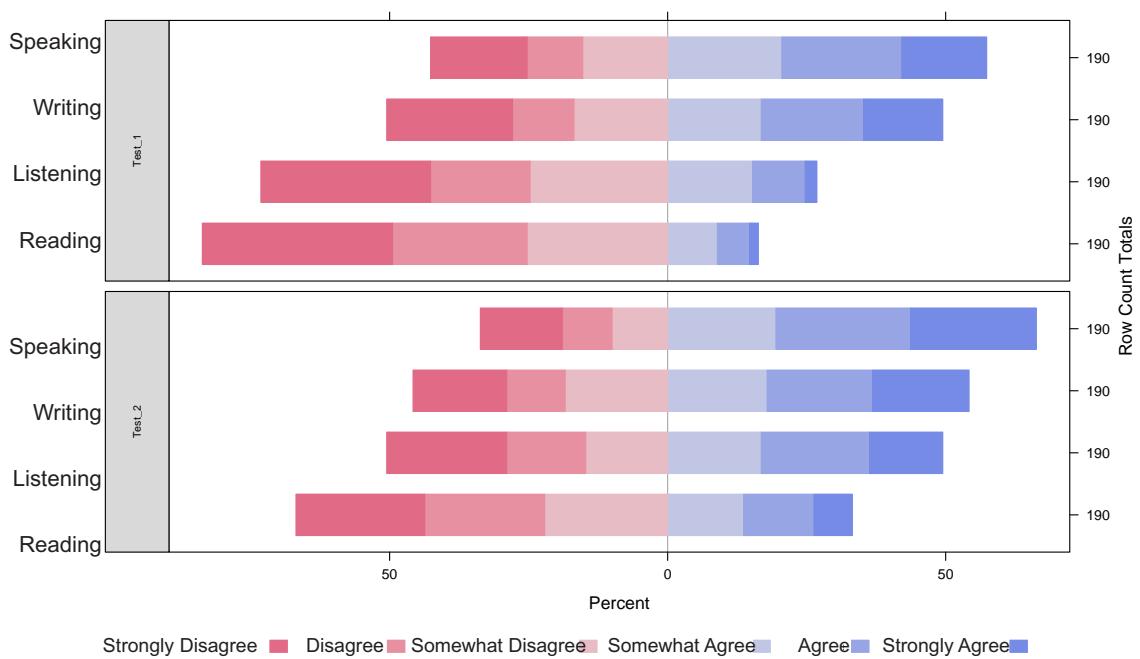
Figure 15: Responses to Items 49 and 51
5.3.3 University, cram school, high school
Responses regarding university, high school and cram school learning experiences are compared. Figure 16 shows agreement responses for Items 58/79/98: ‘I spent a lot of time working in __’. Both pre-tertiary environments involved almost exclusively individual work, with cram school being particularly devoid of pair and group work. University classrooms were still primarily organised in terms of individual work, but group work was more prevalent. Pair work, which is perhaps the most effective way to maximise student talk time in class, featured very little in all environments.
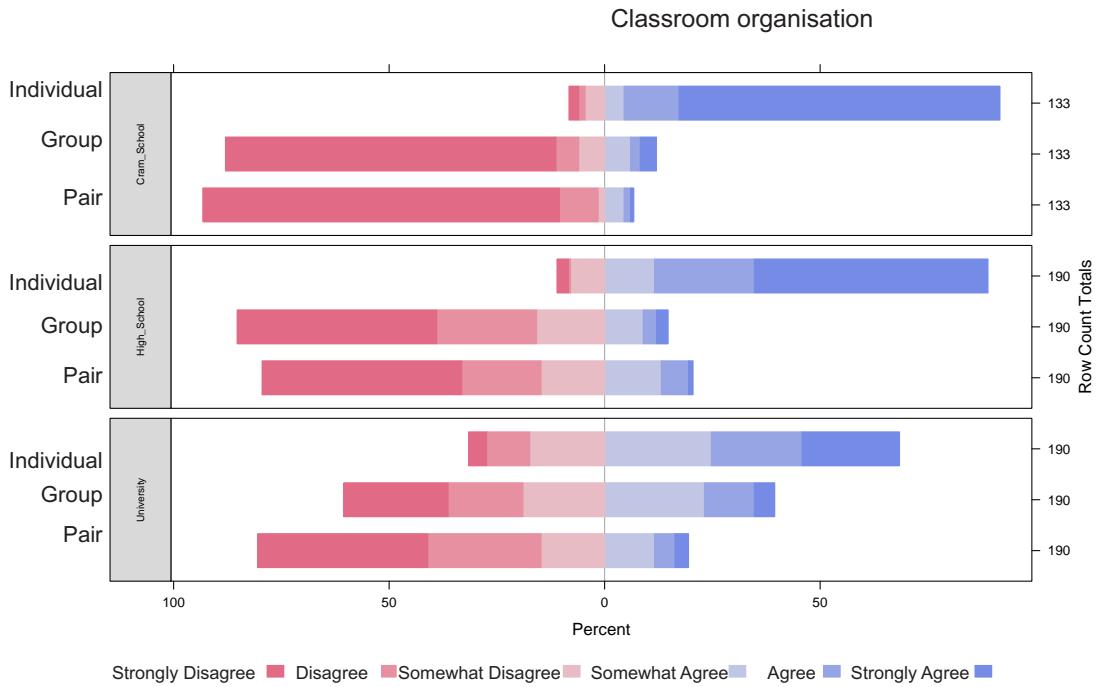
Figure 16: Responses to Items 58, 79 and 98
Figure 17 shows agreement responses for Items 59/80/99: ‘Overall my teachers talked for most of the class’. For both pre-tertiary situations there was strong agreement, suggesting primarily teacher-centred language classrooms and supporting the observation of classes involving mainly individual work. At university, responses were equally balanced suggesting much variation in the classes available. Given that large universities have many classes and teachers, who have varied teaching styles, experience and backgrounds, the participants are likely to have been exposed to very different classroom teaching methods.
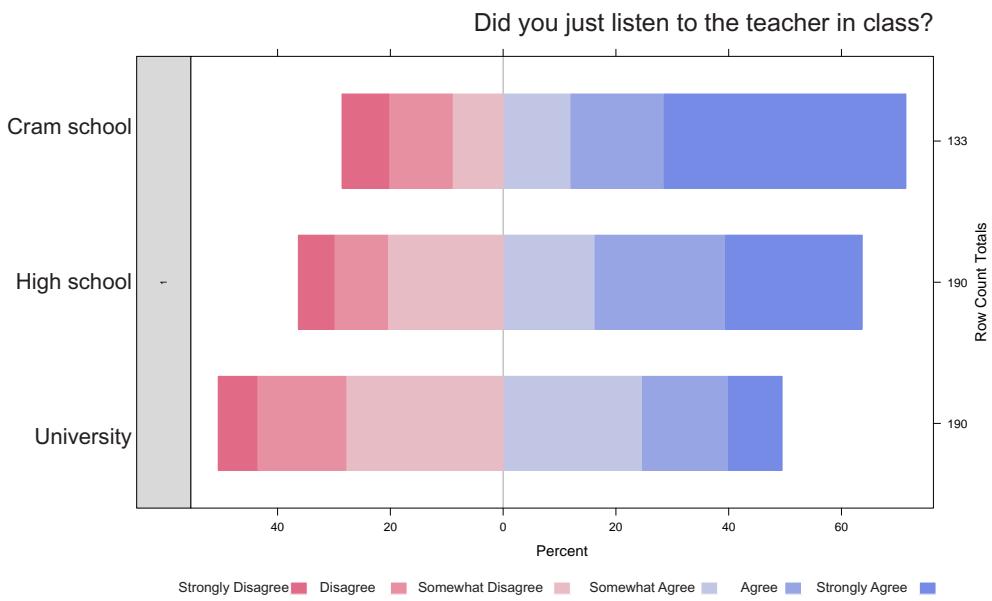
Figure 17: Responses to Items 59, 80 and 99
Figure 18 shows agreement responses for three statements: Items 60/81/100: ‘My teacher spoke mainly in English during the class’; Items 61/82/101: ‘I mainly used English when speaking to the teacher in class’, and Items 62/83/102: ‘I used English most of the time when speaking to other students in the class’. The results show that English is rarely used in pre-tertiary situations, especially by students when talking to one another or the teacher. The teacher uses English the most in pre-tertiary situations, particularly in high school, which supports the previous indication that classrooms are teacher-centred. At university, teachers were more likely to use English in the classroom and students appeared to often speak to the teacher in English. This finding may reflect the fact that there are more native-speaker/highly proficient English-speaking teachers in UT compared with high schools (and cram school). Even still, students apparently did not often interact with their peers in English.
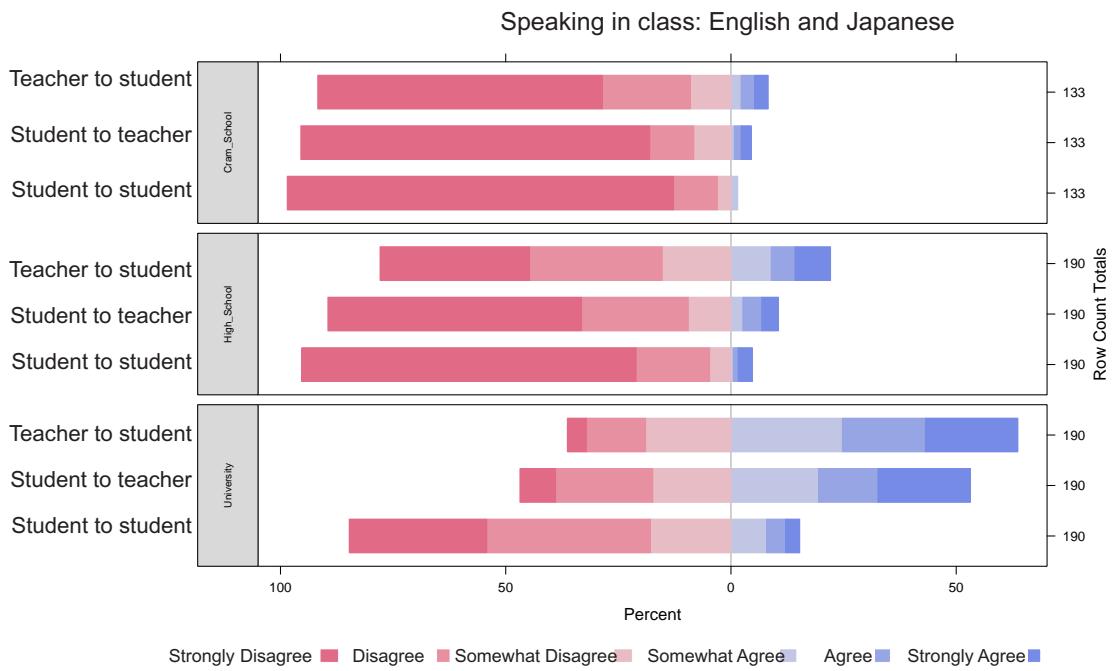
Figure 18: Responses to Items 60/81/100, 61/82/101 and 62/83/102
Figure 19 shows agreement responses for Items 64/85/104: ‘My homework often involved (skill)’. A similar pattern is revealed in all learning environments: Speaking homework is extremely rare, while reading homework is the most common, followed by writing. The amount of homework appears to be overall greatest at cram school.
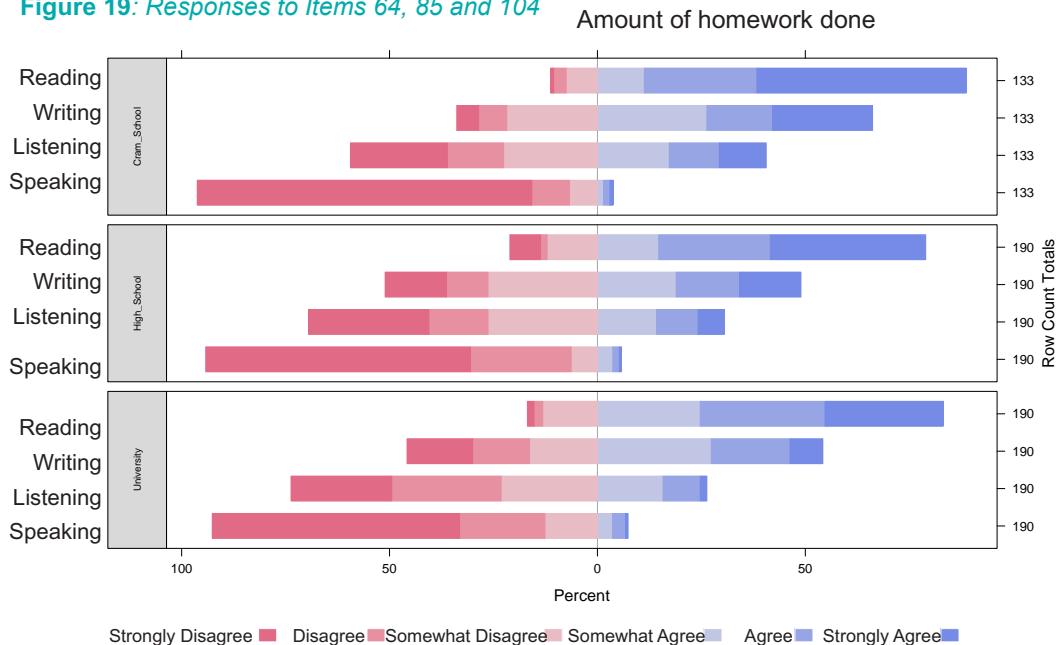
Figure 19: Responses to Items 64, 85 and 104
Figure 20 shows agreement responses for Items 65/86/105: ‘Overall, class activities focused on (skill)’. Reading is by far the most practiced skill in all environments, while speaking, is by far the least, especially at the pre-tertiary level. The need to prepare for entrance examinations most likely dictates the skills focus, though it is less clear why this trend is maintained at university.
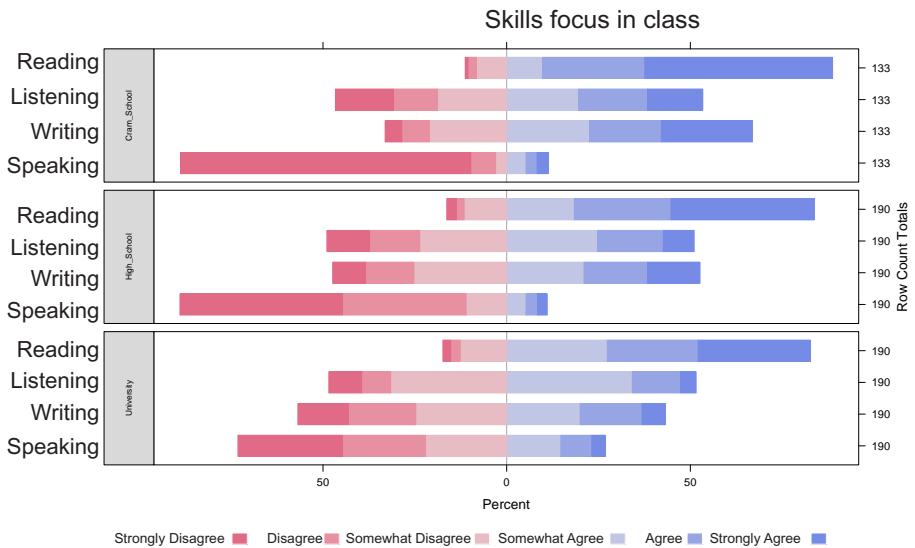
Figure 20: Responses to Items 65, 86 and 105
Figure 21 shows agreement responses for three items: Items 68/89/108: ‘My preparation activities focused on grammar/vocabulary/pronunciation’; Items 67/88/107: ‘I practiced speaking immediately with little or no preparation time’ (i.e., unprepared spoken fluency activities); and Items 70/91/110: ‘I studied test-taking techniques a lot’. In pre-tertiary contexts, the focus appears to have been on vocabulary, grammar and test-taking techniques, and these are studied particularly intensively at cram school. There was some focus on pronunciation but very little on spoken fluency, especially at cram school. The minor focus on pronunciation may reflect the fact that the NCUEE and university entrance examinations include indirect tests of pronunciation (word stress placement). At university, there was little focus on any of the aspects, though vocabulary, fluency and grammar received at least some attention. Fluency was focused on more at university, though still minimally. Because there was no exam to prepare for, test-taking techniques received little attention. Pronunciation received even less attention at university than in pre-tertiary situations.
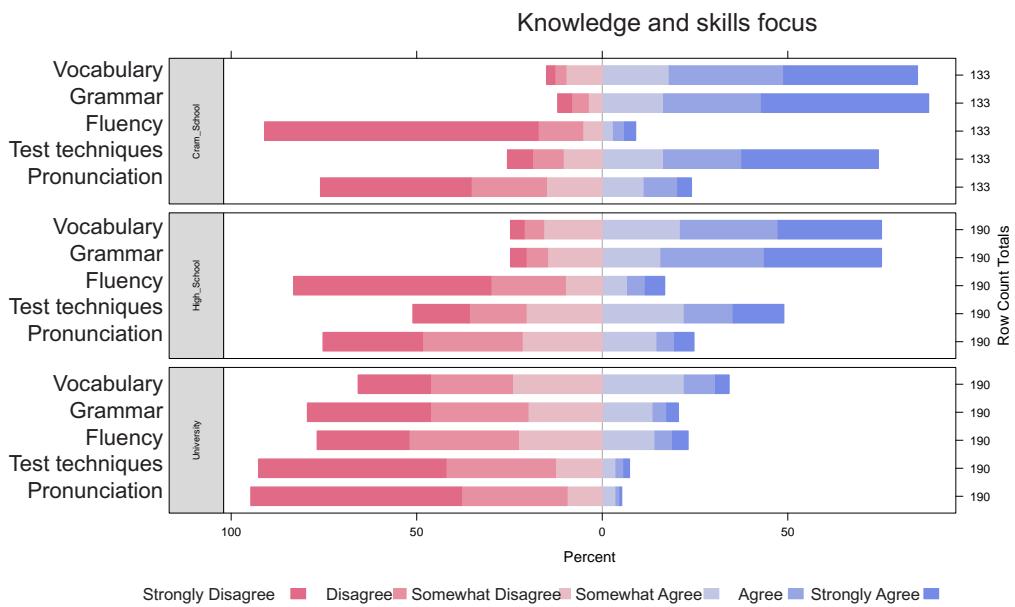
Figure 21: Responses to Items 68/89/108, Items 67/88/107 and Items 70/91/110
Figure 22 shows agreement responses for Items 69/90/109: ‘I spent a lot of time on (tasks)’. Reading tasks were the most common in all cases, and markedly so at cram school. Writing essays was the next most common activity, though it is unclear how respondents interpreted the meaning of ‘essay’. Also, ‘writing about visual information’ was likely interpreted to include describing a picture, which is a common task found on entrance exams and in practicing grammatical form during sentence composition; these activities are somewhat different from the IELTS Writing Task 1, from which the activity was derived. Listening activities were quite common in pre-tertiary environments, though not at university, and speaking tasks were very limited in all environments.
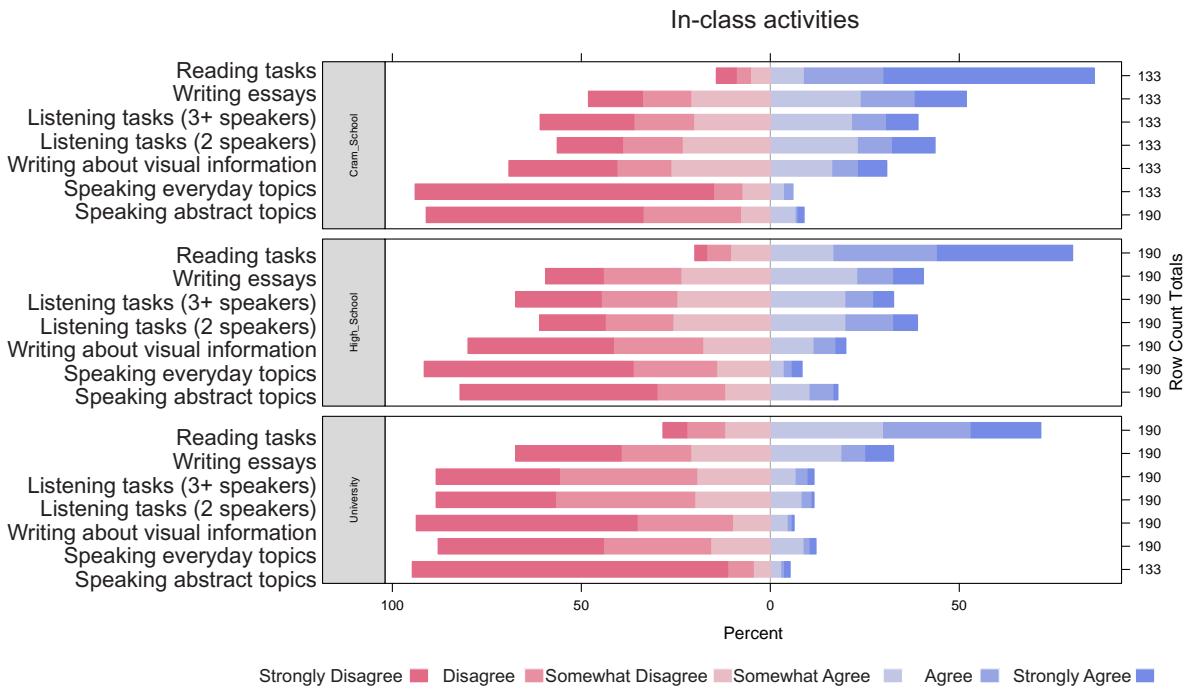
Figure 22: Responses to Items 69, 90 and 109
Figure 23 shows agreement responses for Items 72/93/112: ‘I was satisfied with my classes at ____’. Responses revealed marked differences in satisfaction, with approximately 70% agreement for cram school, roughly equally divided agreement at high school, and approximately 70% disagreement at university. Satisfaction is perhaps evaluated in terms of the students’ goals in each case: at cram school, the goal was to pass the entrance exam, which all of the current participants were successful in doing, and thus satisfaction was generally quite high. In contrast, university English education apparently failed to meet the expectations of the students; this point is taken up in the analysis of interview data.
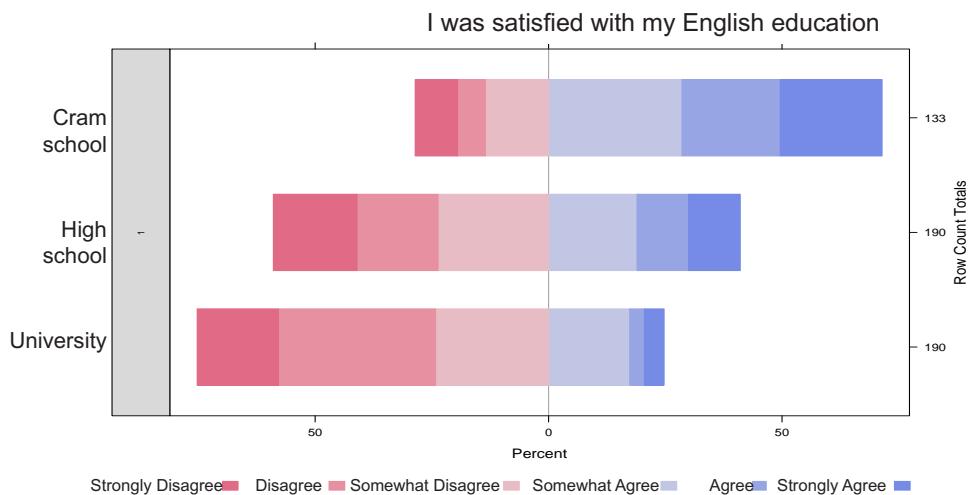
Figure 23: Responses to Items 72, 93 and 112
Figure 24 shows agreement responses for Items 66/87/106: ‘Overall, I think my proficiency improved in (skill)’. The greatest perceived improvement was at cram school for reading, but also writing and listening. At high school, participants also felt that they improved at reading, as well as writing and listening. At university, there was much less agreement overall, though the order of perceived improvement is the same. Importantly, in all environments, participants generally felt that their English-speaking ability did not improve.
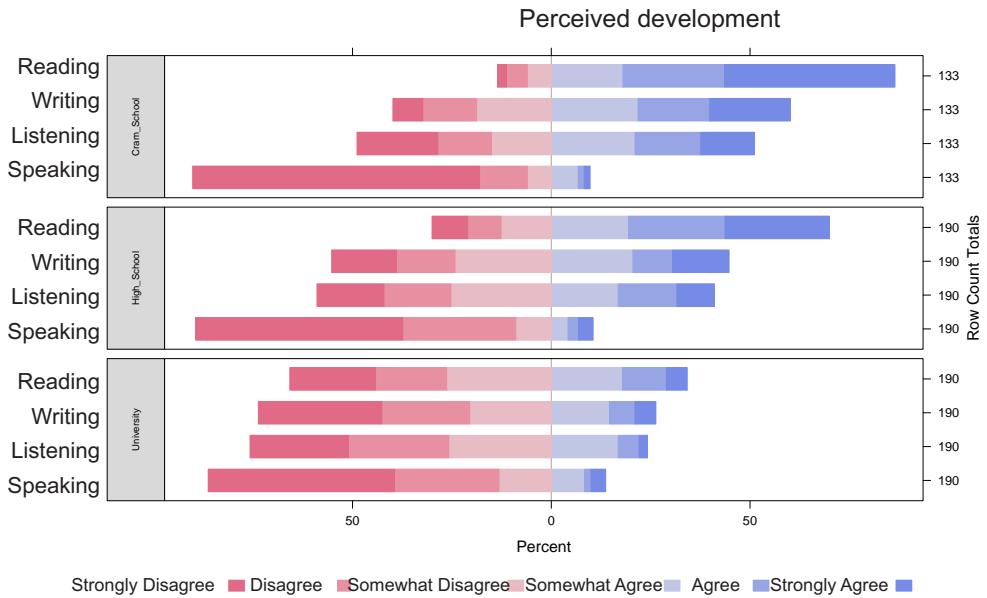
Figure 24: Responses to Items 66, 87 and 106
Figure 25 shows agreement responses for Items 74/95/114: ‘I was motivated to study English’. Motivation was greatest at cram school, especially for reading, followed by writing and listening, with markedly little motivation to study speaking. A similar pattern was observed at high school, though with overall less agreement. At university, students were most motivated to study speaking and writing, followed by listening and reading. It should be noted, however, that 60% of respondents at university (and around 50% at high school) were generally not motivated to study. Students were most motivated at cram school, when they were studying for the university entrance exams.
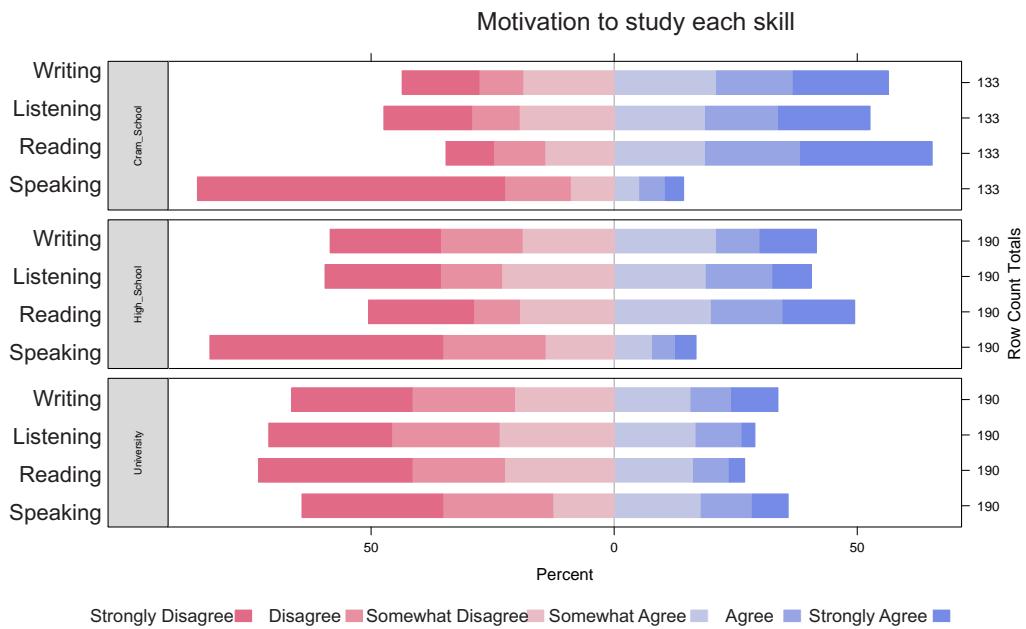
Figure 25: Responses to Items 74, 95 and 114
Table 7: Characteristics of English language study in different learning environments
| Test | NCUEE and UT | (None) | IELTS | |
|---|---|---|---|---|
| Learning situation | High school | Cram school | University | Self-study only |
| Classroom organisation | Individual (90%) Pair > Group | Individual (90%) > Group > Pair | Individual (70%) > Group > Pair | N/A |
| Teacher/student-centred instruction | Teacher (65%) | Teacher (70%) | Both teacher and student-centred classes (50-50%) | N/A |
| Language used by teacher/students | Almost no English in any interactions | Almost no English in any interactions | English with teacher (50-60%), English between students (50-50%) | N/A |
| Skills focus in class/test preparation | Reading > Listening = Writing > Speaking | Reading > Writing > Listening > Speaking | Reading > Listening > Writing > Speaking | Reading = Listening > Writing > Speaking (Test 1) Writing > Speaking > Listening > Reading (Test 2) |
| Skills focus of homework | Reading > Writing > Listening > Speaking | Reading > Writing > Listening > Speaking | Reading > Writing > Listening > Speaking | N/A |
| Focus on spoken fluency | Very little | Very little | Little | Little (Test 1, 20%, Test 2, 25%) |
| Focus on form, fluency and test techniques | Grammar = Vocabulary > Test techniques > Pronunciation > Fluency | Grammar > Vocabulary > Test techniques > Pronunciation > Fluency | Vocabulary > Fluency > Grammar > Test techniques > Pronunciation | Vocabulary > Test techniques = Fluency > Grammar > Pronunciation (Test 1) Fluency > Vocabulary > Test techniques > Grammar > Pronunciation (Test 2) |
| Focus on types of activities | Reading > Writing essays > Listening > Writing about visual information > Speaking abstract > Speaking general | Reading > Writing essays > Listening > Writing about visual information > Speaking abstract > Speaking general | Reading > Writing essays > Listening = Speaking general > Writing about visual information > Speaking abstract | Reading > Writing essays > Writing about visual information > Listening > Speaking general > Speaking abstract (Test 1) Writing about visual information > Writing essays > Speaking general > Reading > Speaking abstract > Listening (Test 2) |
| Focus on test-taking techniques | Yes | Yes | No | Yes (20%, both tests) |
| Satisfaction | 45% somewhat or more satisfied | 70% somewhat or more satisfied | 30% somewhat or more satisfied | N/A |
| Perceived development | Reading > Writing > Listening > Speaking | Reading > Writing > Listening > Speaking | Reading > Writing > Listening > Speaking | Speaking > Writing = Reading = Listening (Test 1) Speaking > Writing > Reading > Listening (Test 2) |
| Motivation to study each of four skills | Reading > Listening = Writing > Speaking | Reading > Writing > Listening > Speaking | Speaking > Writing > Listening > Reading | Speaking > Writing > Listening > Reading (Both tests) |
5.4 Interview data (RQ3)
5.4.1 IELTS preparation
5.4.1.1 Overview
Fifteen interviewees reported that they did very little or no study in preparation for the first IELTS test. This was primarily due to the lack of time available due to other study, social and part-time work commitments. However, 10 students appeared to prepare more for the second test than for the first test. Moreover, 11 test-takers appeared motivated to study further following the second test. Two noted that their scores increased, which led to greater confidence and a desire to maintain their English ability and particularly an ability to improve speaking ability (P8).
P8: After being allowed to take the IELTS test twice I felt like I’d really improved, and that made me feel like trying even harder.
5.4.1.2 IELTS Reading and Listening preparation
Seven interviewees mentioned strategic reasons for focusing on receptive skills on the first test, such as they are easier to improve, and five said that it is easier to study them by themselves. Moreover, a theme emerged that, while test-takers realised that they were stronger at receptive skills, they thought that, given the limited amount of time available, if they focused on these they could gain a reasonable overall score (e.g. P9).
P9: For now, I thought, in terms of efficiency it’s better to study listening and reading, to get used to the format.
However, three reported that they did not prepare much for the reading section as they studied reading intensively when preparing for the entrance exams (e.g. P5).
P5: While I was preparing for the entrance exams I was made to do reading and listening almost exclusively, so I thought I’d done enough…so I didn’t study for them.
In terms of materials and methods used when preparing for the tests (all skills), test-takers adopted a range of approaches. Overall, IELTS preparation materials and past papers were the most common for both tests. Authentic materials such as Time magazine, the NY Times, the Telegraph, non-fiction books, TED video clips, and CNN News, were also used by five respondents. Participants mentioned that such activities were not direct preparation for the test, but instead part of their normal study routine. In addition, two test-takers actually used TOEFL and entrance exam materials to practice listening.
5.4.1.3 IELTS Writing and Speaking preparation
Six interviewees mentioned explicitly that they needed to improve their writing ability following the first test. The IELTS test thus appeared to raise test-takers’ awareness of their own writing ability. Three noted how the writing tasks were much more difficult than the writing tests they had experienced previously, particularly in entrance exams (e.g. P7 and P15) and other timed writing tasks.
P7: The length is very different, and the content, we’re asked to state an opinion on something, how much we agree with something. We have to do that kind of really detailed writing, so like ‘I agree and the reasons I think so are…’. The format isn’t fixed, and so rather than just fitting words in a pre-formulated structure, we have to pay attention to detail when writing.
P15: In IELTS you look at the graph and write what you think about it…interpreting the graph and writing about it, in that point IELTS writing is really difficult I thought.
There was also a positive effect on their motivation to study writing in English. Four reported studying writing intensively for the second test (e.g. P12), often focusing on writing fluency (e.g. P18).
P12: Writing, well, there wasn’t really anyone to show it to, so I just wrote something and looked at it, as well as the model answer, and thought ‘right, if I changed it like this then it’d be better’, and I just kept thinking over and over about things like that. P18: For writing, basically speed is really important I thought so, everyday, well not everyday actually, I practiced writing 200-250 words…in the IELTS workbook there are lots of questions, and I wrote answers for them, a little each day. So, using the workbook and past papers book, there are real IELTS questions so I prepared using those…I practiced most for it, finishing within the allocated time, and I also tried to write a well-organised answer, I think.
Not all test-takers practiced actual writing, however, in preparation for the second test. One test-taker simply read about the writing tasks and another looked at model answers and made notes on phrases (P14).
P14: Yes, so for writing, I’d bought a few books, and so I looked through those seeing what kind of questions come up in the exam, checking them really quickly, and rather than writing myself, I really just looked at the sample answers and made notes of any expressions that I thought I could use in the real exam.
While these study behaviours are not unhelpful for developing writing ability, they are limited by the fact that they do not actually involve actually writing in English. While this strategy may simply reflect limitations of time available for study, it may also show a lack of understanding about how to practice productive skills. In relation to this, interviewees complained that no one was available to check their writing, and consequently they could not study writing (e.g. P9), and another pointed to the importance of native speakers checking his writing (e.g. P2).
P9: For the second test, I read through most of the speaking and writing sections in the study guide. I didn’t practice writing by myself though, but I checked the techniques and read through them… P2: Regarding writing, I thought it was no good unless a teacher, a native speaker, could properly correct it for me.
In sum, positive washback was apparent in terms of motivation and writing strategies, particularly those related to writing fluency. The writing tasks were considered to be more difficult than previously experienced tests/tasks, and this helped raised test-takers’ awareness of their own writing ability. A theme also emerged that studying writing cannot be done alone and that teachers were necessary in order to improve.
Regarding speaking, after the first test, 13 out of 19 interviewees stated that they wanted to improve their speaking ability. Thus, the IELTS test appeared to positively influence test-takers’ motivation to study speaking. For two test-takers, the speaking component provided them with a clear realisation of their own lack of ability to express themselves in English (e.g. P15). For one, this and the fact that he was going to study abroad motivated him to study speaking; another became more aware of her lack of spoken fluency through the test.
P15: I couldn’t speak at all. I couldn’t say what I wanted to say. Although I couldn’t speak, the examiner was really friendly. At the beginning there is small talk, and that made me relaxed I thought, but saying everything what I thought in English was just impossible.
Four interviewees suggested that the focus on entrance exams resulted in a lack of practice speaking in pre-tertiary education (e.g. P15).
P15: At high school, there was absolutely no need to speak English, if you could read, listen and write, you could pass the entrance exam, and the exam was the priority, so because there was no speaking on the exam, I didn’t do any at all.
The IELTS Speaking Test was considered to be more difficult than other tests interviewees had encountered. One reasoned this was because there was a real interviewer present. Two test-takers mentioned the necessity to really think about the content of what you are saying, whereas the EIKEN Test (level 2) ‘is more like a quiz’. Another referred to the EIKEN level 3, which apparently has a very clear ‘pattern’ that could be learned easily. Other issues related to the difficulty of the speaking test included topic difficulty (2), and listening ability, which influenced the test-taker’s ability to respond during the oral interview. This is an interesting example as it ties in with the finding that practicing spoken fluency explained some of the variance in listening scores.
Due to the perceived difficulty of the speaking test, three test-takers avoided practicing speaking altogether and thought that by studying receptive skills they would gain a higher overall score. Another reason why test-takers did not study is that they did not know how to study speaking (e.g. P1).
P1: Speaking was the only skill that I didn’t know how to improve…I’ve really got to think about how to do it.
Five participants read about the speaking component of the test without actually practicing speaking (e.g. P7). In one case, this was specifically mentioned to be due to time constraints.
P7: For speaking as well, I just read the techniques…There are these categories with vocabulary written in them, and well I just read them, I didn’t actually practice saying them.
Test-takers regularly mentioned the lack of opportunity to practice speaking (6), and noted how it is difficult to practice speaking by oneself (6). Thus, speaking was, like writing, perceived by a number of test-takers to be a skill that must be practiced with an interlocutor (e.g. P15).
P15: I thought that I must concentrate on speaking really, but in the end, I didn’t really do anything. In my ‘English Only’ class I spoke sometimes, but that was about the only opportunity I could find.
Four test-takers did practice speaking in response to IELTS task questions by themselves (e.g. P2), or with a parent or teacher. Another (P11) practiced more for the second test, especially for Part 2 of the speaking test. He also reflected on the result of the second test and was motivated to study more.
P2: I didn’t speak (with anyone) at all. Normally there’s absolutely no opportunity to speak so I tried speaking aloud, personal introductions, greetings. But really only a little, you couldn’t really say I studied it.
P11: It’s a long question, not something you can answer with ‘yes’ or ‘no’, so you need to think about it by yourself, and in the last test I kind of got stuck, so I thought I definitely need to be able to respond and so I practiced that part.
…My speaking didn’t improve as much as I’d thought, so if I can, well, if it’s possible, I’d like to find a partner to talk to and prepare more that way.
In sum, test-takers became more aware of their speaking ability through the test, and many became motivated to study speaking as a result. The test was perceived to be difficult, for many reasons, and this highlights the fact that test-takers had little previous experience of practicing speaking. Many did not actually practice speaking, which indicates a lack of positive washback, and this was due, in some cases, to a lack of opportunities to practice and/or understanding about how to study speaking. Positive washback was, however, apparent for a number of interviewees in the form of actual speaking practice prior to the test.
5.4.2 University, cram school, high school
5.4.2.1 University
Eleven interviewees considered reading to be the primary skill focused on at university. Ten reported little focus on speaking, while listening and writing were mentioned in regard to particular classes that focused on these skills. Eleven test-takers mentioned that they wanted more opportunities to learn and practice speaking. One (P12) criticised the focus on reading and grammar at the expense of developing students’ spoken fluency, primarily because the former can be done alone while the latter needs others to interact with.
P12: I think we should strive more to learn speaking at university. I know it’s important to be able to read specialist texts in the future but, that’s something I can do by myself, isn’t it? And so, honestly, I don’t really know what the university expects from teaching us something we can do by ourselves if we try. My impression is that it’d definitely be better to put more effort into speaking and writing.
Another noted that the speaking activities were very different from those found in the IELTS test. Discussion activities were widely criticised (9), notably because students end up speaking in Japanese (4). The topic was considered too difficult in the discussions, which led to them using Japanese. Speeches and presentations were also criticised.
One interviewee wanted more opportunities to speak with peers in English (P11), another wanted more pronunciation practice and another suggested that spontaneous speaking tasks were not done in class (P1).
P11: I wanted more time to speak English, I think. In most cases, the teacher gives some topic and we write a response, give a presentation. More than that I think it’d be better to try talking with peers, and the teacher, and get used to English expressions that way.
P1: I feel like I haven’t spoken at all in any of the classes that I’ve taken…there’s nothing like IELTS where someone says something and then we have to respond spontaneously.
Sixteen expressed some dissatisfaction and eight specifically criticised the lack of speaking activities. Four compared university education to high school and entrance exam preparation classes, saying that they were similar in focusing on reading and grammar (e.g. P17).
Another criticised the length of writing tasks in a compulsory class, which were far shorter than IELTS-type tasks (e.g. P12).
P12: Teachers rarely give writing homework, and when they do, it’s almost always to write around 50 words, usually a summary. There’s hardly ever anything that feels free, like IELTS, such as ‘what do you think’ and write 200 or 300 words, and that’s the problem with writing.
However, four were generally more positive about English at university. One interviewee explains how she maintained her reading ability, which she was happy about (P17).
P17: Since becoming a second-year student, I have to read lots of reports for my other classes, and also, English novels, there’s a lot of that, so all in all, there’s probably more reading than in the first year. And I’ve been doing it routinely so in winter of the first year, I felt that my ability, particularly reading, dropped, but I felt I’ve maintained my level, so as a second year, I’m quite satisfied.
5.4.2.2 Cram school
Of the 19 interviewees, 15 went to cram school to study for the entrance exam. Three of these stated that they had attended courses that focus specifically on the UT entrance exam. Cram school was described consistently in many regards. Essentially, students do ‘huge’ amounts of reading (7) at home and in class. Grammar was also stated as the primary focus of study (6, e.g. P12).
P12: Reading, was like, the instructor brought university entrance exam questions, we’d answer them, analyse the answers, do more, analyse them, like that. And, in terms of putting in effort, grammar was a priority.
The UT entrance exam, and to a lesser extent other universities’ past papers or similar material, was the main focus and source of material (11) and students worked on these every week. The skills/knowledge focus was directly related to the weightings of these on the exam: reading and grammar were priorities as they make the up the largest proportion of the exam.
Speaking was completely absent (8) because it does not feature in the entrance exam (e.g. P7). Likewise, pronunciation was only studied to the extent that it appeared on entrance exams (e.g. P4).
P7: You don’t hear of speaking on the entrance exams, so cram schools don’t focus on it…
P4: Pronunciation questions come up on the Center (NCUEE) Exam, so we studied them, just so we didn’t lose the points in the test.
Listening featured much less in classes (4) as it is a smaller part of the exam (2) but past paper questions were set for homework (1). Writing was often done and focused mainly on the 50-60 word tasks that feature in the entrance exam (5). Techniques were mentioned regarding the writing tasks, especially regarding translation tasks that are common on the UT exam.
5.4.2.3 High School
Impressions of high school English education were much more varied than those of cram schools, most probably because of the variety of schools attended. However, seven interviewees considered high school education to be focused on the entrance exams, too much so in some cases (4), when other aspects of English would have been appreciated (e.g. P11):
P11: High school was really busy all the time, not just for English but, strongly speaking, I’d have like to have tried to learn other aspects of English, not just exam preparation, such as conversation, or something related to culture. In retrospect, that’s what I’d have liked to have tried.
Reading was the primary skill focused on (9), too much so (2). One stated that reading was initially taught through translation, then reading in English just for the main points. Grammar and vocabulary study were main foci (3), one interviewee complains there was too much grammar (P12), and in what one interviewee referred to as his orthodox style classes, these were taught mainly before skills work.
P12: Honestly speaking, I’d have liked half of our study to be of actually useful English, as long as we could get through the entrance exams. I wonder whether we really need that much grammar…
A typical style of classes appeared to be that students read a text for homework, and then in class, the teacher reads through it, picking up important phrases and grammar (4). Translation was common (6, e.g. P5). Listening was common in classes but seemed to vary a lot from a little (5) to a lot (2).
P5: The teacher didn’t really conduct the class in English, in other words, it was done in Japanese. He says ‘ok, let’s work through from this page to that page’, we’d all answer the questions, then check them together. For reading as well, we’d read, translate, read, translate, in that kind of style, which in my impression, wasn’t enough for me.
Writing was limited to exam tasks (3) or only set for homework (1). There was not much speaking in general, sometimes none at all (2). One interviewee noted that this was because of the focus on exams. One noted that shadowing was the main form of speaking practice. Some students had ‘oral communication’ classes (7), but respondents did not appear satisfied with them for a number of reasons: one class actually just focused on grammar, another had too many students, and another had an Assistant Language Teacher (ALT) who mainly just talked with the teacher, not the students.
A number were unsatisfied as there was not enough speaking and listening in classes, and too much reading, grammar and exam-related work (5). One interviewee thought he would have tried harder at speaking if it had been a required skill (P14).
P14: The Japanese entrance exam system is really heavily focused on reading, and so, even if there are speaking classes, I don’t know if I really took them seriously. In regard to this, I think it was good that we focused a lot on reading (at high school), but I’d have liked to have done more listening, but listening really doesn’t come up much in the tests. It really was all reading, so the UT entrance exam listening was tough for me.
IV: Right, I see, so in terms of exam preparation, you’re satisfied with the classes?
P14: Well, I’d have liked to have done more listening.
IV: Right, I understand. So, I’d like to just confirm what you said, even if your school had speaking classes, you don’t think they’re necessary for the entrance exam, really.
P14: Yeah, even if my school had speaking classes, it would be a merely formality and the class would not be meaningful, I think.
IV: Right, so you’re motivated to do what you need soon…
P14: Yeah, because high school study really becomes all about entrance exams, yeah.
IV: Right, so if there was a speaking exam…?
P14: Yeah, right, in that case, I think I’d have tried my best.
6 Conclusions
6.1 Summary of findings and their implications
6.1.1 RQ1: Test scores
The findings show that the medium size sample of test-takers from UT was markedly more proficient in reading, and to a lesser extent listening, than writing and speaking. This stark difference between receptive and productive skills was revealed through the use of IELTS. For teachers in Japan or those familiar the context, this finding may not be particularly surprising, though the extent of the difference is noteworthy.
The second key finding was that the Japanese test-takers’ IELTS Speaking scores significantly increased over the period. This finding is similar to that of Humphreys et al. (2012) who also observed a significant increase in speaking scores over one semester in an ESL context. One reason for the increase was that the average speaking score was low and learning gain on IELTS is greater over short periods for those at lower levels of proficiency (Elder & O’Loughlin, 2003; Green, 2005; Humphreys et al., 2012). However, score gain was greatest for speaking compared to other skills, not only for those at the lowest bands, but also for those at the upper-middle-range bands (5.5-7.0). The implication of this is that test-takers at a wide range of initial speaking proficiency levels can increase their speaking scores over relatively short periods and in an EFL context, though still greater gains can be expected at lower bands.
Test-takers did not improve their writing abilities over the period to a similar extent as speaking, even though initial proficiency in writing was similar to that of speaking. One reason may be that writing is potentially the most difficult of the test components, as indicated by slightly lower scores worldwide for the writing component. Other research has also found that increases in IELTS Writing were smaller than most other skills (Craven, 2012; Humphreys et al., 2012). This suggests that gains in IELTS Writing may require more time and effort to achieve than gains in Speaking, even at lower levels of initial proficiency.
6.1.2 RQ2: Predicting factors
It was found that experiential factors such as living and studying abroad and being schooled in English, were predictive of higher scores. It is well known that immersion environments afford greater opportunities for both authentic input and output, which are most likely to lead to improved receptive and productive abilities. However, an interesting point is that experience of attending an English-medium school predicted higher scores in speaking and writing, but not reading or listening. This indicates that such environments allow learners to develop their productive abilities, as measured by IELTS, whereas Japanese school environments primarily afford the opportunity to develop receptive abilities. This finding is consistent with other findings in this study.
Interestingly, reading scores were not explained by any of the variables considered, most probably because of a ceiling effect. In other words, participants were almost uniformly highly skilled at reading, gaining high scores on the test and thus leaving little variance to be explained by other factors. The fact that test-takers were so skilled at reading is undoubtedly due to their extensive preparation for the university entrance exam.
Motivation to study writing following the first test predicted higher overall, writing and speaking scores on the second test. Thus, experiencing IELTS apparently raised test-takers’ awareness of their writing ability, which led to a greater motivation to study writing, and this appeared to be a driving force behind higher scores on the second test. High scorers within the group of test-takers whose writing scores increased also had high motivation to study writing following Test 2. This provides a further indication that the initial IELTS test helped to generate motivation, which subsequently led to higher scores. A relationship was also found between writing and speaking: a group of 13 test-takers who scored highest on the speaking among those whose scores increased, reported being highly motivated to study writing. Thus, it seems that test-takers who were motivated to produce English in written form also improved at producing English in spoken form.
Spoken fluency practice was shown to be a key predictor of higher scores on speaking tests: when test-takers actually practiced speaking spontaneously, they improved their ability to speak and, thus, achieve higher scores on the IELTS test. This is a key finding that relates to the relatively low speaking ability of the sample: test-takers had had little opportunity to practice speaking, and so their level was low, but once they actually practiced speaking, they improved measurably. Importantly, the IELTS test provided an incentive to practice speaking, which led to this improvement. Another finding was that those who practiced spoken fluency also improved their listening scores, which may be explained by the fact that speaking spontaneously may often be done with an interlocutor, which requires the ability to listen. Again, it is interesting to observe these relationships across skills.
Studying test techniques was only important for predicting Test 1 scores (overall and writing). In other words, studying the format of the test helped test-takers to achieve higher scores on the first test, but this strategy did not influence higher scores on Test 2. For Test 2, the amount of preparation for writing predicted higher writing scores, indicating that those who studied writing extensively for the second test got higher scores. This is also most likely tied to the fact that written fluency had not been adequately developed during pre-tertiary education, at least when it comes to tasks such as those on the IELTS test. Taken together, it is suggested that the IELTS test can create positive washback by leading test-takers towards study habits that promote writing ability (i.e. actually practicing writing).
6.1.3 RQ3: Washback and learning situations
Important findings were made from survey and interview data regarding washback from the IELTS test and the university entrance exams, and about university English education. Pre-tertiary education in Japan is heavily focused on exam preparation. The test-takers that attended cram school did so to study for the UT exam. At high school, exam preparation varied and was primarily for the NCUEE exam, though some interviewees reported that they used past papers for UT and other university exams. In line with the skills focus of the NCUEE and UT exams, test-takers reported that their pre-tertiary education was primarily focused on reading, writing and listening. Classes focused on grammar, vocabulary and translation, and at cram school particularly, test techniques. High school had minimal focus on speaking, pronunciation and spoken fluency, and these were near non-existent in cram schools. Classes tended to be teacher-centred with little communication in English by teachers and students and largely individual work. Students were motivated to study receptive skills and writing, but not speaking, and perceived development followed this pattern, too.
All of these findings, taken together, suggest washback from the NCUEE and UT entrance exams, particularly at cram school where the alignment of class content and test content is unparalleled. The implication of the findings is that washback is engineered through the NCUEE and UT entrance exam, and influences, to some considerable extent, the type of activities, study focus, motivation and perceived development that learners will experience. This washback effect coincides with the IELTS test results and explains why students were so much better at reading and listening than writing and speaking.
University education was not test-focused and was reported to involve more speaking opportunities than pre-tertiary education, perhaps due to the greater number of English-speaking faculty at the university. There was a greater amount of group work, less teacher-centredness, and more communication between students and teachers in English. However, reading was still considered to be the primary focus and in-class speaking activities were widely criticised as not being useful for developing learners’ spoken fluency. Test-takers were the least satisfied with their English education at university, compared to high school and cram school. It seemed that this reflected a discord between learners’ wants (speaking- and writing-focused classes, less academic) and the present courses offered (reading-focused classes, unsatisfactory speaking and writing tasks, too academic). It is interesting that some interviewees mentioned how class activities did not lead to development of fluency in productive skills as required for the IELTS test.
This observation highlights the connection between tests and teaching: good tests should be ones that can be used as materials in class, because the tasks in them foster positive language learner behaviour and development. Messick (1996), for instance, suggests that “for optimal positive washback there should be little, if any, difference between activities involved in learning the language and activities involved in preparing for the test” (pp. 241-242). The IELTS test could thus serve as a useful tool with which English education faculty can evaluate their in-class activities and assignments as to whether the tasks students do in class are developing the same skills necessary to improve on a measure of academic spoken English proficiency.
The IELTS test had observable effects on students’ study habits, motivation and perceived development. A number of test-takers prepared for the first test by studying mainly receptive skills, for strategic reasons. However, following the first test, they became aware of their abilities and focused more on productive skills. Students almost invariably stated that they wanted to improve their productive skills, particularly speaking, following the first test. In line with this, test-takers practiced speaking spontaneously (alone or with others) and practiced writing more, while also practicing test techniques and grammar less, for the second test. All of these findings indicate washback effects on study habits while preparing for the second IELTS test. This washback can also be seen in terms of motivation to study productive skills, which increased after both the first test and second tests. In line with the increased focus on, and motivation to study, productive skills, was an increase in perceived development in these skills. In other words, the findings reveal positive washback on test preparation, motivation and perceived development of productive skills. In addition, following the second test, test-takers were more motivated to study receptive skills as well, indicating increases in motivation to study all skills following experience of the tests.
Importantly, even though some test-takers reported practicing skills more and many reported being motivated to study, the majority of test-takers did not study extensively for either of the two IELTS tests. This was because the tests were provided free of charge, only half of test-takers were definitely planning to study abroad and because they were busy with their other university study. Thus, the positive washback effects on test preparation were limited to those who actually studied.
In contrast, the effects on motivation to study were more broadly observable. What this means is that, if the test-takers had more incentive to study for the tests, for example, if the test was perceived to be as important as a university entrance exam, the positive washback effects would without doubt apply to a much greater proportion of test-takers.
The interviews also highlighted a number of salient points regarding test-takers’ beliefs about how to study English language. Test-takers were generally confident in the receptive skill components of the tests, having studied them intensively for the entrance exams. Thus, in terms of knowing how to study such skills, they were confident; they were also successful as indicated by the test scores. When it came to productive skills, however, a different picture emerged. Many test-takers did not study for the exams by actually practicing speaking or writing: instead, they read about the tests using study guides. They also tended to believe that studying productive skills was not possible without a partner (i.e. someone to correct their writing or act as an interlocutor).
They thought that it was difficult to study productive skills and, in some cases, said that they did not know how to study them. Test-takers also observed differences in the IELTS Speaking and Writing components and other tests, such as EIKEN, which led them to believe IELTS was more challenging and more difficult to prepare for.
The implication of these findings is clear: because of a lack of experience in studying and practicing productive skills, more test-takers were unsure about how to prepare for the test. They lacked experience and, thus, autonomy in learning productive skills as a consequence of pre-tertiary education that focuses on developing receptive abilities. A similar lack of personal agency and strategic action was noted by Mickan and Motteram (2009) in their survey of IELTS test-takers in Australia. The resonance between these two studies is important because, in both cases, the participants were not enrolled in preparation courses of the IELTS test and were preparing independently. In such contexts, it appears that guidance in how to study productive skills is particularly important.
6.2 Limitations
Washback is a complex phenomenon that is mediated by many factors, and this study, like all washback studies, has a number of limitations. Firstly, it is important to clarify the generalisability of the findings. It is a common belief among some educators in Japan that students at UT are special as it is the most prestigious university in Japan. While UT students are undoubtedly academic high-achievers, it was shown that there is considerable variation in their English experience, abilities and motivation. Moreover, it is interesting that most of the results presented here could intuitively be applied to other many university populations in Japan, especially those that require higher levels of English ability for admission. For example, it is likely that the imbalance in receptive and productive skills exists, though test washback may vary depending on the difficulty of the entrance exams and the level of the students’ English.
Secondly, as Alderson and Wall (1993) have argued, classroom observations are essential to offer empirical support to survey and interview data about classroom practices and any potential washback effects. Others have similarly indicated that teacher factors should be central to any model of washback (Burrows, 2004), not least because studies have shown that, while tests can influence content of language courses, they are less influential on teachers’ beliefs and the methodologies they employ (e.g. Watanabe, 1996, 2004). In the present study, classroom observations and teacher interviews were not conducted, and thus washback effects could only be examined on the basis of test-takers’ scores, survey and interview responses. However, the overlap between the survey and interview data, along with the test data, provides strong support for washback effects from the IELTS test, as well as the university entrance exams. Moreover, given that preparation for IELTS was done independently, such observations would seem infeasible in any case.
Thirdly, the retrospective nature of the survey and interview questions may affect the accuracy of the data. It is certainly possible that respondents’ recall of previous educational environments, over the past four years, is partial and at times inaccurate. However, the agreement statements were almost always general and impressionistic (e.g. ‘I studied a lot of speaking’) and such impressions are likely to be retained longer in memory than highly specific information. Moreover, interviewees were largely confident in their ability to recall general information about their past educational experiences, which lends support to the reliability of the data.
Finally, test-takers did not take identical versions of the IELTS test during each testing period. Therefore, variance associated with individual tests could not be accounted for. In previous work, such as Green (2007a, 2007b), the entry and exit tests were linked, meaning that the actual tests (identifiable by test number) could be identified and any variance associated with the tests themselves could be accounted for. However, this was not possible in the present study due to logistical factors.
6.3 Recommendations
As a four skills test of English language proficiency, IELTS has the potential to raise awareness of differences in receptive and productive abilities. It also can serve as a motivational tool to push test-takers to better develop the skills that they are currently weaker in. As the speaking and writing components require test-takers to use accurate, fluent and complex language in order to gain high scores, the tasks are extremely challenging for Japanese students who tend to focus much less on these skills, and particularly spoken and written fluency. In other words, the test has significant potential to create positive washback on learning in the Japanese tertiary context.
It is possible to recommend IELTS as a useful tool for Japanese universities for a number of reasons.
- It raises awareness of language abilities in the four skills, particularly in productive skills, and particularly regarding spoken and written fluency.
- It can highlight discrepancies between speaking activities in university classes and the type of abilities required in the Target Language Use domain (i.e. abilities required for success on IELTS Speaking tasks).
- It leads to positive washback on writing and speaking skills.
- It leads to increased motivation to study productive skills, and to study English in general.
- It provides a means to attend English-medium institutions, to study abroad, and to fulfil visa requirements.
References
- Alderson, JC, and Wall, D, 1993, ‘Does washback exist?’ Applied Linguistics, vol 14 (2), pp. 115-29.
- Bachman, LF, and Palmer, AS, 1996, Language testing in practice. Oxford: Oxford University Press.
- Brown, JD, 2001, Using surveys in language programs. Cambridge: Cambridge University Press.
- Burrows, C, 2004, ‘Washback in Classroom-Based Assessment: A Study of the Washback Effect in the Australian Adult Migrant English Program’. In Eds, L Cheng, and Y Watanabe, and A Curtis, Context and method in washback research: the influence of language testing on teaching and learning, pp. 113-128. Hillsdale, NJ: Lawrence.
- Erlbaum, Cheng, L, 1997, ‘How does washback influence teaching? Implications for Hong Kong’, Language and Education, vol 11, pp. 38-54.
- Cheng, L, 2014, ‘Consequences, Impact and Washback’. In Ed AJ Kunnan, The companion to language assessment: Evaluation, methodology and interdisciplinary themes, pp. 1130-1145. Singapore, Wiley Blackwell.
- Craven, E, 2012, ‘The quest for IELTS Band 7.0: Investigating English language proficiency development of international students at an Australian university’, IELTS Research Report Series, vol 13. IDP: IELTS Australia and British Council.
- Dörnyei, Z., 1998, ‘Motivation in second and foreign language learning’, Language Teaching, vol 31 (3), pp. 117-135.
- Dörnyei, Z, and Taguchi, T, 2009, Questionnaires in Second Language Research: Construction, Administration, and Processing, 2nd ed. London: Routledge.
- Elder, C, and O’Loughlin, K, 2003, ‘Investigating the relationship between intensive English language study and band score gain on IELTS’. In Ed R Tulloh, IELTS Research Reports, vol 4, pp. 207-254. Canberra, Australia: IELTS Australia Pty Limited.
- Gosa, CMC, 2004, Investigating Washback: A Case Study Using Student Diaries, Unpublished PhD thesis. Department of Linguistics and Modern English Language, Lancaster University. Lancaster: England.
- Green, A, 2005, ‘EAP study recommendations and score gains on the IELTS Academic Writing test’, Assessing Writing, vol 10, pp. 44-60.
- Green, A, 2007a, ‘IELTS washback in context: preparation for academic writing in higher education’. Studies in Language Testing 25. Cambridge: Cambridge ESOL/ Cambridge University Press.
- Green, A, 2007b, ‘Washback to learning outcomes: a comparative study of IELTS preparation and university pre-sessional language courses’. Assessment in Education: Principles, Policy & Practice, vol 14 (1), pp. 75-97.
- Henrichsen, LE, 1989, Diffusion of innovations in English language teaching: The ELEC effort in Japan, 1956-1968. New York: Greenwood Press.
- Hothorn, T, and Everitt, BS, 2014, A Handbook of Statistical Analyses using R, 3rd ed. Boca Raton, Florida: USA, CRC Press.
- Hothorn, T, Hornik, K, Strobl, C, and Zeileis, A, February 2015, Package ‘party’: A Laboratory for Recursive Partytioning Version 1.0-20, Available from: http://party.R-forge.R-project.org
- Hothorn, T, Hornik, K, and Zeileis, A, 2006, ‘Unbiased Recursive Partitioning: A Conditional Inference Framework’. Journal of Computational and Graphical Statistics, vol 15 (3), pp. 651-674.
- Hughes, A, 2003, Testing for language teachers. Cambridge: Cambridge University Press.
- Humphreys, P, Haugh, M, Fenton-Smith, M, Lobo, A, Michael, R, and Walkinshaw, I, 2012, ‘Tracking international students’ English proficiency over the first semester of undergraduate study’. IELTS Research Reports Online Series, no. 1. IDP: IELTS Australia and British Council.
- Messick, S, 1996, ‘Validity and washback in language testing’. Language Testing, vol 13, pp. 241-256.
- MEXT, 2011, Koutou gakkou gakushu shidou kouryou eiyakuban [High school course of study; Section 13: English], retrieved from http://www.mext.go.jp/, last accessed 15 July 2015
- Mickan, P, and Motteram, J, 2009, ‘The preparation practices of IELTS candidates: Case studies’. In Ed, J Osborne, IELTS Research Reports, vol 10. IDP: IELTS Australia and British Council, pp. 223-262.
- O’Sullivan, B, and Weir, CJ, 2011, ‘Test development and validation’. In Ed, B O’Sullivan, Language Testing: Theories and Practices, pp 13-32. Basingstoke: Palgrave Macmillan.
- R Development Core Team, 2013, ‘R: A Language and environment for statistical computing, version 3.0.2.’, Vienna, R Foundation for Statistical Computing, retrieved November, 2014, from http://www.R-project.org
- Shih, CM, 2007, ‘A new washback model of students’ learning’. Canadian Modern Language Review vol 64(1), pp. 135-162.
- Strasser, H, and Weber, C, 1999, ‘On the asymptotic theory of permutation statistics’. Mathematical Methods of Statistics, vol 8, pp. 220-250.
- Wall, D, 1996, ‘Introducing new tests into traditional systems: Insights from general education and from innovation theory’. Language Testing, vol 13, pp. 334-354.
- Watanabe, Y, 1996, ‘Does grammar translation come from the entrance examination? Preliminary findings from classroom-based research’. Language Testing, vol 13, pp. 318-333.
- Watanabe, Y, 1997, Nyushi kara eigo o hazusu to jugyo wa kawaru ka [Will elimination of English from the entrance examination change classroom instruction?] Eigo kyoiku [English teachers magazine], September, special issue. Tokyo: Taihukan shoten. pp. 30-35.
- Watanabe, Y, 2004, ‘Teacher factors mediating washback’. In eds, L Cheng, Y Watanabe, and A Curtis, Context and method in washback research: the influence of language testing on teaching and learning, Hilsdale, pp.129-146. NJ: Lawrence Erlbaum.
- Weir, C J, 2005, Language Testing And Validation: An Evidence-based Approach, London, Palgrave Macmillan.
- Xie, Q, 2013, ‘Does Test Preparation Work? Implications for Score Validity’. Language Assessment Quarterly, vol 10 (2), pp 196-218.
- Xie, Q, and Andrews, S, 2012, ‘Do test design and uses influence test preparation? Testing a model of washback with structural equation modeling’. Language Testing, vol 30 (1), pp 49-70.
- Zhan, Y, and Andrews, S, 2014, ‘Washback effects from a high-stakes examination on out-of-class English learning: insights from possible self theories’. Assessment in Education: Principles, Policy & Practice, vol 21(1), pp 71-89.
Appendix 1: Survey questions
| Item | Used for RQ2 | Question | Subcategories | Answer choices |
|---|---|---|---|---|
| Informed consent agreement | ||||
| 1 | Informed consent agreement questions | I understand the purpose: I understand that I’m expected to complete this survey as I received two university/government-funded proficiency exams: I understand no personal information will be distributed to any third party | Yes/No | |
| Japanese language history (this and following Qs only if ‘No’ to previous Q) | ||||
| 2 | Confirm: I am a Japanese native speaker, spoke to my family in Japanese and had all of my education until now in Japanese | N/A | Yes/No (If YES, jump to Bilingual Status section) | |
| 3 | Self-rated Japanese proficiency | N/A | 0-8 (0=no proficiency, 8=native speaker) | |
| 4 | Select age range when you started learning Japanese | N/A | 0-2, 3-5, 7-12, 13-16, 16+ | |
| 5 | Number of years schooled in Japanese | N/A | None, <1, 1-2, 3-4, 4-5, 5-6, 6+ | |
| 6 | Number of years living in Japan | N/A | None, <1, 1-2, 3-4, 4-5, 5-6, 6+ | |
| 7 | Additional comments about Japanese language learning history (optional) | N/A | Free response | |
| Language history | ||||
| 8 | Which languages do you use regularly and what proportion of your daily life do you currently use these languages? | Select language 1: Select language 2: Select language 3 | 1. Yes, (write the name of language)/No: 2. Add up each language % to 100% | |
| 9 | Have you studied any other language(s) but do not use them regularly? | N/A | Yes / No | |
| 10 | If yes, to (9), indicate the language and your proficiency in that language. | Select language 1: Select language 2: Select language 3 | Select proficiency level: Advanced, Upper Intermediate, Lower Intermediate, Elementary | |
| English language learning history | ||||
| 11 | Age started learning English, | N/A | 0-2, 3-5, 7-12, 12-16, 16+ | |
| 12 | Yes | Have you lived in an English-speaking country? | N/A | Yes, No |
| 13 | Yes | If yes (12), how long did you live abroad? | N/A | Months (1-12), Years (1-21+) |
| 14 | Yes | As a child did you live with a relative, guardian or other close relation who could have a conversation in English? | N/A | Yes, No |
| 15 | Yes | If yes (14), how long? | N/A | Months (1-12), Years (1-21+) |
| 16 | Yes | Have you been taught in a school where the main language of instruction was English (either in Japan or abroad)? | N/A | Yes, No |
| 17 | Yes | If yes (16), how long? | N/A | Months (1-12), Years (1-21+) |
| 18 | Yes | Have you ever been taught other subject classes (e.g. math, science) in English? | N/A | Yes/No + name/ type of class |
| 19 | Yes | If yes (18), was this before or after university? | Before university, after university | Yes, No |
| 20 | Yes | Did you participate in any of the following extra-curricular English learning before coming to Komaba? | Conversation school, English club, other | No, Yes <1yr, 1-2yr, 2+yrs |
| 21 | Yes | Did you participate in any of the following extra-curricular English learning while at Komaba? | Conversation school, English club, other | No, Yes <1yr, 1-2yr, 2+yrs |
| 22 | Have you ever taken TOEIC, TOEFL, EIKEN? What was your score? | N/A | Yes / No + Free response | |
| 23 | Additional comments about your English language history (optional) | N/A | Free response | |
| 24 | Yes | Did you study English abroad before coming to Komaba? | N/A | Yes / No |
| 25 | Yes | If yes (23), how long and what % of time did you spend speaking English? | N/A | <1mth, 1-6mths, 7mths-12mths, 1-2yrs, 2+yrs: 6-scale answer: All, most, over half, less than half, not at all, don’t remember |
| 26 | Yes | Did you study English abroad while at Komaba? | N/A | Yes / No |
| 27 | Yes | If yes (23), how long and what % of time did you spend speaking English? | N/A | <1mth, 1-6mths, 7mths-12mths, 1-2yrs, 2+yrs: 6-scale answer: All, most, over half, less than half, not at all, don’t remember |
| 28 | Yes | Do you want to study abroad while at university? | N/A | Yes, maybe, no |
| 29 | Why do you want to study abroad? | Learn EAP/specialist English, improve speaking skills, learn about culture, learn general English, study my subject in English | Select all that apply | |
| IELTS preparation and results (Test 1, Test 2) (* Items repeated for Test 2) | ||||
| 30 | Did you take IELTS in the past, prior to the first test at Komaba? | N/A | Yes / No | |
| 31 | If yes (29), what was your score? | N/A | Free response | |
| 32 | Why did you decide to take the IELTS test? | Wanted to know about IELTS / Because it was free / Want to study abroad / Want certificate for work/other / Other | Select all that apply | |
| 33/39 | Yes | *In preparation for the first/second test I studied mainly ____. | S/R/W/L | Strongly agree- Strongly disagree |
| 34/40 | Yes | *How many hours did you study for the test? | N/A | 0, <20, 20-40, 40-60, 60-80, 80-100, 100+ |
| 35/41 | Yes | *In preparation for the first/second test I spent a lot of time ____. | Reading texts then answering questions, Listening to monologues/conversations between two people then answering questions, Listening to conversations between more than two people then answering questions, Asking/answering questions about familiar topics with a partner, Presenting ideas on a familiar topic to a partner/group, Discussing abstract ideas and topics in pairs/groups, Writing a paragraph to summarize information from a chart or table, Writing an essay: other (free answer) | Strongly agree-Strongly disagree |
| 36/42 | Yes | *I practiced speaking immediately with little or no preparation time. | N/A | Strongly agree-Strongly disagree |
| 37/43 | Yes | *My preparation activities focused a lot on ____. | Pronunciation, Grammar, Lexis | Strongly agree-Strongly disagree |
| 38/44 | Yes | *Overall, I studied test-taking techniques a lot. | N/A | Strongly agree-Strongly disagree |
| 45 | Yes | Did you attend (one or more of) the British council (IELTS) preparation courses? | N/A | Yes / No |
| 46 | Yes | Did you use the British Council website? | N/A | Yes / No |
| 47 | Yes | Did you receive additional tuition for your tests? | N/A | Yes / No |
| 48 | Yes | If yes (40), where? | Cram school, conversation school, personal contact, other | Select all that apply |
| 49/51 | Yes(Only T2) | After the first/second test I was motivated to practice more ____. | Reading, listening, writing, speaking | Strongly agree-Strongly disagree |
| 50/52 | Overall, after the first/second test, I think my proficiency increased a lot in ____. | S/R/W/L | Strongly agree-Strongly disagree | |
| English study at university *Item repeated for cram school and high school | ||||
| 53 | What is your major/route at University of Tokyo? | Sci1, 2, 3: Hums 1, 2, 3 | ||
| 54 | Which courses did you take during semester 1? | KyouyouEigo, Aless/a, Eng2R, IC | Select all that apply | |
| 55 | Which courses did you take during semester 2? | KyouyouEigo, Aless/a, Eng2R, IC, S1 | Select all that apply | |
| 56 | Which courses did you take during semester 3? | Eng2C, IC | Select all that apply | |
| 57 | Which courses did you take during semester 4? | IC | Select all that apply | |
| 58/79/98 | *Overall, I spent a lot of time working in ____. | Pairs, groups, individually | Select one | |
| 59/80/99 | *Overall, my teachers talked for almost all of the class. | N/A | Strongly agree-Strongly disagree | |
| 60/81/100 | *My teacher(s) spoke mainly in English. | N/A | Strongly agree-Strongly disagree | |
| 61/82/101 | *I used English most of the time when speaking to the teacher. | N/A | Strongly agree-Strongly disagree | |
| 62/83/102 | *I used English most of the time when speaking to other students during classes. | N/A | Strongly agree-Strongly disagree | |
| 63/84/103 | *How much homework did you do per week? | 1, 2, 4, 6, 8, 10, 10+ | Select one | |
| 64/85/104 | Yes | *My homework often involved ____. | Reading, listening, writing, speaking | Strongly agree-Strongly disagree |
| 65/86/105 | Yes | *Overall, class activities often focused on ____. | Reading, listening, writing, speaking | Strongly agree-Strongly disagree |
| 66/87/106 | Yes | *Overall, I think my proficiency increased a lot in ____. | Reading, listening, writing, speaking | Strongly agree-Strongly disagree |
| 67/88/107 | Yes | *In class speaking activities I was often expected to speak immediately with little or no preparation time. | N/A | Strongly agree-Strongly disagree |
| 68/89/108 | Yes | *The class activities often focused on ____. | Pronunciation, Grammar, Lexis | Strongly agree-Strongly disagree |
| 69/90/109 | Yes | *At ____ I spent a lot of time studying ____. | Reading texts then answering questions, Listening to monologues/conversations between two people then answering questions, Listening to conversations between more than two people then answering questions, Asking/Answering questions about familiar topics with a partner, Presenting ideas on a familiar topic to a partner/group, Discussing abstract ideas and topics in pairs/groups, Writing a paragraph to summarize information from a chart or table, Writing an essay | Strongly agree-Strongly disagree+ Plus optional typed response |
| 70/91/110 | Yes | *Overall, I studied test-taking techniques a lot. | N/A | Strongly agree-Strongly disagree |
| 71/92/111 | *As a result of classes at ____, I spent a lot of time studying speaking. | Reading, listening, writing, speaking | Strongly agree-Strongly disagree | |
| 72/93/112 | *I was satisfied with the courses at ____. | N/A | Strongly agree-Strongly disagree | |
| 73/94/113 | Yes | *I am/have been motivated to study English while at ____. | N/A | Strongly agree-Strongly disagree |
| 74/95/114 | *I am motivated to study English as a result of courses taken at ____. | Reading, listening, writing, speaking | Strongly agree-Strongly disagree | |
| 75 | Why are you studying English at the moment? | Work, education, make friends, postgraduate study, travel abroad, other | Select all that apply | |
| 76 | Please add any further information about what you expect from English courses at Komaba. | N/A | Free response | |
| English study at cram school (Juku and/or Yobiko) | ||||
| 77 | Did you study at cram school? | N/A | Yes / No | |
| 78 | How long did you study at cram school? Which cram school did you attend? | N/A | <6mth, 6-12mth, 12-24mth, 24mth+: Typed response | |
| English study at high school | ||||
| 96 | Which HS did you attend? | N/A | Free response | |
| 97 | What kind of HS was it? | Private super-science, super-English language, other: State super-science, super English language, other | Select one | |
| 115 | Any further information about course at high school? | N/A | Free response | |
| 116 | Any further information about English education/learning experiences before high school? | N/A | Free response | |
| Personal information | ||||
| 117 | Complete your name (in Japanese)*Note on anonymity here. | N/A | Free response | |
| 118 | What is your Student ID? | N/A | ||
| 119 | Yes | How old are you? | N/A | Free response |
| 120 | Yes | Select your gender | N/A | M / F/No response |
| 121 | Input your address if you wish to receive a free 500 yen gift card | N/A | Free response | |
| 122 | Would you like to participate in a follow-up interview? | N/A | Yes / No |
Appendix 2: Sample interview questions
Language study experience
- Tell me about your English study experience at high school / cram school / university.
- Which of the four skills did you focus on at high school / cram school / university?
- What types of activities did you do a lot of at high school / cram school / university?
- Did you do anything to learn English outside of school? How about now?
- Tell me about the English related events inside or outside of class that left a strong impression on you.
IELTS preparation
- Did you study hard for IELTS? Did you prepare enough?
- What did you do? Which skill did you focus on?
- How did you choose what to focus on?
- How did you feel after you took the IELTS test?
- Did you find any differences between IELTS tests and other tests you have taken?
- If you took another IELTS test, which skill would you want to focus on? Why?
Language study goals, motivations and expectations
- What is your motivation to study English?
- What are your goals in learning English?
- Do you want to study abroad in the future? If so, where and why?
- Are you satisfied with your English learning experience so far?
- What would you have liked to have done more of at high school / cram school / university?