
IELTS Writing band scores 5.5–7.5: Grammatical error rates, stakeholder perceptions, and risk
Official IELTS research report on IELTS Test - Writing; Impact and Washback - Performance data of candidates and IELTS; Impact and Washback - Stakeholder attitudes; Impact and Washback - Use of test scores, published in 2022.
Abstract
This study establishes expected grammatical error rates for each IELTS band between 5.5 and 7.5, and investigates stakeholder perceptions of error, management of risk with English testing, and organisational use of IELTS.
Grammatical accuracy is assumed to improve as English skill increases, and similarly, as English language test scores increase, fewer grammatical errors are expected as well. This study set out to establish the minimum grammatical error rates to be expected of eight parts of speech (and their 33 subtypes) for each IELTS half-band score between 5.5 and 7.5. Summary statistics, ratios, and regression were run on the data for the 8 main categories to establish whether significant gains were made at each half-band, and if variation could be seen within the categories for the 33 subtypes. Given that grammatical measures comprise one of four possible dimensions in the IELTS Writing rubric used by assessors, first-language background was explored for any effect on IELTS scores separate to grammatical competence. First-language background was found to have an effect, with significant variation found between grammatical error rates within the same IELTS score for different first-language groups.
Grammatical errors can cause misunderstanding and miscommunication, which in turn can produce negative outcomes in stakeholder environments. A selection of results about error rates and types found in this study were presented to stakeholders to see if it affected their position on minimum IELTS score benchmarks, including their thoughts on how IELTS is used to manage their perceived risk. Some stakeholders felt higher scores were needed, and some were unsure that their current standards were sufficient. There was general consensus that IELTS meets organisational needs.
1 Background
1.1 The IELTS test and stakeholders
The International English Language Testing System (IELTS) was initiated in the late 1980s to test the English communicative ability of overseas students intending to study in Australia (Ahern, 2009), with the specific intention to assess the “readiness to enter the world of university-level study” (Cambridge ESOL, 2004, p 15). Later, IELTS was used for applications beyond its original purpose and became the preferred test to assess communication skills for migration and professional registration (Birrell, 2006), despite its purpose being for higher education readiness (and not professional readiness, as argued by Read and Wette, 2011). Two versions of IELTS are issued: academic and general. This study focuses on the academic version because it is used by university and professional bodies (i.e., that have members who require a university degree).
A stakeholder’s primary reason for using a language test such as IELTS is to establish which candidates have a sufficient level of language skill to successfully interact within their particular communicative context. Stakeholders include organisations which use IELTS scores for entry and registration purposes, such as academia and the professions, that rely on the test to identify the communicative strengths and shortcomings of people coming into their organisation. A sufficient level of language skill is generally understood to mean the candidate can produce and receive written and spoken content with little confusion or misunderstanding occurring for either the sender or receiver. Very high value is placed on grammatical accuracy as a measure of effective writing (Moore, 2015, pp 26-27) and desirable for employment (Knoch et al., 2016, pp 17-18). However, in practice, there is also some room for error-but how much is what we should ask.
An important point to make is that a language test focuses on the level of communicative skill and ability a candidate currently possesses, but on the flip side, anything less than a perfect score means there are gaps in a candidate’s skills and certain aspects of language may need further refinement. To analogise, a person who achieves 75% on a language test also gets 25% of it wrong. Thus, a test is geared to focus on the level of attainment rather than this 25% failure. Even IELTS recognises that candidates will not need a perfect score of 9.0 and suggest scores between 5.5 and 7.5 as being sufficient to commence study (Figure 1), depending on the communicative demands of the situation and if the education is in academic or training contexts, and if the area is linguistically demanding or not (IELTS, 2018). This focus on where the candidate reaches an acceptable level reinforces stakeholders to think in terms of attainment and that ‘close enough is okay’, rather than also thinking in terms of where the deficits lie and what may still need improvement. It might be just as important for IELTS to produce information that also encourages stakeholders to consider the linguistic risk profiles associated with each half-band score below 9.0.
Figure 1: IELTS test score guidance on acceptable scores for educational institutions
| Band score | Linguistically demanding academic courses | Linguistically less-demanding academic courses | Linguistically demanding training courses | Linguistically less-demanding training courses |
|---|---|---|---|---|
| 7.5-9 | Acceptable | Acceptable | Acceptable | Acceptable |
| 7.0 | Probably acceptable | Acceptable | Acceptable | Acceptable |
| 6.5 | English study needed | Probably acceptable | Acceptable | Acceptable |
| 6.0 | English study needed | English study needed | Probably acceptable | Acceptable |
| 5.5 | English study needed | English study needed | English study needed | Probably acceptable |
Stakeholders from non-linguistic domains cannot be expected to have technical knowledge of language learning and testing, and they would have difficulty understanding the complexities of this professional area. Rea and Dickens (2007, p 28) found exactly this problem, that stakeholders did not know much about the IELTS test. Thus, stakeholders may not fully understand what is being tested, nor the nature of the scale used to indicate proficiency. One study indicated that 58% of the stakeholders, when asked if they had a clear idea of English language proficiency after seeing an IELTS score, felt either unsure or disagreed, indicating a lack of knowledge about how the proficiency levels are represented by scores (Coleman et al., 2003, p 182), or perhaps a lack of faith in scoring validity. In regards to understanding the test scale, while language teachers and testers familiar with IELTS know that the jump from a 5.5 to 6.5 represents a large difference in capability, to the layperson the number ‘0.5’ appears to be a fractional difference among a series of whole numbers-maybe if scores were instead 550 and 650, stakeholders might think differently. A difference of 0.5 seems so minor, at least when the nature of the scale is unknown.
This lack of understanding of test results is evident in the many examples of an institution or professional body ignoring the recommendations of IELTS and setting scores for entry into their organisation lower than recommended. Currently, IELTS bands 6.0 and 6.5 are the most common entry scores for both undergraduate and postgraduate study (Hyatt & Brooks, 2009; Smith & Haslett, 2007; Arkoudis, Baik, & Richardson, 2012). These band scores are often below that recommended by the IELTS organisation, and this is a very important point to keep in mind when thinking about the use of IELTS scores by stakeholders. For example, prior to the Australian Nursing and Midwifery Accreditation Council (2019) mandate that all students commencing study must have already met the registered nurse standards for English, nursing courses were accepting students with IELTS 6.0 and 6.5. They ignored the IELTS recommendation of setting an ‘acceptable’ 7.5 score, or even the ‘probably acceptable’ 7.0 score before entry. IELTS 6.0 or 6.5 is listed as the point of ‘English study needed’ before commencing a linguistically demanding course (see Figure 1). Some of the range of scores found among health professionals who took the test for registration purposes can be found in Rumsey et al. (2016).
The setting of low entry scores by educational stakeholders has resulted in a noticeable number of international students struggling with the communicative burden of their degree (e.g., Trenkic & Warmington, 2018) while low professional registration scores mean that workers struggle in their workplaces (e.g., O’Neill, 2011). A great deal of research about both the score setting and validity of IELTS can be found for many countries: for example, Australia (O’Loughlin, 2011; Arkoudis, Baik, & Richardson, 2012), Canada (Golder, Reeder, & Flemming, 2011), New Zealand (Smith & Haslett, 2007), South Africa (Cooper 2013), and the United Kingdom (Hyatt & Brooks, 2009). In a number of these studies, concerns have been raised about the setting of proficiency levels, and how some universities accept entry scores that are too low (O’Loughlin, 2011; Arkoudis, Baik, & Richardson, 2012; Trenkic & Warmington, 2018). Indeed, Arkoudis, Baik, and Richardson (2012, p 33) point out that:
“Poor enrolment processes invoke complexities for institutions in dealing with struggling students and place an enormous burden on institutional staff. This burden can lead staff to regard EAL [English as an Additional Language] students as a problem, derailing institutional efforts at internationalisation and creating tensions between staff and students.”
Unfortunately, when this happens, IELTS is often the focus of attention, rather than the score-setting practices of the stakeholders themselves (O’Loughlin, 2012). This brings to mind the saying of ‘It’s a poor musician who blames their instrument’ since it is up to the stakeholder to set their standards correctly-the validated and reliable IELTS test cannot be faulted for stakeholders’ incorrect usage of it.
It is probably true that stakeholders need better information to help them understand the risk of selecting one score over another. The literature shows there is a need for greater knowledge and understanding about English proficiency testing among those who set the entry levels (Rea-Dickins, Kiely, & Yu, 2010; O’Loughlin, 2011; Arkoudis, Baik, & Richardson, 2012; O’Loughlin, 2013; Coleman et al., 2003). In one study, a participant commented about the disconnect between those who set the English entry levels and those who deal with the consequences of that choice: “My feeling is that Admissions tutors, seeing what a 6.0 looks like, would be more inclined to actually want to up the entry requirement to a 6.5 or a 7…” (Hyatt, 2013, p 853). In another study, it was observed that the English test was only one hurdle, with the final decision coming from later rigorous employment interview procedures instead (Gribble et al., 2016, p 36).
Finding ways to better communicate and present the English abilities of IELTS test-takers to stakeholders is essential. This study seeks to contribute to the knowledge of stakeholder opinion about language testing and the linguistic error profiles of each IELTS half-band. The answer may be something other than presenting only test scores which are difficult to understand, and supplementing scores with a comments section on the strengths and weaknesses of individual test-takers (Gribble et al., 2016, p 31), or communicating linguistic error profiles to stakeholders.
1.2 Risk framework
It should be apparent by now that there is an orientation of this study toward understanding error and risk, and naturally the social theoretical positioning is that we live in a risk society. Risk theory asks how society organises itself in response to either perceived or real risks. This is evident in the use of an entry test to address perceived or real risks being identified. Giddens (1996) considers that, when it comes to risk, the notion of power (i.e., even the definition of risk) is controlled by the ‘expert’ who holds this knowledge. According to Slovic (2007, p xxxvi), the person who controls the risk definition is then able to control the solution of the proposed problem. Currently, this lies in the hands of the stakeholders, and how they interpret and deal with ‘English study needed’.
Risk can depend on decisions that an individual makes (Beck, 1999; Fischhoff, Watson, & Hope, 1984). Beck argues that the definitions of risk are moulded by institutions and cultural contexts, and extending this, policy. Thus, risk is framed by legislation, institutionally defined by the individual and/or interest group, and is inherently socially constructed. Potential risk may or may not manifest itself, despite any predictions made, and this brings about the notion of uncertainty.
Scott, Doughty, and Kahi (2011) extended this idea suggesting that:
”…[w]e cannot do anything about the speed of social change, the increasing inability of politics to restrain the operations of global power, the gradua withdrawal of social safety nets, and the individualisation of responsibility for planning and action.”
Arguably, modern daily life may be no more hazardous or ‘risky’ than for previously eras; rather, it may be just a case of how one views it (Beck, 1997). One might argue against this, saying such comparisons depend on changing context, which causes different new risks which were not a problem in previous times. Once society attempts to control risk in order to provide a future of ‘predictable security’, risk then emerges as a political issue (Beck, 1997). Such societal interventions, like the IELTS test, arose primarily through targeted decision-making. In this way, we would consider the ‘risk society’ to look at the rationalised control of individual risks, and to mitigate such risks through a variety of individual assessments (Elliott, 2002; Scott, Doughty, & Kahi, 2011).
This intrinsic aspect can be thought of as a response to the ever-changing nature that is risk, and has been proposed as a governmental way of imposing order and one way of attempting to manage diversity, or in this case, the needs of the individual, stakeholder, etc. (Moon, 2000).
1.3 Evaluating the relationship of IELTS test scores with real world outcomes
Given that the IELTS test is designed to assess readiness for people of non-English backgrounds to study at university, it may seem a fair question to ask in what ways IELTS test results are related to subsequent performance in academic, training, and professional settings. Many have examined this relationship, as will be outlined soon, but fewer have considered the logical and statistical issues inherent in answering such a question, and these must be briefly addressed before moving onto the studies of effectiveness/appropriacy of IELTS in stakeholder contexts. These issues include correct modelling of IELTS to academic performance, sampling error, issues of language acquisition and maintenance, and poor test literacy among non-experts.
1.4 Relationship of scores to performance
Studies which correlate IELTS to grade outcomes are problematic because a student’s grades are the result of their performance in a specific disciplinary area, such as engineering, nursing, or science topics, not just their ability to speak English. It is entirely implausible that a measurement of communication skills would account for their entire performance in their educational degree. Ideally, language should have no impact at all. However, working on the assumption that a person has insufficient linguistic skills to efficiently engage in receiving and giving information (and that this affects performance), then the main research aims would be to identify the two points at which a failed performance and a successful performance will tend to occur.
In a situation where the point of failure clusters predictably (and in significant numbers), this will be a floor effect. Such a floor effect has been found within vocabulary studies (Trenkic & Warmington, 2018). In the real world, those below the ‘floor’ IELTS score are unlikely to be studying because the person may still be able to undertake simple communicative tasks (e.g., for shopping, using public utilities, and undertaking brief or informal conversation), but they would not be able to engage in complex tasks. As such, their possible academic grades, i.e., very likely to be varying degrees of a fail score, would not be included in any correlation between language to performance, which is a shame because if people below the ‘floor’ scores were included, the strength of the correlation would be increased. Establishing a floor value allows us to interpret the validity of particular test scores in stakeholder settings.
Equally, it is also important to establish the clustered point where communication ability no longer affects, or is not significantly associated with, performance. This would constitute a ceiling effect, which is argued for by Müller and Daller (2019), and observed thus in Woodrow (2006, p 64):
“The analysis indicated that at a lower level of English, the relationship is stronger than at a higher level…Thus, for students scoring 6.5 or lower, proficiency may influence their achievement, whereas with students scoring 7 and above, English proficiency does not influence academic performance.”
The ceiling value, it appears, may be somewhere around 7.0. The ceiling point is likely to be related to the full internalisation of the second language because experts propose that somewhere just before IELTS 7.0, the test-taker starts to think in English rather than make heavy use of translation to communicate (Hogan, cited in Birrell, 2006, p 60; Craven, 2012, p 33).
Thinking in English is important because it relates to cognitive load which is an important consideration not only for language development (Vercellotti, 2017). Heavy reliance on translation means that cognitive capacity is being used for communication rather than processing other content, and thinking in English would free up cognitive load to better engage with course content or professional activities (Terwijn et al., 2012, p 120). As such, after the ceiling score, the task of processing the language used to communicate becomes a secondary issue to understanding the content of what is being communicated. It is important to note again that the IELTS organisation recommends 7.5 as the point of certainty-minimal risk-of language negatively influencing performance in stakeholde settings.
Finally, on the topic of who decides where the floor and ceiling points occur, organisations often do not follow the IELTS recommendation for ‘intensive language courses or activities’-that the person reaches 7.5 before they are allowed to commence linguistically demanding study. This score constitutes, at least in the eyes of expert linguists and test makers, the ceiling score where there is minimal risk that language should pose a problem. Despite this, as mentioned earlier, universities routinely allow students to commence with 6.0 and some professional accrediting bodies allow people with a ‘probably acceptable’ 7.0 to be registered for practice, e.g., as a registered nurse, who will need to deal with a wide range of accents, fast-paced speech, complex written documents, and so forth. In situations outside of education, it is difficult to measure the effect of these stakeholder choices, especially since the risk is managed and language communication problems are smoothed over by teamwork and gaps filled by colleagues.
1.5 Truncation and power
While much research has been done on IELTS and subsequent performance at university, a second serious issue with many studies is that they work with a truncated range of IELTS scores pooling around 5.5-6.5. The reason for this is based on admission criteria: do you admit students only after they have passed the point (ceiling value) where their language will be highly unlikely to be a mediating factor in their success, or do you admit students when they show enough capability to start engaging in their studies but still needing to improve their language skills further while they study (floor value). The choice is often the latter, since students are keen to start studies as soon as possible without spending more money and time on English development, they are logically going to pool around a minimum standard and form a heterogeneous group. For studies that examine students’ academic progress, this limited and truncated range of possible IELTS scores affects any predictive coefficient (Daller & Phelan, 2013).
The interesting point here is that if the whole range of 0-9 IELTS were to be included in a study, and test-takers were immediately placed into a target context (i.e., commence university study), there is no doubt that the significance of the relationship between IELTS and performance would be very high. To explain further, the full range of 0-9 scores and academic scores would theoretically result in either a logarithmic or S-curve scatterplot. This is because a floor value for language skills would result in nearly all fail grades in university performance (e.g. IELTS 4.5 and below), there would be some variation in the intermediate values (e.g. around IELTS 6.0), and after the ceiling value there would be no effect seen in grades because language deficits will no longer impede academic performance (e.g. IELTS 7.5 and beyond). Of course, this problem can be detected through reasoning: if you want to understand the effect of different IELTS scores on grade performance (ignoring that the subject grade indicates how well the student learned a subject rather than their language performance), then you should have a sufficient range of IELTS scores available for comparison and to see the proper distribution, and that is likely to extend beyond just the typical IELTS 6.0-6.5 cluster seen in the population across studies. Finally, on a different note, participant numbers in many studies are often below 100 students, which presents a problem of underpowered analyses.
1.5.1 Some perceptions about what is tested by IELTS
IELTS is a test of broad communicative ability, comprising basic elements, such as grammatical range/skill and vocabulary knowledge, but it also includes other areas such as genre knowledge, management of cohesion and flow, pragmatics, pronunciation, close reading skills, listening to different accents and speed of speech, and so forth. Thus, it is best described as assessing communicative ability and attainment. However, the stakeholder may have a different perspective, and they may assume that IELTS bases its measures on things like the absence of mistakes in grammar, vocabulary, and pronunciation. Grammar mistakes are something stakeholders make repeated mention of when assessing written work (Knoch, 2016, p 24).
The risk-conscious stakeholder would be interested in grammatical errors and poor spoken delivery because these are noticeable problems that can impede communication (e.g., an utterance or sentence not making sense, or interlocutors not being able to understand what words are being spoken). While testing grammar is considered crucial, laypersons (from all language backgrounds) will tolerate errors that do not affect comprehensibility (Sato & McNamara, 2019).
A second assumption that may be held by stakeholders about the IELTS test (at least unconsciously) is that each increment in IELTS score represents equal linear steps in: (1) error reduction and (2) time/effort needed to reach that next increment. This is related to the point made earlier about understanding the scale of the test measurements. Thus, there is a sense that you can make the same gains at higher levels as fast and as easily at the lower levels. Banerjee et al. (2007, p 5) point out the lack of evidence to support uniform language improvement across individuals, between different skill levels, or even specific areas of language. Similarly, Humphries et al. (2012) found slower gains at higher levels of IELTS scores (p 18, 32): it takes more time at higher levels (e.g., IELTS 6.5) to climb IELTS bands than is found at lower levels (e.g., IELTS 3.0). This assumption of equal linearity in stages of improvement may be found among stakeholders, test-takers, and language teachers alike. To explain, there is a rule of thumb that pre-dates IELTS and is often used by English language providers (and by extension, universities), that about half an IELTS band can be gained with 10 weeks of intensive study (200 hours). This is simply not true at the higher levels of proficiency, such as moving from IELTS 6.5 to 7.0, unlike the rapid improvements seen below 5.0 (Green, 2005).
Universities often accept this assumption when allowing time studied to equate to a test score gain (without formally requiring an IELTS retest). Professional bodies also assume that a certain number of years engaged in English-medium study has sufficient equivalence, and a test can be bypassed because there is the ‘natural expected improvement associated with regular use of English. For example, the nursing professional body waives the need for an IELTS test if the candidate has studied for five years continuously at university (Nursing and Midwifery Board of Australia, 2019, p 2). This begs the question: if a person has reached sufficient English skill then why not make sure of this by using an externally validated and objective English test that the person should pass easily? Returning to the idea of study time and test score equivalence, the reality is that progress is slower at higher levels and gains are more easily lost. At this level, people are likely to be learning smaller and nuanced language skills which have a less generalised application, greater contextual constraints, and fewer opportunities for reinforcement of the particular things learned. Even advanced learners are still expanding their vocabulary, morphological knowledge, knowledge of sense and reference, and so forth.
A third assumption is that language proficiency automatically increases when a person is in an English-speaking country. Studies have revealed a different reality. Arkoudis and O’Loughlin (2009) and Craven (2012) found, among students undertaking 1-3 years of study, overall increases of 0.413 and 0.3 of an IELTS band gained during their academic degree (less than half a band was gained on average, in a period of up to three years). This shows that the idea of a person studying their degree being equivalent to studying the English language is flawed and ineffective. Humphreys et al. (2012) found there were gains among 37% of the students over one year, but 41% remained at the same level, and 22% of students had worse scores after their degree ended. Similarly, Craven (2012) found that, after a two-to-three-year degree, for overall IELTS scores, 30% of students showed a full band increase, 35% of students had a half-band increase, 20% of students did not improve at all, and 15% of student dropped by half a band rather than holding steady or improving.
Any assumption that time spent studying is equivalent to an increase in language test scores is deeply problematic. Admittedly, the issue of loss in ability is recognised in policies that set a particular timeframe for the currency of a test score (IELTS FAQ, 2004, p 14), often a maximum of two years (Nursing and Midwifery Board of Australia, 2019, p 4), but the other point about time spent studying as being equivalent to linguistic gains remain.
There are a number of possible outcomes from the above admissions practices. The first outcome is that people will be able to enter a course but may have insufficient language skills to engage fully, so some will struggle or even fail. The second outcome is that people may not have automatically improved their language skills as a part of applied use, because the reality is that dedicated time for language learning and support is needed for improvement, and if they do not engage in this, they cannot move forward. Furthermore, coursework pulls attention away from learning linguistic skills (beyond those which are obviously and immediately necessary to the learner for their communication), so people can be satisfied with having enough skills to ‘get by’ rather than seeking improvement or mastery (which contribute to later safe performance in high stakes environments). The third outcome is that studies examining scores and performance are probably recruiting participants who are mainly sufficient (at the floor level) rather than those who have reached mastery (the ceiling point and above), so the information from such studies, which also informs policy and practice, is flawed.
Now that these points are made, we will turn to the issue of studying and understanding linguistic errors.
2 Linguistic errors
Linguistic errors cause miscommunication. A person’s mastery over the basic grammar of a language is very important to clear communication, and this is particularly evident in speech and writing, and less detected in listening and reading. According to Ferris (2011), “errors are morphological, syntactic, and lexical forms that deviate from rules of the target language, violating the expectations of literate adult native speakers” (p 3). Linguistic errors can have a greater impact in some communicative contexts than others. For example, in nursing, errors regarding verb tense and noun pluralisation (i.e., to indicate when a hand injury occurred, and whether to both hands or what number of fingers) are very important when communicating healthcare treatment, especially within the context of a rapid end-of-shift handover that transfers care responsibilities from one nurse to another. There are other aspects of communication-such as pragmatics, discourse features, nonverbals, and spoken delivery-that are also important when interacting with others, but this study limits its focus to aspects of grammatical error.
This project uses error analysis to understand the patterning of errors for different IELTS scores, and some of the results are later presented to stakeholders. ‘Error analysis’ is the linguistic study and interpretation of errors made by second language learners (Dagut & Laufer, 1982). It benefits researchers and language teachers when combined with learner corpora studies (Granger, 2008) since it provides them with insights into learners actual attested difficulties and the error patterns in their full context. Such a combination of error analysis and learner corpora has given rise to findings of a variety of error types (e.g., Darus & Ching, 2009; Thewissen, 2012). There is a trend for research to examine learners cross-sectionally, i.e., one specific error at a time (e.g., Abe & Tono, 2005; Forsberg & Bartning, 2010; Hawkins & Buttery, 2010). Indeed, a dynamic investigation of all error types at specific levels of language proficiency, as well as the order and rate of the errors, offers a comprehensive and impartial picture of how specific errors develop across levels of proficiency (especially between 5.5-7.5).
The analysis in this study will focus on errors in two structural relationships, i.e., paradigmatic and syntagmatic relationships between the language elements. Paradigmatic errors involve the substitution of correct words with misuses of wrong words of the same category. For example, the misuse of “table” for “tables” (e.g., “I have two table”), or that of “greatly” for “highly” (e.g., “greatly educated”), forms a paradigmatic error. Morphological errors and lexical errors are paradigmatic errors. Syntagmatic errors involve the selection of wrong elements before, or after, a certain element. For example, a syntagmatic error is the wrong word order of SOV as in “I music like”, which is a common mistake found among learners of English as a Foreign Language, such as those with Chinese as their first language instead of the correct SVO order as in “I like music” (see Han, Brebner, & McAllister, 2016). The main aim is to tag and establish patterns of error rates and types across proficiency levels. Nonetheless, structuralism is the linguistic theoretical framework for this study, not only because of the recent return to structuralist studies of language (Matthews, 2001), but also this theory dominates classroom second language teaching in most English as a Foreign Language countries.
As a final note, the study seeks to count only the minimum number of errors, even though a greater range of problems may exist with poor style or genre knowledge. It is true that stylistic improvements increase the readability of a text and contribute to proficient writing; however, some stylistic improvements can be straightforward (for example, transition signalling, variation in sentence structure, paragraphing, and verb tense), but other stylistic recommendations are open to dispute (for example, the use of the comma after an introductory adverb). The advantage of this minimal approach is that only indisputable discrete errors and grammatical problems form the majority of the error count and, as a result, this allows an objective stance to be adopted.
The aim is to find the very basic number of errors that directly affect comprehensibility, regardless of other readability characteristics. The object of analysis, the IELTS Writing Task 2, will now be addressed.
2.1 The IELTS Writing test
The total IELTS Academic Writing Test score comes from a combination of Task 1, which contributes one-third of the marks, and Task 2, which contributes two-thirds of the marks. Writing Task 1 requires the test candidate to write a short description and summary of the information given in a chart, graph, etc. Writing Task 2, the sole focus of this study, requires the test candidate to write, in a longer essay format, their response to a “point of view, argument, or problem” (IDP IELTS, 2021), and they may need to indicate agreement, discuss points of view, evaluate, explain, establish causality, and so on. They must give reasons for their response and are encouraged to include any relevant examples from their own knowledge or experience. The two prompt questions used in this study are as follows, and these are typical examples of questions a test-taker would respond to:
In the modern world, it is no longer necessary to use animals as food or to use animal products for, for example, clothing and medicines. To what extent do you agree or disagree?
In many countries, people like to eat a wider variety of food than can be grown in their local area. As a result, much of the food people eat today has come from other regions. Do you think the advantages of this development outweigh the disadvantages?
The expectation is that a minimum of 250 words will be written by hand-so in terms of this study, bias which is due to non-equivalence arising from minimum text length has been controlled.
This study focuses on Writing Task 2. Academic Writing Task 2 is assessed using a rubric consisting of four dimensions: (1) task response, (2) coherence and cohesion, (3) lexical resource, and (4) grammatical range and accuracy. Performance on each dimension is rated between level 0 (did not attempt) to 9 (highest performance). The fourth dimension of ‘grammatical range and accuracy’ best aligns with the objective measurements conducted in this study, and the band descriptors are given in Table 1. Mayor et al. (2002, p 46) found that error rate was one of the strongest predictors of band score in Writing Task 2. Additionally, some aspects of the second dimension, the ‘cohesion’ aspect of (2) coherence and cohesion, may contribute to a small extent. This may have an effect on the relationship between IELTS score and grammatical errors, similar to Biber et al. (2016) who noted that the grammar represented a focused variable that influenced the larger holistic scores for writing.
As will be discussed again later, ‘grammatical range and accuracy’ and ‘coherence and cohesion’ generally can be considered structural/functional elements, whereas task response and lexical resource generally can be considered content elements. The criterion of grammatical range and accuracy includes sentence-level complexity, clauses, voice, conditionals, and correct use of grammatical parts such as articles, grammatical agreement, prepositions, plurals, and so forth. The criterion of cohesion may involve deictics, pronouns, linking/conjunctive adverbs, etc. (Cotton and Wilson, 2008), and these are marked as errors if the writer uses an erroneous word in its respective grammatical function.
Table 1: Grammatical Range and Accuracy
| Band | Grammatical Range and Accuracy |
|---|---|
| 9 | - uses a wide range of structures with full flexibility and accuracy; rare minor errors occur only as ‘slips’ |
| 8 | - uses a wide range of structures - the majority of sentences are error-free - makes only very occasional errors or inappropriacies |
| 7 | - uses a variety of complex structures - produces frequent error-free sentences - has good control of grammar and punctuation but may make a few errors |
| 6 | - uses a mix of simple and complex sentence forms - makes some errors in grammar and punctuation but they rarely reduce communication |
| 5 | - uses only a limited range of structures - attempts complex sentences but these tend to be less accurate than simple sentences - may make frequent grammatical errors and punctuation may be faulty; errors can cause some difficulty for the reader |
| 4 | - uses only a very limited range of structures with only rare use of subordinate clauses - some structures are accurate but errors predominate, and punctuation is often faulty |
| 3 | - attempts sentence forms but errors in grammar and punctuation predominate and distort the meaning |
| 2 | - cannot use sentence forms except in memorised phrases |
| 1 | - cannot use sentence forms at all |
| 0 | - does not attend - does not attempt the task in any way - writes a totally memorised response |
2.2 Language background factors
The grammatical written capacity of people learning English generally follows a progression of instruction that initially focuses on memorised chunks of phatic communion and simple present verbs and sentence structures involving articles, pronouns, and perhaps pluralisation. In terms of syntax, teaching is often expanded out to include wh-forms, inversion, negation, various embedded clauses (e.g., infinitive clauses) and phrases (e.g., prepositional or adjectival phrases), deictics, voice, linking, cohesion, and genre coherence, etc. Grammatically, the teaching expands into verb tense/aspect, agreement, and so forth. We note that there is a possible trajectory of acquisition that will affect error patterns. Vocabulary acquisition typically dominates in the early stages of language learning. The stage of acquiring the continuous verb forms, plurals, and copula, is often followed by auxiliary and articles, then the irregular past, and finally, regular past, third-person singular, and possessive ‘s’ (Krashen, 1977, cited in Ellis, 2010, p 86; also see Pienemann, 1998). Developmentally, second-language learners progress syntactically from finite dependent clauses to complex noun phrases. One consequence is learners rely syntactically on coordinate clauses, then subordinate clauses, then phrasal elaboration (Halliday & Mathiessen, 1999). These require increasing grammatical flexibility and mastery. Therefore, second-language learners expand “the capacity to use the additional language in ever more mature and skilful ways, tapping the full range of linguistic resources offered by the given grammar in order to fulfil various communicative goals successfully” (Ortega, 2015, p 82). A recent study by Casal and Lee (2019), found that basic-level learners are statistically significant in having lower complex nominal densities, mean length of clauses, and mean length of T-units. Language background might also affect second language writing, as Mayor et al. (2002) found that first language affected Writing Task 2 performance in the areas of complexity, theme, and error. They found that low-scoring Chinese background writers had more errors than Greek scripts (Mayor et al., 2002, pp 7, 10) and used more t-units which meant more themes (Mayor et al., 2002, p 25). Thus, there may be some effect of language background on the error profiles of each IELTS band.
2.3 First language differences in this study
Some level of language interference is present in second language learning, but some first languages are more likely to cause negative cross-linguistic transfers, particularly at the morpho-syntactic level (e.g., Haznedar, 2019). It is of note that all the four first language samples in this study are drawn from English as a Foreign Language settings, albeit with varying degrees of incidental exposure to English. Apart from the competence gap in the L2 between simultaneous and sequential bilinguals, L2 learners who grow up in an ESL country enjoy a greater amount of L2 input. According to the “Poverty-of-Stimulus” theory (Chomsky, 2012; Lasnik & Lidz, 2016), while the quality of the input may play a minor role in the process of language development, there is certainly a difference in the language learning outcomes if there is a big gap in the amount of input. That is to say, in countries with English as an Additional Language, there is a greater chance of a person having a much greater range of incidental English exposure, and this may affect error patterning beyond that of first-language influence.
Four language groups contributed the data in this study, namely Arabic, Chinese, Italian, and Russian, and these were chosen for their typological differences in order to gain a better representation of the range of first languages. First language(s) has been shown to affect progression (Green, 2005) and the types of error that persist in advanced learners (Swan and Smith, 2001). The following is a broad general description adapted from Swan and Smith (2001) of the language features and typical errors made as a result of first language transfer.
2.3.1 Arabic
Arabic has a verb-subject-object structure. Verb forms, nouns, adjectives, and so forth, are typically formed using variations of three consonant bases, and this enables very quick vocabulary acquisition. A series of prefixes and suffixes allow many functions, such as negation and possession. There is no indefinite article, but there is a definite article and a single question tag. There is no copula, no unique modals, no gerund, no phrasal verbs, but there are past, present, and future tenses, but Arabic transition to English is complicated by the L1 lack of infinitival ‘to’ forms. There are active and passive voices. Adjectives follow nouns. There are two genders, and plurals are formed using internal changes to words (however, nouns above 10 take a singular form). Prepositions and particles are numerous, and the verb-prepositions combinations frequently do not match English combinations. Arabic writing runs right to left horizontally, with some word dividers and spaces, and has an alphabet of 28 Arabic script letters.
2.3.2 Chinese
Chinese sentences have a subject-verb-object order, but there is a tendency towards a topicalised subject, i.e., object-lead sentence. Chinese grammar can vary greatly, and the same word form can have many grammatical functions. Chinese has non-inflected verbs which uses adverbials, word order, and context instead to convey meaning. Chinese learners have great difficulty with much of the English verb system, including tense, complements, auxiliaries, modals, mood, and voice. There are no articles in Chinese, rare use of plurals, fewer non-count nouns, and gender pronouns sound the same in speech. There is no inversion for questions, no postmodifiers for nouns, and no phrasal verbs. There is a preference for fronted adverbials. Chinese writing runs right to left vertically, with no dividing spaces between words, and has a non-alphabetic system (functionally, a logo-syllabic system) with at least 8,100 general standard characters or more, using 214 base radical elements.
2.3.3 Italian
Italian sentences often follow a subject-verb-object structure, albeit with many morphological inflections to convey grammatical function. Italian has no gerunds, no auxiliary ‘do’ function, and overextension of ‘have’ and ‘be’. There is difficulty with zero relative pronouns. Italian has a set of negative particles to enforce negation. Italian has many relative similarities to the verb system of English, in comparison to other languages, including some use of phrasal verbs. Italian has both indefinite and definite articles, according to number and gender. Italian has fewer or noncompatible count nouns, and adjectives follow the noun. Italian writing runs left to right horizontally, with spaces between words, and an alphabet of 21 Roman letters.
2.3.4 Russian
Russian sentences can follow a subject-verb-object structure, but it is not unusual to use a verb-subjectobject. Russian achieves its grammar through changes in the structure of words (prefixes, suffixes, inflectional endings), which supports a greater variation in word order. Noun and adjective declension, and verb conjugation, is much more complex than in English. Russian does not have equivalent auxiliary forms for ‘do’, ‘have’, ‘will’, and ‘be’, uses a simpler system of modal verbs, and has no phrasal verbs. It has no perfect or progressive tenses in past, present, or future forms, and there are some issues with a mismatch of forms for voice and conditionals. Russian has no articles, definite, indefinite, or zero, and pronouns pose difficulty. There are three genders for nouns. Russian writing runs left to right horizontally, with spaces between words, and has an alphabet of 33 Cyrillic letters.
2.4 First language narrative and discourse transfer
People from different cultures may have different thought patterns and, therefore, use different narrative structures in communication (Kaplan, 1966), as illustrated in Figure 2 below. This element of communication is being raised because narrative and discourse may affect performance in not only some aspects of the grammatical range used, but also affect scores for (1) task response and (2) coherence and cohesion.
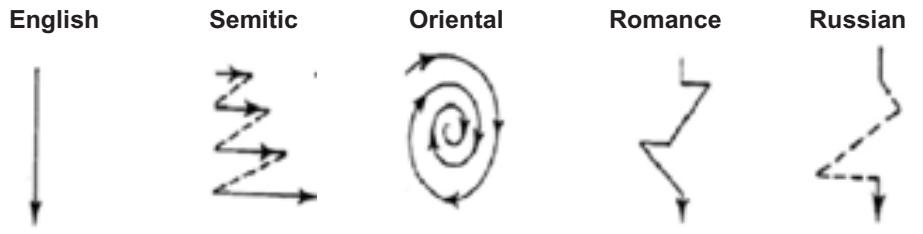
Figure 2: Thought patterns and narrative structures across cultures
Since Kaplan’s research on variations of narrative patterns across cultures, there has been a turn from the contrastive state to an intercultural one (Connor, 1996), but it is agreed that, considering the diverse cultural backgrounds among speakers, (1) texts need to be seen in their contexts with meaningful contextual descriptions, (2) culture needs to be complexified to include disciplinary cultures in addition to national/ethnic cultures, and (3) dynamic, interactive patterns of communication are important to consider, which lead to convergences among cultural differences (Connor, 2018).
Different thought patterns and narrative structures are theorised as reflected through the linguistic characteristics of different languages. Syntactically, for example, while an English sentence usually starts with a non-omittable subject and a straightforward predicate (therefore a ‘subject-prominent’ language, e.g., I hate politics.), a Chinese sentence is inclined to start with a topic and is comfortable with the omission of the subject (therefore a ‘topic-prominent’ language, e.g., Politics (I) hate, Han, 2013).
The different narrative styles employ different cohesive devices. Two main types of cohesive devices are of particular concern in second language development: grammatical cohesion and lexical cohesion. Grammatical cohesion is based on structural content, i.e., how two elements (phrases, clauses, or sentences) are linked to each other through logic. In English, conjunctions (e.g., and, but, or) are the most often used for grammatical cohesion. In other language, Chinese for example, grammatical cohesion is more dependent on the context (or more specifically on ‘co-text’ according to Lyons’ (1977) definition) instead of the functional categories, e.g., conjunction. For example, while English uses ‘and’ to coordinate two words, phrases of the same category, and two sentences, Chinese only uses ‘he’ (and) to coordinate words or phrases, but not sentences. Therefore, a lack of use of ‘and’ as a conjunction of two sentences can be expected for Chinese learners of English.
As for lexical cohesion, anaphoric reference is a key measure to make sure a word or a phrase refers back to other ideas in the discourse for its meaning. Pronouns and determiners are the most frequently used lexical cohesion devices. For example, ‘There is a dog and a cat under the tree. The cat is white. It is playing with a ball.’ Lexical cohesion devices can be different between languages. For example, there is a lack of a definite article in Chinese. The definiteness is implied by the context rather than an overt article. Therefore, omission or misuse of the definite article by Chinese learners of English is expected. The next section will address first language differences and interference in second language production.
2.5 Fossilization and improvement plateaux
The term fossilization is used to refer to the process in which incorrect linguistic features become a permanent part of the way a person speaks and writes a new language, and especially when not learned as a young child (Selinker, 1996). However, fossilization is not a global, system-wide cessation of learning, but is centred on specific linguistic targets (Han, 2009). Recent views of fossilization, however, recognise that interlanguage contains both accurate and inaccurate usage (e.g., Larsen-Freeman, 2006) and is coupled with complex social and psychological contexts (Tarone, 2006). There is no definitive end-state because learning never ends and the status of a person’s language knows no “status quo” since communication is a shifting phenomenon (Larsen-Freeman, 2006, p 195). However, fossilization is often among the final stages of language development, at which point the learner’s mental representation of language ceases to develop. Fossilization is not to be confused with interlanguage, the interim stage of second language development. Negative language transfer, i.e., the incorrect application of the current language structure onto the target language may cause fossilization of interlanguage. For example, subjectless sentences by Spanish learners of English (e.g., Have had pizza) due to the pro-drop nature of their first language (e.g., He comido pizza).
There are two types of fossilization: error reappearance and language competence fossilization (Wei, 2008). Error reappearance happens when the error resurfaces after it has been repeatedly corrected. This happens mostly among early language learners. Language competence fossilization, on the other hand, can be seen as the plateau of L2 development where certain advanced phonological, grammatical, or pragmatic features of the target language stopped developing. This is more often seen among advanced learners.
While advanced learners are generally less subject to fossilization, they are found to produce more skill regressions, i.e., non-target-like forms that had been previously correctly used (Washburn, 1991). Lexical categories (e.g., nouns, verbs, adjectives, adverbs, etc.) have long been assumed to be foundational to language acquisition.
Functional categories (e.g., conjunctions, determiners, pronouns, etc.) have been revealed to play a foundational role in L2 development (Dye et al., 2019), and are the categories most vulnerable to skill regression.
3 RESEARCH QUESTIONS
This study comprises two stages. The first is the empirical identification of error rates and changes, and the second is the stakeholder perceptions of IELTS scores in light of error information presented to them, including their overall opinions about managing risk using IELTS for their organisational purposes. In this study, the IELTS score is the independent variable, and the number, including comparative proportions, of grammatical errors comprise the dependent variable. The first language may be a confounding variable, affecting either/or error counts and error types for each IELTS score, so it is investigated for its possible effect.
The first part of the study asks:
- What are the total errors expected for each half-band?
- How do the main eight error types change according to half-band?
- Are there persistent errors remaining among the 33 error types?
- Do some error types extinguish?
- Do some error types fossilize/plateau?
- Does the first language affect the distribution of errors among IELTS bands?
The second part of the study is qualitative and explores the stakeholder use of IELTS as a risk-management activity where the level of communicative ability is objectively measured and managed.
The research questions are:
- How do stakeholders use the IELTS?
- How do stakeholders manage their risk?
- How does knowledge of error rate and type affect the perception of risk?
4 METHODOLOGY
This is a mixed methods study. The first step involves analysis of error data and is quantitative. The findings of the first step will be used in the second step, which involves a qualitative investigation of stakeholder perceptions of the findings, and then a triangulation of the data/findings and qualitative responses to them will be made. The methodology of the second part of the study is described immediately before the presentation of the qualitative findings in Section 10. Ethical approval was obtained from the host university.
The first part of this study, investigating errors, is quasi-longitudinal in design, i.e., it tracks the development of L2 grammatical features as they are used by candidates at different IELTS half-band levels (different levels of language proficiency) (see Thewissen, 2013). Real test-taker responses to the IELTS Writing Task 2 were collected for this study, sampled by Writing subtest score (not their overall scores) and first language background. Please refer to Section 2.1 for an explanation of the qualities measured in Task 2.
The score range of 5.5-7.5 was selected for two reasons. The first is that the IELTS organisation recommends various scores between 5.5 and 7.5 as the minimum entry competency for different courses and educational institutions, and accordingly many professional, educational, and accrediting bodies use similar scores. The second reason is that candidates between these ranges have some mastery over syntax, and our system of tagging for errors works best where there is a clear syntactic structure to help identify where an error has occurred. Only essays from two question prompts were included, since this limits any bias effect of question type or subject on the response.
It was desirable that four equally distributed first language groups of different typological backgrounds and with little English exposure, such as Chinese, Arabic, and Russian, were cross-sampled in the design. A language that is typologically related to English, Italian, was also included.
An error-tagged learner corpus of 100 essays for each half-band between 5.5-7.5 was built. A set of 125 essays was drawn from four language backgrounds of Arabic, Chinese, Italian, and Russian, contributing 25 essays each for the five bands. Thus, a total of 500 essays form the sample (see Table 2).
Table 2: Sampling
| IELTS Writing Part 2 | Arabic L1 | Chinese L1 | Italian L1 | Russian L1 | Totals |
|---|---|---|---|---|---|
| Band 5.5 | 25 samples | 25 samples | 25 samples | 25 samples | 100 samples |
| Band 6.0 | 25 samples | 25 samples | 25 samples | 25 samples | 100 samples |
| Band 6.5 | 25 samples | 25 samples | 25 samples | 25 samples | 100 samples |
| Band 7.0 | 25 samples | 25 samples | 25 samples | 25 samples | 100 samples |
| Band 7.5 | 25 samples | 25 samples | 25 samples | 25 samples | 100 samples |
| Totals | 125 samples | 125 samples | 125 samples | 125 samples | 500 samples |
The essays were received in handwritten form. These were transcribed into an electronic format for analysis. To enable automatic tagging and analysis in the next step, two researchers manually edited each essay. These editors received preparatory training working on a different dataset of 50 mock IELTS essays. High interrater reliability (Liddy et al., 2011) was achieved through the following actions: use of standardised protocols and forms, extensive training, cross-checking five essays from each band, continuous monitoring of IRR (through group meetings), and a quality improvement feedback mechanism.
The editors used minimal grammatical change principles to make the new text grammatical, even if the quality of writing remained poor, i.e., add or change the least amount of words to become grammatical (this happened most for verbs, determiners, and adding a dummy subject), standardise tense, ensure grammatical agreement, fix pluralisation, fix pronouns, retain original word choice, retain original phrasing, and so forth. This is important to note: where a point of error could have been counted as two or more problems, such as when both a plural error and a verb agreement error co-occurred, only one error was counted (the choice depended on the context, such as the noun being singular elsewhere). This means that the error counts would have been higher if a more comprehensive error correction and counting criterion had been used, especially since this study did not count other related errors to do with punctuation and nonsensical word choice. The error rates in this study represent the ‘best case scenario of grammatical ability, and should be interpreted as a starting point from which actual errors are likely to be higher than we will report.
The next step was to automatically tag the errors using SpaCy tagging software (with modifications to the original software to expand the tagging types), to identify and tag the differences between the original and edited versions of essays. The SpaCy software is a free open-source Natural Language Processor for part-of-speech tagging and other functions (https://spacy.io/). Using the software, each word was tagged with the identification of grammatical parts of speech as the primary aim. Note that there is a slight degree of error in this process, but the software meets the gold standard for tagging corpus linguistic data. The accuracy of SpaCy v2’s part-of-speech tagger is 97.2% (https://spacy.io/usage/facts-figures), which is higher than the 97% inter-annotator agreement or the limit of human consistency on the same task (Manning 2011). The grammatical codes are given in Table 3.
Table 3: Parts of speech
| MAIN ERROR TYPES | SUBTYPES | PART OF SPEECH | DESCRIPTION |
|---|---|---|---|
| NOUN (N_) | NN | NOUN | noun, singular or mass |
| NOUN (N_) | NNP | PROPN | noun, proper singular |
| NOUN (N_) | NNPS | PROPN | noun, proper plural |
| NOUN (N_) | NNS | NOUN | noun, plural |
| NOUN (N_) | NNSP | NOUN | noun, same plural |
| NOUN (N_) | POS | PART | possessive ending |
| VERB (V_) | VB | VERB | verb, base form |
| VERB (V_) | VBD | VERB | verb, past tense |
| VERB (V_) | VBG | VERB | verb, gerund or present participle |
| VERB (V_) | VBN | VERB | verb, past participle |
| VERB (V_) | VBP | VERB | verb, non-3rd person singular present |
| VERB (V_) | VBZ | VERB | verb, 3rd person singular present |
| VERB (V_) | VBMD | VERB | verb, modal auxiliary |
| VERB (V_) | VBTO | PART | infinitival “to” |
| DETERMINER (D_) | DT | DET | determiner |
| DETERMINER (D_) | PDT | DET | predeterminer |
| DETERMINER (D_) | PRP$ | DET | pronoun, possessive |
| DETERMINER (D_) | WDT | DET | wh-determiner |
| DETERMINER (D_) | WP$ | DET | wh-pronoun, possessive |
| PRONOUN (PRN_) | EX | PRON | existential there |
| PRONOUN (PRN_) | PRP | PRON | pronoun, personal |
| PRONOUN (PRN_) | WP | PRON | wh-pronoun, personal |
| ADJECTIVE (ADJ_) | JJ | ADJ | adjective |
| ADJECTIVE (ADJ_) | JJR | ADJ | adjective, comparative |
| ADJECTIVE (ADJ_) | JJS | ADJ | adjective, superlative |
| ADVERB (ADV_) | RB | ADV | adverb |
| ADVERB (ADV_) | RBR | ADV | adverb, comparative |
| ADVERB (ADV_) | RBS | ADV | adverb, superlative |
| ADVERB (ADV_) | WRB | ADV | wh-adverb |
| PREPOSITION (PRP_) | IN | ADP | preposition |
| PREPOSITION (PRP_) | RP | ADP | adverb, particle |
| CONJUNCTION (C_) | CC | CONJ | coordinating conjunction |
| CONJUNCTION (C_) | SC | CONJ | subordinating conjunction |
5 Analysis
Data were extracted from SpaCy into a comma delineated Excel spreadsheet, and then data cleaning and summary statistics were undertaken using SPSS. The counting system means that null values found in a sample represented either mastery or a non-attempt at that category. Thus, a zero does not just fall along the ‘incorrect/correct’ dichotomy, since it could also mean ‘missing/unattempted’. Zero cells were coded with the following logic:
- a correct use + no incorrect use (or vice versa) = a 0 value was retained in the cell
- no correct use + no incorrect use = a missing code entered into the cell
Errors counts were summarised by 8 main types, 33 subtypes, and by first language group. Errors of a “potential occasion analysis” basis were used, i.e., errors of a specific type will be counted in relation to the number of times a learner could potentially have committed such an error, which offers us a “better reflection of the universe of relevant (error) instances” (Hawkins & Buttery, 2010), and enables ratios to be created. For example, article errors are counted out of the total number of articles used, as the potential occasions for errors. Calculations were made in relation to the total related tokens in the corpus, and error percentages were produced, including averages, for each error type.
The data was not normally distributed, and the attempts at log transformation did no solve the problem, with the plots indicating otherwise and the Shapiro-Wilk value being p > 0.5. While back-transforming was a possibility, count data often has a Poisson distribution and variations such as Negative Binomial regression does well with ill-fitting data to produce both a regression line and an incidence ratio rate. These were used to understand the significance of the confounding effect of language.
6 Distribution of grammatical types across texts
The dataset contained 144,671 words, gathered from the 500 essays comprising bands 5.5-7.5 from four different first-language backgrounds. Before we can understand how important a type of error might be, we must understand how often that type of grammar occurs in the text, e.g., conjunctions are relatively low frequency, so there may be few appearances of such errors too. An error type that does not occur often might be less important than another part of grammar that appears very often. The gravity of the error, however, is a different story, e.g., conjunctions may convey essential information about how what follows it contradicts or agrees with the information presented before it, so then it may be an important error that will cause confusion for the listener. Deciding how important an error is for communication is not the main aim of the study.
The texts had the following proportions of grammatical type, as shown in Figure 3 and Table 4.

Figure 3: Text distribution of grammatical types by IELTS band
Table 4: Distribution of grammatical types by band
| Grammatical Type | 5.5 | 6 | 6.5 | 7 | 7.5 |
|---|---|---|---|---|---|
| Nouns | 25.6% | 25.0% | 26.1% | 26.5% | 25.9% |
| Verbs | 23.8% | 22.6% | 21.8% | 21.4% | 21.7% |
| Determiners | 14.1% | 13.5% | 13.1% | 13.0% | 13.2% |
| Prepositions | 13.5% | 14.9% | 15.4% | 15.5% | 15.0% |
| Adjectives | 8.6% | 9.0% | 9.6% | 10.3% | 10.0% |
| Adverbs | 5.8% | 6.2% | 6.3% | 6.0% | 6.7% |
| Pronouns | 5.1% | 4.9% | 4.2% | 3.8% | 3.8% |
| Conjunctions | 3.5% | 3.7% | 3.5% | 3.6% | 3.7% |
As can be seen from Table 4, the distribution of the grammatical types varies across the different IELTS bands. The basic pattern is that nouns, then verbs, are most prominent. This might seem an obvious finding, since one noun and verb is required to fulfil the roles of subject and predicate in English, with a possible extra noun occupying the object position. Determiners are frequently required before many nouns, so it is expected that they would form the third most common type of grammatical category. The next most common category was prepositions, used for both locating and conveying relationships for the object of the verb (also English has many prepositional phrases).
Verbs, determiners, and pronouns drop in overall proportion for the IELTS 7.5 compared to IELTS 5.5. This observed variation is consistent with the greater clause variety and syntactic complexity of advanced language users. Advanced users may be less dependent on the simple noun and prepositional phrases of beginner users, and they may use more complex phrase and clause structures: as Casal and Lee (2019) observed, more complex nominal densities and mean length of clauses. Furthermore, the increase in adverbs and adjectives, since these are used to build complexity and clarification, is expected at higher levels when there are more dependent clauses and complex normalization. The proportion of verbs should slightly reduce when the sentences integrate the aforementioned structures and become longer. The slight increase in the infrequent conjunctions tends to support this idea of complex coordination.
There is a slight increase in noun use, peaking at 6.5-7.0. Banerjee et al. (2007, p 40) found that, after IELTS 6.0, there is an uptick in the use of high-frequency vocabulary. Practices such as nominalisation at higher levels would also reduce the proportion of determiners, simply because there are more words performing different functions in complex structures. To illustrate, a basic noun phrase comprises one determiner and one noun (i.e., a determiner proportion of 50%), but a more complex form is one determiner, adjective(s), and one noun (i.e., a determiner proportion of <33%).
7 Error-rate findings
7.1 Overall errors
Of the 144,671 words in the dataset, 12,269 contained grammatical errors. The proportion of errors is given in Table 5, sorted according to error rate.
Table 5: Ranked overall error rates, including raw counts
| Grammatical type | Error rate% | Frequency of type in text% | Error raw count totals | Dataset raw count totals |
|---|---|---|---|---|
| Determiners | 12.5% | 13.2% | 2,381 | 19,112 |
| Verbs | 8.8% | 22.0% | 2,795 | 31,792 |
| Pronouns | 8.7% | 4.4% | 557 | 6,421 |
| Prepositions | 8.3% | 15.2% | 1,826 | 21,892 |
| Nouns | 8.1% | 25.6% | 2,983 | 37,010 |
| Conjunctions | 7.5% | 3.7% | 396 | 5,282 |
| Adverbs | 6.7% | 6.3% | 615 | 9,134 |
| Adjectives | 5.2% | 9.6% | 716 | 13,848 |
| Totals | 100% | 12,269 | 144,491 |
For combined error rates among the IELTS bands, the largest number of errors tended to occur for determiners (12.5%) and this is important because they comprise 13.2% of the text (over 2 determiner errors per 20 words written). The next highest were verbs (8.8%) and pronouns (8.7%), which comprise 22% and 4.4% of the text, indicating that the verb errors would still be quite frequent in raw counts (about 1 verb error per 50 words written) compared to pronouns, and verbs may well form more serious errors in terms of indicating the time and so forth. Prepositions (8.3%) and nouns (8.1%) were the next groups following close behind, and combined, these grammatical types comprised 40.8% (15.2% and 25.6%) of the text (3.4 errors per 100 written words). Conjunctions, adverbs, and adjectives had the lowest rates, bottoming out at 5.2%, and these grammatical types together comprised 20% of the text. In summary, taking in the combined data from all bands, the dataset approached 1 error per 10 words (8.5%).
7.2 Error rate by band
It is informative to understand whether the improvement in errors among grammatical types follows a smooth trajectory, or if any holds bigger comparative gains at each increment in IELTS score (see Figure 4). It is clear that there was an overall reduction in average error rates as the band scores increased (see Table 6), and all areas improved between 5.5 and 7.5.

Figure 4: Mean error rate by band
While there was a clear progression of fewer grammatical errors at 7.5 than 5.5, there is a period of mixed regression and improvement found for scores 6.5 and 7.0 where scores jump around unexpectedly. This goes against an assumption that improvement is linear, and points to possible effects of cognitive processes such fossilization, attention deficits, and linguistic restructuring. A graph of IELTS scores 6.0, 6.5, and 7.0 is given in Figure 5, and demonstrates this ‘churn’ of regression and improvement which occur after consistently large drops in error rates recorded at 5.5 and 6.0, with the reduction in error rate resuming again (at least modestly) at 7.5.

Figure 5: Mean error rate by bands 6.0, 6.5, and 7.0
Table 6: Mean error rate by band
| IELTS band | 5.5 | 6 | 6.5 | 7 | 7.5 |
|---|---|---|---|---|---|
| Determiners | 18.7% | 14.2% | 12.8% | 8.0% | 4.7% |
| Prepositions | 16.2% | 10.0% | 8.5% | 7.7% | 5.2% |
| Nouns | 13.2% | 9.9% | 7.7% | 8.4% | 7.3% |
| Verbs | 14.7% | 10.5% | 8.8% | 6.1% | 5.0% |
| Pronouns | 18.0% | 8.3% | 6.7% | 6.0% | 6.0% |
| Conjunctions | 14.3% | 10.1% | 5.7% | 6.3% | 4.7% |
| Adverbs | 14.5% | 7.4% | 7.1% | 5.2% | 3.7% |
| Adjectives | 10.0% | 6.6% | 4.4% | 4.7% | 3.3% |
| Average | 14.8% | 10.1% | 8.3% | 6.0% | 4.9% |
When broken down, the worst rate was 3 errors per 20 words at IELTS 5.5, and the best rate was 1 error per 20 words at IELTS 7.5. Table 6 provides a breakdown of error types according to individual IELTS bands, and Figure 4 graphically demonstrates their relative differences by band. At IELTS 5.5, determiner and pronoun errors occur 1 in every 5 uses, and preposition, verb, conjunction, and adverb errors occur at nearly 3 per 20 uses.
It is interesting to see whether some grammatical types had noticeably larger gains than the others for each band increment. This tells us where the language learner is improving quickest, at least for that level of ability. Graphically, this can be seen in Figure 4, but for ease of comparison, Table 7 shows the percentage point change scores, with the bold cells indicating the greatest gains and bold italics cells showing any backwards movement. The results in this table also seem to confirm the claim made earlier that improvement is less pronounced/occurs more slowly at the higher levels.
Table 7: Change in error rate percentage values between bands
| Change scores | 5.5 to 6 | 6.0 to 6.5 | 6.5 to 7 | 7.0 to 7.5 |
|---|---|---|---|---|
| Nouns | 3.3 | 2.2 | -0.7 | 1.1 |
| Verbs | 4.1 | 1.7 | 2.8 | 1.1 |
| Determiners | 4.5 | 1.4 | 4.8 | 3.2 |
| Pronouns | 9.7 | 1.6 | 0.7 | -0.01 |
| Adjectives | 3.3 | 2.2 | -0.3 | 1.4 |
| Adverbs | 7.2 | 0.3 | 1.9 | 1.5 |
| Prepositions | 6.3 | 1.5 | 0.9 | 2.5 |
| Conjunctions | 4.2 | 4.3 | -0.5 | 1.5 |
| Average drop | 4.7 | 1.8 | 1.8 | 1.5 |
Examining increments between each half band may reveal specific error patterns.
All areas improved considerably between 5.5 and 6.0. The biggest gains among the grammatical types from 5.5 to 6.0, was found for pronouns, adverbs, and prepositions, but their grammatical type comprised 5%, 6%, and 15% of the total words in the 6.0 band, so the wider effect on the text would not necessarily stand out from other types for pronouns and adverbs, but prepositions were be more frequent and thus contribute to the reader’s perception of poor grammar production. There was an even bigger improvement between 6.0 to 6.5 (compared to steps from 5.5 to 6.0) for conjunctions, but these only comprised 4% of the total words in the text. Comparatively, there was a good improvement on nouns and adjectives, and since these comprised 26% and 10% of the text, the improvement would probably be noticeable.
Only at 6.5 to 7.0, do we see some backward movement for three of the categories where error rates get worse for nouns, adjectives, and conjunctions, with these types combined accounting for 39% of the text. This is offset by gains found for verbs, determiners, and adverbs, which comprise 21%, 13%, and 6% of the text, representing a large proportion. Regression in ability, i.e., non-target-like forms that had been previously used correctly, explains the fact there are more functional errors in band 7.0 than in band 6.5. Between 7.0 to 7.5, almost all areas improved, but the biggest gains were for determiners and prepositions, types which represent 13% and 15% of total words. Pronouns essentially flatlined, with a negligible degree of worsening. Thus, in terms of skill regression, band 7.0 performed worse in conjunctions, determiners, and pronouns, the functional categories.
In summary, there was an overall improvement in error rate as IELTS scores increased, but this was an uneven process of change. The movement between 6.5 and 7.0 was the most turbulent, a mixture of slight improvement, stagnation, and slight regression that was not seen in the other bands, which is interesting given the proposition that people start to think in English at around 7.0. A cognitive shift may well be taking place at the expense of accuracy. None of the eight general error types extinguishes, but an examination of percentages of incorrect-to-correct attempts at the 33 subtypes may reveal different outcomes. These are shown in Table 8, where zero values are given in bold and increases in error rate are shown in bold italics.
Table 8: Error by band and grammatical subtype
| Grammatical subtype | 5.5 | 6.0 | 6.5 | 7.0 | 7.5 | Change 5.5 to 7.5 |
|---|---|---|---|---|---|---|
| noun, singular or mass | 13.6% | 11.3% | 8.1% | 7.1% | 5.1% | 8% |
| noun, proper singular | 23.3% | 17.1% | 12.7% | 7.0% | 12.2% | 11% |
| noun, proper plural | 44.4% | 25.0% | 0.0% | 0.0% | 9.1% | 35% |
| noun, plural | 9.4% | 5.9% | 5.4% | 3.6% | 3.5% | 6% |
| noun, same plural | 20.0% | 0.0% | 0.0% | 0.0% | 0.0% | 20% |
| possessive ending | 49.3% | 45.7% | 32.3% | 24.3% | 18.6% | 31% |
| verb, base form | 10.2% | 10.0% | 7.7% | 3.7% | 4.6% | 6% |
| verb, past tense | 37.6% | 37.5% | 16.2% | 19.2% | 6.4% | 31% |
| verb, gerund or present participle | 17.5% | 13.3% | 9.2% | 5.4% | 4.4% | 13% |
| verb, past participle | 12.9% | 8.7% | 7.0% | 2.4% | 4.4% | 8% |
| verb, non-3rd person singular present | 18.1% | 15.1% | 11.7% | 8.6% | 6.1% | 12% |
| verb, 3rd person singular present | 21.1% | 14.6% | 11.8% | 8.9% | 8.6% | 13% |
| verb, modal auxiliary | 8.0% | 4.0% | 3.8% | 2.0% | 1.9% | 6% |
| infinitival “to” | 10.2% | 6.8% | 5.8% | 3.1% | 3.4% | 7% |
| determiner | 19.7% | 15.9% | 14.1% | 10.7% | 8.9% | 11% |
| predeterminer | 3.1% | 8.0% | 7.7% | 0.0% | 0.0% | 3% |
| pronoun, possessive | 7.9% | 4.3% | 5.6% | 3.1% | 4.0% | 4% |
| wh-determiner | 18.6% | 12.4% | 7.8% | 11.6% | 3.0% | 16% |
| wh-pronoun, possessive | 100.0% | 0.0% | 0.0% | 0.0% | 0.0% | 100% |
| existential there | 14.0% | 6.3% | 3.3% | 4.3% | 6.7% | 7% |
| pronoun, personal | 15.1% | 9.2% | 7.6% | 5.9% | 4.5% | 11% |
| wh-pronoun, personal | 22.9% | 14.9% | 7.7% | 9.1% | 10.7% | 12% |
| adjective | 9.1% | 6.3% | 4.6% | 3.8% | 2.9% | 6% |
| adjective, comparative | 5.6% | 5.6% | 3.5% | 4.8% | 3.0% | 3% |
| adjective, superlative | 10.3% | 8.9% | 0.0% | 11.1% | 6.5% | 4% |
| adverb | 12.6% | 7.2% | 6.4% | 4.8% | 2.4% | 10% |
| adverb, comparative | 22.3% | 19.4% | 11.1% | 7.4% | 4.6% | 18% |
| adverb, superlative | 20.0% | 6.7% | 15.4% | 0.0% | 0.0% | 20% |
| wh-adverb | 16.4% | 4.9% | 5.5% | 5.3% | 5.3% | 11% |
| preposition | 13.4% | 10.0% | 8.3% | 5.6% | 4.6% | 9% |
| adverb, particle | 27.9% | 15.8% | 19.5% | 14.8% | 7.4% | 21% |
| coordinating conjunction | 11.8% | 9.8% | 6.7% | 4.3% | 4.2% | 8% |
| subordinating conjunction | 13.3% | 11.7% | 4.4% | 12.0% | 7.5% | 6% |
It emerges that four types of error do extinguish by IELTS 7.0: possessive wh-pronouns, same plural nouns, predeterminers, and superlative adverbs. Zero values are highlighted in bold in Table 8. Basic plural nouns, infinitival ‘to’, comparative adjectives, whdeterminer, adjective, adverb are the next lowest, hovering at around 2-3% of errors at a score of 7.5. Some errors remain persistently high even at 7.5: possessive endings, proper singular nouns, and personal wh-pronouns are 19%, 12%, and 11% respectively, and over half the subtypes sit about 5%-9%.
Of note is that the path of improvement is not always steady. The points where the error rates get worse between bands are shown in bold italics in Table 9, and extinctions are shown in bold. Noticeable increases in error rate between band increments occur a number of times. For 5.5 to 6.0, predeterminers get worse, and for the jump between 6.0 to 6.5, possessive pronouns, superlative adverbs, wh-adverbs, and particle adverbs increase in error rate. Between 6.5 to 7.0, seven increases in errors are seen among more grammatical subtypes and include past tense verbs, wh-determiners, existentia there, personal wh-pronouns, comparative and superlative adjectives, and subordinating conjunctions.
Finally, there are eight increases in error rate in the increment from 7.0 to 7.5, particularly among proper singular and plural nouns, base form and past participle verbs, possessive pronouns, existential there, and personal wh-pronouns. It must be remembered that these error rates have been found in writing, but it also shows the best of what a person can produce, given the time to plan and revise, and it draws attention to the question of how well a person might do in equivalent spontaneous spoken interactions when they do not have the benefit of time and revision before they produce their utterance.
Table 9: Ranked grammatical subtype improvement 5.5-7.5
| Average% incorrect | 5.5 | 6 | 6.5 | 7 | 7.5 | Change 5.5 to 7.5 |
|---|---|---|---|---|---|---|
| wh-pronoun, possessive | 100% | 0% | 0% | 0% | 0% | 100% |
| noun, proper plural | 44% | 25% | 0% | 0% | 9% | 35% |
| verb, past tense | 38% | 37% | 16% | 19% | 6% | 31% |
| possessive ending | 49% | 46% | 32% | 24% | 19% | 31% |
| adverb, particle | 28% | 16% | 20% | 15% | 7% | 21% |
| noun, same plural | 20% | 0% | 0% | 0% | 0% | 20% |
| adverb, superlative | 20% | 7% | 15% | 0% | 0% | 20% |
| adverb, comparative | 22% | 19% | 11% | 7% | 5% | 18% |
| wh-determiner | 19% | 12% | 8% | 12% | 3% | 16% |
| verb, gerund or present participle | 17% | 13% | 9% | 5% | 4% | 13% |
| verb, 3rd person singular present | 21% | 15% | 12% | 9% | 9% | 13% |
| wh-pronoun, personal | 23% | 15% | 8% | 9% | 11% | 12% |
| verb, non-3rd person singular present | 18% | 15% | 12% | 9% | 6% | 12% |
| noun, proper singular | 23% | 17% | 13% | 7% | 12% | 11% |
| wh-adverb | 16% | 5% | 5% | 5% | 5% | 11% |
| determiner | 20% | 16% | 14% | 11% | 9% | 11% |
| pronoun, personal | 15% | 9% | 8% | 6% | 5% | 11% |
| adverb | 13% | 7% | 6% | 5% | 2% | 10% |
| preposition | 13% | 10% | 8% | 6% | 5% | 9% |
| verb, past participle | 13% | 9% | 7% | 2% | 4% | 8% |
| noun, singular or mass | 14% | 11% | 8% | 7% | 5% | 8% |
| coordinating conjunction | 12% | 10% | 7% | 4% | 4% | 8% |
| existential there | 14% | 6% | 3% | 4% | 7% | 7% |
| infinitival “to” | 10% | 7% | 6% | 3% | 3% | 7% |
| adjective | 9% | 6% | 5% | 4% | 3% | 6% |
| verb, modal auxiliary | 8% | 4% | 4% | 2% | 2% | 6% |
| noun, plural | 9% | 6% | 5% | 4% | 3% | 6% |
| subordinating conjunction | 13% | 12% | 4% | 12% | 7% | 6% |
| verb, base form | 10% | 10% | 8% | 4% | 5% | 6% |
| adjective, superlative | 10% | 9% | 0% | 11% | 6% | 4% |
| pronoun, possessive | 8% | 4% | 6% | 3% | 4% | 4% |
| predeterminer | 3% | 8% | 8% | 0% | 0% | 3% |
| adjective, comparative | 6% | 6% | 4% | 5% | 3% | 3% |
7.3 Errors by first language
In this section, we check to see if there are variations in error types and rates by first language. It is possible to be given the same IELTS score yet have different proportions in grammatical errors made: a high score on other aspects of the writing rubric will compensate for a low score on the grammatical component. Language transfer issues may produce differences in how many errors are produced, how they are distributed, and how the other parts of the marking rubric compensate for the IELTS score. First, as before, the proportions of grammar in the text need to be established. Figure 6 and Table 10 shows the different distributions by first language.

Figure 6: Text distribution of grammatical types by first language
Table 10: Text distribution of grammatical type proportions by first language
| Grammatical type | Arabic | Italian | Chinese | Russian | All texts |
|---|---|---|---|---|---|
| Nouns | 25.1% | 24.6% | 26.3% | 26.4% | 25.6% |
| Verbs | 22.6% | 21.4% | 23.0% | 20.9% | 22.0% |
| Prepositions | 15.1% | 15.3% | 14.8% | 15.5% | 15.2% |
| Determiners | 14.4% | 13.9% | 11.3% | 13.4% | 13.2% |
| Adjectives | 9.4% | 10.2% | 8.9% | 9.9% | 9.6% |
| Adverbs | 5.4% | 6.8% | 6.8% | 6.3% | 6.3% |
| Pronouns | 4.2% | 4.3% | 4.9% | 4.3% | 4.4% |
| Conjunctions | 3.8% | 3.5% | 3.9% | 3.3% | 3.7% |
From Table 10 we can see that there is some small variation between the proportion of grammatical types which comprise the whole text. The error rates also show similar variations, as seen in Table 11.
Table 11: Error counts, with total proportions
| Raw errors | Italian | Chinese | Russian | Arabic |
|---|---|---|---|---|
| Nouns | 523 | 875 | 761 | 824 |
| Verbs | 467 | 771 | 658 | 899 |
| Determiners | 307 | 543 | 861 | 670 |
| Pronouns | 111 | 116 | 117 | 213 |
| Adjectives | 150 | 150 | 201 | 215 |
| Adverbs | 112 | 128 | 157 | 218 |
| Prepositions | 284 | 463 | 507 | 572 |
| Conjunctions | 50 | 114 | 108 | 124 |
| Totals errors | 2,004 | 3,160 | 3,370 | 3,735 |
| Total words in text | 36,508 | 38,133 | 34,905 | 36,508 |
| Error proportions | 5.7% | 8.3% | 9.7% | 10.2% |
Table 11 shows that there is quite a lot of difference between the types of error made between first language across their performance between 5.5 and 7.5. Italian speakers seem to have the least amount of error of all the groups, and this is not surprising due to the typological similarities between Italian and English. Thereafter, Chinese speakers did reasonably well, and then Russian and Arabic speakers were the most likely to make grammatical errors. The error rates by first language are given in Figure 7 and Table 12.

Figure 7: Error rate by language and grammar type
Table 12: Error rate by first language
| Mean errors | Italian | Chinese | Russian | Arabic | Error |
|---|---|---|---|---|---|
| Nouns | 6.1% | 8.7% | 8.3% | 9.0% | 8.0% |
| Verbs | 6.2% | 8.8% | 9.0% | 10.9% | 8.7% |
| Determiners | 6.3% | 12.6% | 18.4% | 12.8% | 12.5% |
| Pronouns | 7.4% | 6.2% | 7.8% | 13.8% | 8.8% |
| Adjectives | 4.2% | 4.4% | 5.8% | 6.3% | 5.2% |
| Adverbs | 4.7% | 4.9% | 7.1% | 11.1% | 7.0% |
| Prepositions | 5.3% | 8.2% | 9.4% | 10.4% | 8.3% |
| Conjunctions | 4.0% | 7.6% | 9.3% | 8.9% | 7.5% |
| Average | 5.5% | 7.7% | 9.4% | 10.4% | 8.3% |
Determiners were the most notable problem, except for the Italian speakers, and thereafter, there were considerable issues with nouns, verbs, and prepositions. In terms of percentage point change scores, as given in Table 13 that follows, the negative values indicate a lower error rate across language background, and the values in bold italic indicate higher error rates across language background (when compared to the mean error percentage for all languages). It becomes immediately obvious that Italian speakers are consistently better than the average error rate. Chinese speakers have a mixture of being better than the average in pronouns, adjectives, adverbs, and prepositions, but lower than the average for nouns, verbs, determiners, and conjunctions. Russian speakers are only better than the average for pronouns. Arabic speakers show the worst performance in terms of comparative error rate.
Table 13: Error percentage point variation from mean errors
| Change score | Italian | Chinese | Russian | Arabic |
|---|---|---|---|---|
| Nouns | -1.9 | 0.7 | 0.3 | 1.0 |
| Verbs | -2.5 | 0.0 | 0.3 | 2.2 |
| Determiners | -6.2 | 0.1 | 5.9 | 0.2 |
| Pronouns | -1.4 | -2.6 | -1.0 | 5.0 |
| Adjectives | -1.0 | -0.8 | 0.6 | 1.1 |
| Adverbs | -2.2 | -2.0 | 0.1 | 4.1 |
| Prepositions | -3.0 | -0.1 | 1.0 | 2.0 |
| Conjunctions | -3.4 | 0.2 | 1.9 | 1.4 |
| Average | -2.7 | -0.6 | 1.1 | 2.1 |
For the sake of completeness, Table 14 has been provided to show errors by both first language and grammatical subtype, with the zero values in bold.
Table 14: Error by first language and grammatical subtype
| Average error rate | Italian | Chinese | Russian | Arabic | Average |
|---|---|---|---|---|---|
| noun, singular or mass | 5.9% | 10.5% | 9.8% | 9.9% | 9.0% |
| noun, proper singular | 12.8% | 22.0% | 9.5% | 16.5% | 15.2% |
| noun, proper plural | 14.3% | 0.0% | 14.3% | 11.1% | 9.9% |
| noun, plural | 5.9% | 5.7% | 4.6% | 6.0% | 5.5% |
| noun, same plural | 0.0% | 2.5% | 0.0% | 11.1% | 3.4% |
| possessive ending | 34.6% | 17.8% | 28.7% | 54.6% | 33.9% |
| verb, base form | 5.8% | 7.3% | 7.0% | 8.9% | 7.2% |
| verb, past tense | 22.3% | 29.7% | 14.3% | 26.8% | 23.3% |
| verb, gerund or present participle | 5.5% | 10.9% | 11.3% | 11.3% | 9.8% |
| verb, past participle | 3.8% | 6.0% | 8.4% | 9.8% | 7.0% |
| verb, non-3rd person singular present | 10.2% | 12.3% | 11.8% | 13.4% | 11.9% |
| verb, 3rd person singular present | 7.7% | 12.4% | 11.6% | 20.3% | 13.0% |
| verb, modal auxiliary | 2.1% | 4.7% | 3.4% | 5.5% | 3.9% |
| infinitival “to” | 3.9% | 5.8% | 6.8% | 6.8% | 5.8% |
| determiner | 7.2% | 13.6% | 21.3% | 13.4% | 13.9% |
| predeterminer | 1.3% | 5.0% | 0.0% | 13.0% | 4.8% |
| pronoun, possessive | 1.8% | 4.5% | 6.9% | 6.6% | 5.0% |
| wh-determiner | 2.4% | 11.8% | 11.9% | 16.1% | 10.5% |
| wh-pronoun, possessive | 0.0% | 0.0% | 0.0% | 33.3% | 8.3% |
| existential there | 11.0% | 7.3% | 4.5% | 5.9% | 7.2% |
| pronoun, personal | 6.8% | 5.3% | 7.9% | 13.9% | 8.5% |
| wh-pronoun, personal | 4.2% | 15.7% | 14.3% | 19.4% | 13.4% |
| adjective | 4.5% | 4.7% | 6.0% | 6.3% | 5.3% |
| adjective, comparative | 1.2% | 2.4% | 3.7% | 10.7% | 4.5% |
| adjective, superlative | 2.9% | 5.7% | 4.7% | 15.7% | 7.2% |
| adverb | 4.5% | 4.3% | 6.4% | 11.6% | 6.7% |
| adverb, comparative | 9.9% | 9.3% | 12.9% | 21.6% | 13.4% |
| adverb, superlative | 0.0% | 0.0% | 7.1% | 25.0% | 8.0% |
| wh-adverb | 0.0% | 7.6% | 11.5% | 12.3% | 7.9% |
| preposition | 5.0% | 8.5% | 9.2% | 10.8% | 8.4% |
| adverb, particle | 24.0% | 8.8% | 13.6% | 20.1% | 16.6% |
| coordinating conjunction | 4.0% | 6.7% | 9.5% | 9.1% | 7.4% |
| subordinating conjunction | 4.7% | 17.9% | 12.7% | 8.2% | 10.9% |
7.4 Errors by band and first language
The error rates by bands, cross-tabulated will allow us to see any major differences between language users at different levels of ability, and this is shown in Table 15, where the plateaux or regressions are shown in bold italic text.
Table 15: Error rate by band and first language
| Band and First Language | Noun | Verb | Det | Prn | Adj | Adv | Prep | Conj | |
|---|---|---|---|---|---|---|---|---|---|
| L1 IELTS BAND 5.5 | |||||||||
| Italian | 9.1% | 10.9% | 10.2% | 14.3% | 7.4% | 9.0% | 7.7% | 7.9% | 9.6% |
| Chinese | 12.3% | 12.6% | 16.4% | 10.0% | 7.5% | 7.2% | 12.6% | 12.0% | 11.3% |
| Russian | 14.0% | 13.8% | 36.6% | 11.8% | 10.0% | 15.5% | 14.3% | 16.7% | 16.6% |
| Arabic | 17.2% | 21.2% | 31.7% | 24.6% | 11.5% | 22.1% | 21.3% | 13.8% | 20.4% |
| L1 IELTS BAND 6 | |||||||||
| Italian | 8.3% | 8.3% | 8.8% | 8.7% | 5.5% | 5.4% | 5.6% | 3.9% | 6.8% |
| Chinese | 9.1% | 10.2% | 13.8% | 4.9% | 5.5% | 5.7% | 9.8% | 11.2% | 8.8% |
| Russian | 9.5% | 9.9% | 24.7% | 7.2% | 7.0% | 7.6% | 10.6% | 10.3% | 10.9% |
| Arabic | 12.7% | 13.7% | 19.9% | 13.2% | 8.4% | 12.7% | 14.1% | 13.4% | 13.5% |
| L1 IELTS BAND 6.5 | |||||||||
| Italian | 6.2% | 5.8% | 8.5% | 4.2% | 3.0% | 5.2% | 5.3% | 3.2% | 5.2% |
| Chinese | 8.8% | 8.4% | 15.5% | 5.4% | 3.7% | 5.3% | 7.5% | 4.5% | 7.4% |
| Russian | 8.5% | 11.5% | 23.8% | 6.7% | 5.2% | 7.4% | 11.5% | 10.5% | 10.6% |
| Arabic | 7.2% | 9.6% | 12.5% | 10.6% | 5.8% | 11.7% | 9.8% | 4.8% | 9.0% |
| L1 IELTS BAND 7 | |||||||||
| Italian | 4.4% | 3.4% | 3.4% | 4.3% | 3.3% | 3.3% | 4.6% | 3.4% | 3.8% |
| Chinese | 7.0% | 5.7% | 13.0% | 5.0% | 3.5% | 3.3% | 5.6% | 3.6% | 5.8% |
| Russian | 5.5% | 5.9% | 18.3% | 6.2% | 4.6% | 3.6% | 6.9% | 6.5% | 7.2% |
| Arabic | 6.9% | 7.6% | 9.6% | 9.7% | 4.2% | 10.2% | 5.7% | 6.8% | 7.6% |
| L1 IELTS BAND 7.5 | |||||||||
| Italian | 3.4% | 3.2% | 3.7% | 2.8% | 2.7% | 1.5% | 3.8% | 2.1% | 2.9% |
| Chinese | 7.0% | 7.2% | 13.4% | 4.7% | 2.8% | 3.3% | 6.5% | 7.3% | 6.5% |
| Russian | 5.1% | 4.8% | 13.7% | 7.2% | 3.4% | 3.4% | 4.4% | 3.8% | 5.7% |
| Arabic | 3.5% | 4.3% | 5.4% | 6.4% | 3.2% | 3.1% | 3.8% | 5.3% | 4.4% |
Italian, as mentioned before, consistently have the lowest rates at each band for every type, with the exception of adverbs at 5.5 and pronouns at 6.0. Arabic speakers start as the worst with the most errors at 5.5, but have the second highest performance at 7.5. Conversely, Chinese speakers finish bottom with the most errors at 7.5, despite starting as the second-best performers for 5.5. Arabic speakers make the most errors at 5.5 (except determiners and conjunctions) and at 6.0 (except determiners again), but then the Russian speakers predominate between 6.0 and 6.5, where the Russian speakers also have the least error improvement and the hardest job of moving forward. Arabic speakers once again hold the worst performance for verbs, pronouns, adverbs, and conjunctions at IELTS 7.0, but then improve considerably. At 7.5, the Chinese speakers perform the worst among the groups at nouns, verbs, prepositions, and conjunctions, with the Russian speakers performing among the groups marginally worst on determiners and adverbs, and worse on pronouns and adjectives.
Table 16: Changes in percentage values between bands and first languages
| Change score | 5.5 to 6 | 6.0 to 6.5 | 6.5 to 7 | 7.0 to 7.5 |
|---|---|---|---|---|
| Italian | 2.7 | 1.7 | 1.4 | 0.8 |
| Chinese | 2.5 | 1.4 | 1.5 | -0.7 |
| Russian | 5.7 | 0.2 | 3.5 | 1.4 |
| Arabic | 6.9 | 4.5 | 1.4 | 3.2 |
| Average drop | 4.5 | 2.0 | 2.0 | 1.2 |
Regarding the ‘regression’ and ‘plateau’ of fossilization, overall error rates across language backgrounds seem to plateau or worsen around 6.0-6.5 for Russian, 6.5-7.0 for Arabic, and 7.0-7.5 for Italian, and worsen at 7.0-7.5 for Chinese. All the largest gains were at 5.5-6.0, and overall, the smallest gains were at 7.0-7.5, with exception of the Chinese group (see Table 16 for the drops in percentage values between bands, with the largest gains in bold and the lowest gains in bold italics).
Looking more closely at Table 15 which shows the error rates by band and language for the 8 types of grammar, we can see further patterns. For Italian, the categories that regressed were pronoun and conjunction errors between 6.5-7.0 and determiner errors between 7.0-7.5. For Russian, the categories that regressed were preposition and conjunction errors between 6.0-6.5 and pronoun errors between 7.0-7.5. For Arabic, the only category that regressed was conjunction errors between 6.5-7.0. Chinese was very unstable, with an overall increase in error rate between 7.0-7.5. Two regression points occurred: between 6.0-6.5, regression occurred for determiner and pronoun errors; between 7.0-7.5, regression occurred for determiners (a second regressive step), conjunctions, and prepositions; and between 7.0-7.5, plateaux occurred for nouns and adverbs.
The next question is whether there was a statistically significant difference between error rate movement between IELTS scores and language background.
8 ERROR ANALYSIS USING NEGATIVE BINOMIAL REGRESSION AND INCIDENCE RATE RATIO
Given that the data was not normally distributed, and this could not satisfactorily be remedied with log transformation, an appropriate model was sought. The counted rate data resembles a Poisson distribution rather than a normal distribution (see Figure 8).

Figure 8: All grammatical errors
However, there were significant violations of the dispersion and fit assumptions for Poisson regression. Negative binomial regression was run instead, since this reduced the residual deviance from 3572 down to 521, and reduced the overdispersion, indicating a better fit than Poisson regression. The incidence rate ratios (IRR) indicate the differences between the reference point and the increase in error for the category. The confidence intervals (CI) are the range of values which are likely to indicate a true result to a level of 95% probability.
Table 17: Incidence rate ratio of error rates between IELTS band and first language
| Characteristic | IRR | 95% CI | p-value |
|---|---|---|---|
| IELTS band reference = IELTS 7.5 | |||
| IELTS 7.0 | 1.22 | 1.06, 1.40 | 0.005 |
| IELTS 6.5 | 1.66 | 1.46, 1.90 | <0.001 |
| IELTS 6.0 | 2.05 | 1.80, 2.35 | <0.001 |
| IELTS 5.5 | 2.81 | 2.46, 3.21 | <0.001 |
| First language reference = Italian | |||
| Chinese | 1.52 | 1.35, 1.71 | <0.001 |
| Russian | 1.70 | 1.51, 1.92 | <0.001 |
| Arabic | 1.75 | 1.56, 1.97 | <0.001 |
As can be seen in Table 17, for every IELTS half-band increase, holding first language constant in the model, the error rate significantly improves. Holding IELTS scores constant, and using Italian as the reference group (because it had the lowest overall rates and has the closest relationship to English), there is a significant effect of first language group on error rate among the Chinese, Russian, and Arabic groups. The next question is if these results are found for individual grammatical types.
Table 18: Incidence rate ratios for nouns
| Characteristic | IRR | 95% CI | p-value |
|---|---|---|---|
| IELTS band reference = IELTS 7.5 | |||
| IELTS 7.0 | 1.26 | 1.05, 1.51 | 0.015 |
| IELTS 6.5 | 1.62 | 1.35, 1.94 | <0.001 |
| IELTS 6.0 | 2.08 | 1.74, 2.49 | <0.001 |
| IELTS 5.5 | 2.72 | 2.28, 3.25 | <0.001 |
| First language reference = Italian | |||
| Chinese | 1.45 | 1.24, 1.70 | <0.001 |
| Russian | 1.33 | 1.13, 1.56 | <0.001 |
| Arabic | 1.45 | 1.24, 1.70 | <0.001 |
Nouns follow the main pattern, with Table 18 showing that for every IELTS half-band decrease, holding first language constant in the model, the error rate significantly increases in each half band. Holding IELTS constant, and using Italian as the reference group, there is a significant effect of first language group on error rate among Chinese, Russian, and Arabic groups.
Table 19: Incidence rate ratios for verbs
| Characteristic | IRR | 95% CI | p-value |
|---|---|---|---|
| IELTS band reference = IELTS 7.5 | |||
| IELTS 7.0 | 1.14 | 0.92, 1.41 | 0.2 |
| IELTS 6.5 | 1.78 | 1.46, 2.17 | <0.001 |
| IELTS 6.0 | 2.16 | 1.78, 2.64 | <0.001 |
| IELTS 5.5 | 2.94 | 2.42, 3.57 | <0.001 |
| First language reference = Italian | |||
| Chinese | 1.47 | 1.23, 1.75 | <0.001 |
| Russian | 1.49 | 1.24, 1.78 | <0.001 |
| Arabic | 1.76 | 1.48, 2.09 | <0.001 |
Verbs follow the main pattern, with Table 19 showing that for every IELTS half-band decrease, holding first language constant in the model, the error rate significantly increases between IELTS 5.5 to 6.5, and IELTS 7.0 and 7.5 is not significantly different (albeit still with a 14% improvement). The wide confidence interval indicates either (1) a great variability in scores and/or (2) the sample size needs to be larger. Intuitively, it is likely that there is greater variability in errors at an individual level. This observation applies to the subsequent IRR tables in this report and must be considered when interpreting an insignificant result. We can also ascertain that, holding IELTS constant, and using Italian as the reference group, there is a significant effect of first language group on error rate among the Chinese, Russian, and Arabic groups.
Table 20: Incidence rate ratios for determiners
| Characteristic | IRR | 95% CI | p-value |
|---|---|---|---|
| IELTS band reference = IELTS 7.5 | |||
| IELTS 7.0 | 1.20 | 0.99, 1.46 | 0.061 |
| IELTS 6.5 | 1.62 | 1.35, 1.95 | <0.001 |
| IELTS 6.0 | 1.78 | 1.49, 2.14 | <0.001 |
| IELTS 5.5 | 2.31 | 1.93, 2.77 | <0.001 |
| First language reference = Italian | |||
| Chinese | 2.07 | 1.73, 2.47 | <0.001 |
| Russian | 2.96 | 2.50, 3.51 | <0.001 |
| Arabic | 2.00 | 1.68, 2.38 | <0.001 |
Determiners follow the main pattern, with Table 20 showing that for every IELTS halfband decrease, holding first language constant in the model, the error rate significantly increases between IELTS 5.5 to 6.5, and IELTS 7.0 and 7.5 is not significantly different (albeit still with a 20% improvement). Holding IELTS constant, and using Italian as the reference group, there is a significant effect of first language group on error rate among the Chinese, Russian, and Arabic groups.
Table 21: Incidence rate ratios for pronouns
| Characteristic | IRR | 95% CI | p-value |
|---|---|---|---|
| IELTS band reference = IELTS 7.5 | |||
| IELTS 7.0 | 1.16 | 0.81, 1.67 | 0.4 |
| IELTS 6.5 | 1.24 | 0.87, 1.77 | 0.2 |
| IELTS 6.0 | 1.56 | 1.12, 2.18 | 0.008 |
| IELTS 5.5 | 2.83 | 2.10, 3.86 | <0.001 |
| First language reference = Italian | |||
| Chinese | 0.87 | 0.65, 1.15 | 0.3 |
| Russian | 1.14 | 0.86, 1.51 | 0.4 |
| Arabic | 1.87 | 1.45, 2.42 | <0.001 |
Pronouns do not follow the main pattern, with Table 21 showing that for every IELTS half-band decrease, holding first language constant in the model, the error rate is significantly larger for IELTS 5.5 and 6.0, with improvements of around 20% for the next two levels on average, but a wider confidence interval that shows both increases and reductions are present among individuals. Holding IELTS constant, and using Italian as the reference group, there is a significant effect of first language group on error rate only for the Arabic group.
Table 22: Incidence rate ratios for adjectives
| Characteristic | IRR | 95% CI | p-value |
|---|---|---|---|
| IELTS band reference = IELTS 7.5 | |||
| IELTS 7.0 | 1.30 | 0.97, 1.75 | 0.078 |
| IELTS 6.5 | 1.47 | 1.10, 1.97 | 0.010 |
| IELTS 6.0 | 2.19 | 1.67, 2.90 | <0.001 |
| IELTS 5.5 | 3.03 | 2.32, 3.97 | <0.001 |
| First language reference = Italian | |||
| Chinese | 1.07 | 0.83, 1.37 | 0.6 |
| Russian | 1.40 | 1.11, 1.77 | 0.005 |
| Arabic | 1.52 | 1.20, 1.92 | <0.001 |
Adjectives also vary from the main pattern, with Table 22 showing that for every IELTS half-band decrease, holding first language constant in the model, the error rate significantly increases until IELTS 7.0, and while there is a 30% improvement for the IELTS scores above this, this change is not significant. Holding IELTS constant, and using Italian as the reference group, there is a significant effect of first language group on error rate for the Russian and Arabic groups.
Table 23: Incidence rate ratios for adverbs
| Characteristic | IRR | 95% CI | p-value |
|---|---|---|---|
| IELTS band reference = IELTS 7.5 | |||
| IELTS 7.0 | 1.73 | 1.21, 2.49 | 0.003 |
| IELTS 6.5 | 2.57 | 1.84, 3.62 | <0.001 |
| IELTS 6.0 | 2.78 | 1.99, 3.91 | <0.001 |
| IELTS 5.5 | 4.65 | 3.39, 6.45 | <0.001 |
| First language reference = Italian | |||
| Chinese | 1.05 | 0.79, 1.39 | 0.8 |
| Russian | 1.54 | 1.17, 2.03 | 0.002 |
| Arabic | 2.45 | 1.89, 3.19 | <0.001 |
Adverbs follow the main pattern for IELTS bands, with Table 23 showing this. Holding IELTS constant, and using Italian as the reference group, there is a significant effect of first language group on error rate for the Russian and Arabic groups.
Table 24: Incidence rate ratios for prepositions
| Characteristic | IRR | 95% CI | p-value |
|---|---|---|---|
| IELTS band reference = IELTS 7.5 | |||
| IELTS 7.0 | 1.23 | 0.99, 1.52 | 0.058 |
| IELTS 6.5 | 1.82 | 1.49, 2.22 | <0.001 |
| IELTS 6.0 | 2.13 | 1.75, 2.60 | <0.001 |
| IELTS 5.5 | 2.93 | 2.42, 3.56 | <0.001 |
| First language reference = Italian | |||
| Chinese | 1.58 | 1.32, 1.89 | <0.001 |
| Russian | 1.74 | 1.45, 2.07 | <0.001 |
| Arabic | 1.92 | 1.61, 2.29 | <0.001 |
Prepositions follow the main pattern, with Table 24 showing that for every IELTS halfband decrease, holding first language constant in the model, the error rate significantly improves until IELTS 7.0, where the 23% increase does not reach a 5% probability value. Holding IELTS constant, and using Italian as the reference group, there is a significant effect of first language group on error rate for the Chinese, Russian, and Arabic groups.
Table 25: Incidence rate ratios for conjunctions
| Characteristic | IRR | 95% CI | p-value |
|---|---|---|---|
| IELTS band reference = IELTS 7.5 | |||
| IELTS 7.0 | 1.07 | 0.69, 1.65 | 0.8 |
| IELTS 6.5 | 1.23 | 0.80, 1.88 | 0.3 |
| IELTS 6.0 | 2.09 | 1.42, 3.09 | <0.001 |
| IELTS 5.5 | 2.63 | 1.81, 3.87 | <0.001 |
| First language reference = Italian | |||
| Chinese | 1.88 | 1.29, 2.77 | 0.001 |
| Russian | 2.29 | 1.56, 3.39 | <0.001 |
| Arabic | 2.16 | 1.48, 3.19 | <0.001 |
Conjunctions only follow the main pattern of significant difference for language groups but not for the relationship of IELTS band with errors. Table 25 shows that for every IELTS half-band decrease, holding first language constant in the model, the error rate is significantly increased only for IELTS 5.5 and 6.0, but there is great variability after that, and an insignificant relationship of difference to the IELTS 7.5 reference group.
9 SUMMARY OF ERROR PATTERNS
Before summarising the results, it needs to be remembered that this study used the barest minimum error correction and counts, so error rates reported represent the absolute best-case scenario and the real usage will be worse than stated here.
The average distribution of errors across all texts were: determiners (12.5%), verbs (8.8%), pronouns (8.7%), prepositions (8.3%), nouns (8.1%), conjunctions (7.5%), adverbs (6.7%) and adjectives (5.2%). However, the average distribution of grammatical types across all texts were: nouns (25.6%), verbs (22.0%), prepositions (15.2%), determiners (13.2%), adjectives (9.6%), adverbs (6.3%), pronouns (4.4%), and conjunctions (3.7%). If candidates were making errors equally across the text, then the distributions would match, and there would be no problem areas worth noticing. However, the proportions do not match, and when the rank order is examined, it appears that determiners, pronouns, and conjunctions were particularly problematic across the groups.
The overall error rate across all bands and languages was nearly 1 grammatical error per 10 words. The lower band scores had more grammatical errors than the higher band scores, so at IELTS 5.5 there were 3 errors per 20 words and at IELTS 7.5, there was 1 error per 20 words. The biggest drops in error rate were seen from IELTS 5.5 until IELTS 6.5, at which there was a ‘churn’ in error improvement as error rates dropped, rose, or plateaued erratically at IELTS 6.5 and IELTS 7.0, and after this smaller but uniform improvement in error rates were found again at IELTS 7.5. Figures 4 and 5 provide an excellent visual representation of this progression.
The improvement among error types varied by bands, with certain types of error improving more at one band score than others. The progression of error improvement was not even for any grammatical error type across band scores. Four types of error got worse (regression) at some point (nouns, pronouns, adjectives, and conjunctions).
An example of an error type getting worse is for adjectives, where there was a 3.3 and then 3.2 percentage point improvement in the half bands between IELTS 5.5 and IELTS 6.5, but then a regression of 0.3 percentage points at IELTS 7.0, but then a 1.4 percentage point improvement at IELTS 7.5. An example of the uneven improvement in error type is for determiners, where there was a 4.5 and then 1.4 percentage point improvement in the half bands between IELTS 5.5 and IELTS 6.5, but then a large jump of a 4.8 percentage point improvement occurred at IELTS 7.0, and similarly 3.2 percentage point improvement at IELTS 7.5.
The 8 grammatical errors represented 33 grammatical subtypes (these were outlined in Table 3). This allowed a more nuanced breakdown of the error rates for each band increment (presented in Table 8). Some subtypes of error extinguished altogether: possessive wh-pronouns, same plural nouns, predeterminers, and superlative adverbs. Some subtypes of errors remained very high: personal wh-pronouns, possessive endings, and proper singular nouns. Particular errors jumped back up in rate at IELTS 7.5: proper nouns, existential ‘there’, infinitival ‘to’, verbs in their base and past participle forms, and pronouns in possessive, personal, and wh- forms.
A person’s first language was found to affect the grammatical error rate. This meant that some first-language backgrounds had higher error rates than other language backgrounds, despite obtaining the same IELTS score. This is possible because a person with more grammatical errors may have performed better in the other Task 2 criteria that contribute to the overall writing score, or they may have performed better in Task 1, which comprises 33% of the overall writing score. Grammatical ability may contribute as little as 25% and as much as 38% of the Task 2 score, depending on whether you count only the ‘grammatical accuracy and range’ or include half of the ‘coherence and cohesion’ dimension.
The Italian group had the lowest error rate overall (5.7%), followed by Chinese (8.3%), Russian (9.7%), and Arabic (10.2%). However, these figures do not represent the unique error difficulties for each language background. In fact, Arabic speakers may have started with the worst error rates at IELTS 5.5, but they consistently improved and ended up with the second-best rates at IELTS 7.5. Chinese speakers had the second-best error rates at IELTS 5.5, but had the worst error rates of all groups at IELTS 7.5. Italian and Russian speakers remained in first and third place throughout.
There were also points of difficulty that occurred at different band scores for each group. Arabic speakers are the most consistent improvers, and regress once between 6.5-7.0 on conjunctions that do not bounce back to former rates, even at IELTS 7.5. Italian speakers regress slightly between 6.5-7.0 on pronouns and conjunctions, and then between 7.0-7.5 for determiners. Russian speakers have regressions between 6.0-6.5 for verbs, prepositions, and conjunctions, and between 7.0-7.5 for pronouns. Chinese speakers show the greatest variation between bands. Significant regression/plateaux occur at IELTS 7.5 for nouns, verbs, determiners, adverbs, and conjunctions, but a smaller regression also occurs at IELTS 6.5 for determiners and pronouns. In summary, regression occurs for Chinese and Russian speakers at IELTS 6.5, then for Italian and Arabic speakers at IELTS 7.0, and again for mainly the Chinese speakers at IELTS 7.5.
Regression analysis was run on the IELTS band score on error rate. Holding first language constant and using IELTS 7.5 as the reference group, significant effects were found for all scores between a 1.2 to 2.8 increase in errors as scores reach IELTS 5.5, all reaching significance (p<.001). The pattern of errors across bands was found for nouns, verbs, determiners, and prepositions, but significance was found only up to IELTS 6.0 for pronouns and conjunctions, and IELTS 7.0 for verbs, determiners, adjectives, and prepositions.
First language itself was significantly related to error rate. Holding IELTS score constant, and using Italian as the reference group, there was between a 1.52 to 1.75 increase of making errors, all reaching significance (p<.001) in the overall picture. When individual grammatical type was investigated, the same patterns occurred, with the following exceptions: no significant difference for pronouns, adjectives, and adverbs, for the Chinese group, and no significant difference in rate for adjectives for the Russian group.
10 STAKEHOLDERS FINDINGS
In the previous section, the expected grammatical error rates for each IELTS band were established. In Section 10, we move on to present the results of the stakeholder survey which explores the perceptions of stakeholders at the broader level in relation to their organisational use of IELTS, before moving onto the narrower example of stakeholders’ perceptions of grammatical error and how they respond to this specific risk. The discussion will then move to how stakeholders manage risk, before finishing the section with an overview of perceptions of the necessity of having a benchmark, and a discussion of issues around communication. If we recall from Section 3, the research questions for stage two of the study are:
- How do stakeholders use the IELTS?
- How do stakeholders manage their risk?
- How does knowledge of error rate and type affect the perception of risk?
This second step of the study used the following methodology. As mentioned earlier, ethical approval for the project was gained before commencing data collection. Over a thousand potential decision-making stakeholders professional, government, and educational organisations were contacted directly by email and invited to participate across Australia. In total, 39 participants responded to the survey. In some cases, the participants could be identified if their specific role was revealed, so care was taken not to allowed accidental identification of individuals. Respondents filled in an online Qualtrics survey containing both Likert-type questions and open-response questions. Participants were asked about their awareness of language tests and language testing, estimated error rates, and responses to summative information about the error rates found in the first part of this study for each half-band. Respondents were also asked about risk. They answered questions about their broad employment area, the IELTS requirements set by their organisation, who decided the appropriate IELTS levels, their experience of the risk presented by poor communication (not necessarily error-based), and the effectiveness of IELTS as a tool for evaluating communicative competence in their setting.
Participants were not obliged to answer every question, so some people skipped questions, and this is reflected in the varying number of respondents in the tables. The qualitative data was summarised into tables and their responses organised into themes (partly because participants would often provide comment in one question that pertained to the topic of another question). An example of this is the overlap in the open-format responses to the following questions: “Are there any specific types of error in written documents that pose a risk to your organisation?”, “Do you believe IELTS candidates assessed according to your organisation’s IELTS standard have the competency to interface in the environment for which they were assessed (e.g. with public, patients, staff, etc.)?”, and “Once someone has sat an IELTS test, do you think it is possible for their English proficiency to improve over time?” These questions were formulated in response to the themes found in the wider literature on the post-graduation transition to professional work.
Note that, as explained previously, the response rate for the stakeholder survey was very low, and this is due to the study taking place in the second year of the COVID-19 pandemic when the workloads of professionals and educators, especially in health, was extraordinarily heavy (i.e. 2021). Nonetheless, as academic researchers, we have an ethical obligation to report on what data we gather, even if the response rate was understandably poor. Nevertheless, the findings do reveal some interesting patterns which are reported on below. To foreground these issues, we begin with an exploration of responses to questions associated with the broader organisational environment.
10.1 Stakeholder awareness of language and language testing
Awareness of language and language testing can provide a glimpse into the commitment that organisations have to ensuring that their workforce/students/graduates have the language skills to be able to communicate in a professional manner. Being aware of the range of language tests indicates some degree of care has been taken to become knowledgeable in this area. Among the participants who answered the question about whether they know about the range of possible English language tests, the majority (88%, n=16) indicated they were able to identify IELTS’ main competitors. Participants named a number of language test alternatives, including TOEFL, OET, PTE, and CAE. Thus, there is a high level of awareness of English language tests available.
When asked about their understanding of what was involved in taking an IELTS test, the majority (70%, n=12) indicated ‘yes’ (they knew what was involved), while 29% (n=5) had ‘some idea’. When asked about whether they considered the IELTS test to be demanding, 71% (n=10) answered ‘yes’, 14% (n=2) that it is not demanding, while 14% (n=2) were ‘unsure’. Their comments were as follows:
“Yes, as expected of a test to check for English proficiency.” (R.19)
“We hear quite frequently how stressful the process is.” (R.21)
“No: proficiency is required for a law degree and students who regard IELTS as very demanding are going to experience difficulty (esp. at graduate level) in undertaking coursework or a major dissertation.” (R.22)
“Preparation is required so that you are able to complete the test successfully. I have heard cases of Australian-born native English speakers who have sat the test overseas to gain professional accreditation who have not obtained a good score as they were unprepared for the test.” (R.28)
“I have heard it can be very stressful for students, but then I think any examination can be.” (R.38)
Here, there is a divergence of views, with some expecting the test to be difficult simply because a test is meant to be able to discriminate between differing language abilities, but others perceiving that IELTS is too difficult because native English speakers were unable to pass the test (for whatever reason, whether that be a lack of writing ability or a lack of familiarity with the testing format). Chan and Taylor (2020) also found that IELTS was considered demanding when compared to other tests. Nevertheless, there needs to be a balance between the test being demanding enough to ensure it is reliably testing for good quality candidates/graduates/employees, and not being so demanding that only the cream of the crop get through.
One of the issues with language tests is that they measure a construct that changes over time, both in terms of language skills getting better, but sometimes getting worse. In response to the question on their understanding of English proficiency decline over time, it was correctly identified by stakeholders 81% (n=13) that English test scores can worsen, and that this may depend on the frequency of use of English by the individual.
“You do not ‘pass’ an IELTS test. Language will always decline if not regularly used. This has nothing to do with the test. This is why the test results has a limit of two years…Of course. Skills are not static. Proficiency tests are a snapshot of ability at any given time.” (R.2)
The responses to this question represent an accurate understanding of, and the main contributor to, language decline over time. This is important as it provides a justification for possible repeated testing of English language capability, particularly for employment in the professions. The high level of understanding of this issue is also important because people need to understand that an IELTS test is a measurement taken at a point in time, and that variations between test results (if time has passed between them) is not because the test is inaccurate, but that the language skill has changed.
10.2 Stakeholder use of IELTS scores
It was found in this study that IELTS test scores are used for a diverse range of purposes, as shown in Table 26.
Table 26: Stakeholder use of IELTS
| Purpose | Percentage | n |
|---|---|---|
| Entry pathway | 52% | 17 |
| Professional registration | 15% | 5 |
| Migration requirement | 15% | 5 |
| Placing students into classes | 15% | 5 |
| Other | 3% | 1 |
It is important to note that IELTS was designed only to test entry into higher education and training institutions, and arguably for the English language colleges which feed these institutions; however, there has been a gradual extension of uses for IELTS since the early 2000s, where it was used for verification of English skills for professional and immigration purposes. In this study, a third of uses were non-academic. The next question is what range of IELTS scores is used by stakeholders, and Table 27 shows that there was a broad range of IELTS score requirements.
Table 27: Band requirements
| Band | Percentage | n |
|---|---|---|
| 5.5 | 13% | 5 |
| 6 | 25% | 10 |
| 6.5 | 25% | 10 |
| 7 | 28% | 11 |
| 7.5 | 8% | 3 |
| Any score | 3% | 1 |
The range is dominated by the 6.0, 6.5, and 7.0 bands for professional and educationa purposes. Professional purposes here would cover registration for various professions (i.e., nursing and a range of other professions). These bands also reflect entry requirements for higher education courses. This range of band requirements mirrors that of Smith and Haslett (2007) and Hyatt and Brooks (2009) over a decade ago, demonstrating stability over time in band requirements.
Stakeholders commented on the IELTS score requirements, which indicated stakeholder awareness of how language requirements differ by discipline or course:
“Different courses have different requirements.” (R.2)
“UG: 6.0 overall with no band below 6.0…PG: 6.5 overall with no band below 6.0.” (R.24)
“Overall 6.5 with no band less than 6…some disciplines require a 7.” (R.32)
“Looking to increase to 7.0.” (R.38)
When asked how IELTS for stakeholder organisational needs could be improved, most respondents stated that entry levels should be raised (56%, n=5), while only 22% (n=2) considered that they should be kept the same. The reason for the latter responses may be due to entrants’ performance within the organisation. There is a perception that raising entry levels may assist in mitigating risk by overcoming such issues.
10.3 Stakeholder decision-making
Continuing the exploration of stakeholder perceptions of the broader organisational environment, stakeholders were asked whether they knew why their organisation had selected the IELTS score for entry: 75% (n=15) indicated ‘yes’, 25% (n=5) indicated ‘no’, while there were no respondents who were ‘unsure’. Respondents’ reasons as to why their organisation had selected the entry scores were varied, and reasons included “aligns with registration requirements” (R.15), “must comply with English skills registration standard” (R.28) to being “based on evidence of success” (R.32).
When asked about score requirements, 50% (n=12) of those who made the decisions about setting scores (see Table 28) indicated that they would prefer not to be making such decisions. Similarly, of the 50% (n=12) who did not have input into these decisions, half wished they could (see Table 29), e.g., “I am an academic who has convened and taught in language teacher education for a long time. I have never been consulted about admission requirements.” (R.23)
Table 28: Decision-makers for IELTS requirements
| Decision-maker | Percentage | n | Job role and location |
|---|---|---|---|
| Yes | 50% | 12 | Manager - University or Other (n=5) Academic - University (n=3) Administration - University or Other (n=3) Other (n=1) |
| No | 50% | 12 | Academic - University (n=4) Administration - University, Technical and Further Education or Professional Body (n=4) Manager - University, Government Agency or Professional Body (n=3) Other (n=1) |
Table 29: Non-decision-makers for IELTS requirements
| Response | Percentage | n | Job role and location |
|---|---|---|---|
| Yes | 46% | 6 | Administration - University (n=2) Academic - University (n=3) Manager - University (n=1) |
| No | 54% | 7 | Manager - University, Government Agency or Professional Body (n=3) Administration - University or Technical and Further Education (n=2) Other (n=1) |
The data in Tables 28 and 29 represent a potential risk for organisations, and indeed, for the IELTS organisation. There was a fairly even split between those who made decisions and those who did not. However, such decision-making is often in the hands of people in managerial positions. Clearly, not everyone who would like to make such important decisions could do so. Another main trend to arise from these two tables is that academic staff generally wanted to have more input into decision-making. These are the people at the cutting-edge of assessment, and they are the most aware of the abilities of the candidates/students/graduates. It may well be a risk mitigation action for stakeholder organisations to engage with such people, who have the expertise and the willingness to play a greater role in the decision-making process around IELTS requirements.
Stakeholders were asked about who made decisions and how standards were set. Many commented that standards were determined by committees, boards, and admissions officers:
“Determined through a University Admissions Committee and Academic Board.” (R.35)
“As a member of a regulatory board. There are 9 of us who provide input into the decision-making. We have equal say but if there are disagreements we discuss unti consensus is reached.” (R.21)
In terms of how scores were determined, internal benchmarks were generally used for score setting:
“Based on evidence of success.” (R.32)
“Students with scores below this level tend to struggle with the discipline-specific terminology.” (R.38)
“As we have two other options to examine our clients’ English abilities…as a designated skills assessing authority, we have been retaining the requirement of overall 6 (each category is above 6 bands) for more than 25 years.” (R.25)
Some organisations/decision-makers used external terms of reference:
“Check IELTS scores.” (R.36) [from the IELTS organisation]
“This was decided on following a literature review and national consultation.” (R.21)
“Must comply with the English language skills registration standard (2019).” (R.28)
“We rely on requirements prescribed by Department of Home Affairs.” (R.19)
“I make decisions within a regulatory framework regarding English language entry scores.” (R.21)
“Our English entry levels are benchmarked to universities in the same global ranking as ours.” (R.33)
“As we do skills assessment for migration purpose, we usually need to comply our assessment criteria with the Department of Home Affairs’ migration policies.” (R.25)
The opinions of stakeholders outlined above, particularly the last set of responses indicating use of external terms of reference for setting IELTS requirements, would go part of the way to explaining why administrators (rather than academics/employees) seem to have direct input into deciding IELTS requirements.
10.4 Stakeholder opinion of IELTS and institutional fit
Opinions on institutional fit are crucial to understanding how well the IELTS test fulfils stakeholder needs. Perceptions about fit involve ongoing satisfaction and continuing usage of the IELTS test by organisations. This study found general agreement that the IELTS test and scores had measurement accuracy, as found in Smith and Haslett (2007, pp 23-24). However, there was less agreement about institutional fit for purpose in this study.
The IELTS test was considered as one method of fulfilling the institutional assessment criteria, by verifying communicative ability. As stated by one participant, “We consider the English language test result as one of key assessment criteria,” (R.25). When asked if the IELTS test successfully distinguishes minimum English requirements, 56% (n=9) indicated ‘yes’ and 13% (n=2) ‘no’, while 31% (n=5) were unsure. More generally, when stakeholders were asked if IELTS served the needs of their organisation, 70% (n=12) indicated ‘yes’ and 11% (n=2) ‘no’, with 17% (n=3) being ‘unsure’.
Stakeholders were asked if their organisation liaised with the IELTS organisation about their organisational risk requirements: 42% (n=3) stated they did in relation to documentation, which is an important response because documentation is a method of mitigating risk; and 29% (n=2) of respondents liaised with the IELTS organisation about ‘other’ organisational risk requirements. Furthermore, 29% (n=2) stated that their organisation did not approach IELTS about their specific needs in relation to risk.
A range of potential legal issues that may arise were commented on by participants, especially in situations which would require two-way communication. Similar serious consequences have been noted in Elder et al. (2013), and “matters of formal accuracy” that is specific to documentation was identified in a study conducted by Moore et al. (2015, p 34). In our study, participants commented on what possible risks were caused by poor language skills:
“If they confuse the listener in a healthcare setting, this can literally be the difference between life and death and may affect patient outcomes.” (R.21)
“Litigation.” (R.22)
“It may cause misunderstanding, inaccurate interpretation to delay our assessment process.” (R.25)
“Miscommunication and distortion of facts.” (R.33)
There were few comments about expectations; however, it was clear that English proficiency and competent interpretation of information were clear expectations from stakeholders, including being able to understand the fundamentals of language.
“We do not expect perfection from speakers of English as a second or additional language. What we expect is that they are proficient enough to learn and improve within the course.” (R.7)
“Students need to be able to write, record and interpret clearly and correctly.” (R.38)
The points made above show that organisations are quite aware of the potential organisational risks associated with English language requirements.
Next, the discussion moves from the broader organisational context to the narrower domain of how the stakeholders respond to the error rates outlined in the first quantitative part of this report. This will provide a context for the discussion that will follow on how the stakeholders manage risk.
10.5 Stakeholder estimates of error rates
Before being shown a selection of results from the current study, stakeholders were asked to estimate on a slider tool how many written errors per 100 words they thought would occur at each IELTS level, and how many they would expect of a native speaker of English (see Table 30). This question was asked in order to establish preconceptions about error rates before the respondents viewed the findings of this study.
Table 30: Stakeholder expectation of written errors per 100 words
| IELTS score holder | Mean | Std Dev | Count |
|---|---|---|---|
| 5.5 | 43 | 18 | 11 |
| 6 | 38 | 14 | 10 |
| 6.5 | 28 | 17 | 11 |
| 7 | 23 | 13 | 10 |
| 7.5 | 16 | 12 | 10 |
| Native English speaker | 24 | 24 | 10 |
Albeit the very wide variations between each participants estimates for each band and the native English speakers, they estimated on average that IELTS users who scored 7 or 7.5 (out of a maximum score of 9) were expected to make fewer errors than they estimated for a native user of English (!). This is hard to interpret. These responses either expose the participant’s individual lack of language expertise and subjective bias to positively represent ESL speakers, or it truly represents the fact that native English speakers make many more grammatical errors than an ESL speaker in stakeholder environments. The latter might be possible for the written work of native users, but the former possibility is more likely. Given the large number of academics in the study, it is possible that they are hypersensitive to the errors of their students, local or international, because the error rate of both parties were grossly overestimated. However, given the non-credible estimates of error between a 7.5 and a local English speaker, it could be that stakeholders were hypercritical of the errors of the local students and were prone to extending generosity towards international students.
The stakeholders estimated triple the actual measure of 1 error per 20 words found for IELTS 7.5 in the quantitative arm of this study, even taking into account that the study may have underestimated errors in its minimalist approach to error correction. These results show how ‘noticeable’ errors are: stakeholders perceive more errors than in reality. Stakeholders also have skewed positive expectations in favour of non-English background writers in comparison to Australian writers when it comes to error rate.
10.6 Stakeholder response to error rates and examples
Respondents were asked to respond to initial findings on error rates, and to comment within the context of risk. A selection of error findings and examples from the study’s dataset was presented to stakeholders, as seen in Figure 9.
Figure 9: Sample errors
Here are some sample findings about written errors that we would like you to think about. What are your thoughts and comments about the findings below?
Verb past tense use
5.5 IELTS - 38% incorrect, e.g., “how did they was make it” 7.0 IELTS - 19% incorrect, e.g., “suffer from diseases that are connected with food ate” 7.5 IELTS - 6% incorrect, e.g., “a number of people held a belief that”
Adverb use / adverb particle use
5.5 IELTS - 13% / 28% incorrect, e.g., “a variety of products that more wide”
7.0 IELTS - 5% / 15% incorrect, e.g., “Meantime, I got so angry every time”
7.5 IELTS - 2% / 7% incorrect, e.g., “a great number of abroad fruits”
Possessive ending use
5.5 IELTS - 49% incorrect, e.g., “food globalization makes people tastes very similar” 7.0 IELTS - 24% incorrect, e.g., “the merits in the food health levels” 7.5 IELTS - 19% incorrect, e.g., “wildlifes died under the hunters guns”
The demonstration proved to be illuminating for the stakeholders, with some respondents demonstrating a shift in thinking, which is evident in the written responses below. Furthermore, the responses were quite varied, but of note is that some responses appeared to indicate stakeholders’ preferences for individualised assessment and higher benchmarks to address organisational needs.
“It is a practical example of mistakes made.” (R.21)
“It makes sense when you see it broken down in such a manner.” [Other-Government Agency] (R.21)
“Haven’t ever crunched numbers.” [Academic-University] (R.22)
“Yes, we are a bit surprised to see how the IELTS examiner determined the result, i.e., it must be a challenging step to gauge and assess each individual written work.” (R.25)
“I’m not sure what is expected here - clearly people with lower IELTS scores are going to make more mistakes and those with higher scores will make fewer mistakes.” (R.7)
“It shows me that English language use for people with higher IELTS is better.” (R.38)
“Error rates are irrelevant.” [Manager-University] (R.2)
“English is insanely hard to learn and get right. It is riven with irregularities and exceptions.” [Administration-University] (R.7)
“Our organisation only checks the band level and we are not involved in checking for errors.” [Administration-Other] (R.19)
“Roughly meets my expectations based on what I have experience of in the classroom.” [Academic-University] (R.24)
“We didn’t know your IELTS band scores had been defined to such a thorough and detailed level.” [Administration-Professional registration body] (R.25)
“There is a big difference between a 5.5 and a 7.5, so I am not really surprised.” [Other] (R.28)
“The range and abilities of test-takers are dependent on the exposure to English language use in their region, and their own proficiency levels.” [Manager-University] (R.33)
“English is a notoriously difficult and complex language to learn. I think your findings support the need for a higher IELTS requirement. It’s a bit like the ATAR [Australian Tertiary Admission Rank for graduating secondary school students], although not perfect, it approximates the level of intellect required to be successful in a given university course.” [Academic-University] (R.38)
After responding to the sample IELTS errors shown in Figure 9, the respondents were asked about the grammatical competence required by their organisation, and to state whether they thought the IELTS score for entry should be higher or lower. A total of 61% (n=8) said ‘yes’, that it should be higher, while 38% (n=5) were ‘unsure’. No respondent suggested that the score should be lower after seeing the data.
This suggests that stakeholders fail to anticipate the number of grammatical errors that will be made by candidates/students/graduates at each IELTS band level, and the types of error that can be expected. Furthermore, when faced with real examples, the majority believe that the IELTS score should be raised in response. The demonstrates that grammatical errors is perceived to present a potential risk, particularly for organisations in public-facing professions such as nursing and medicine, where errors in grammar can be very significant (for example, when transferring a patient to another health professional, and describing their past, current, and possible future health conditions).
Respondents were also asked to think about whether their organisation was meeting their legal requirements by using appropriate documentation, such as IELTS, and then to answer if the findings in Figure 9 changed their opinion. In response, 41% (n=5) chose ‘yes’, that it would change their opinion, 41% (n=5) answered ‘no’, it would not change their opinion, while 16% (n=2) were ‘unsure’. The following section explores the issue of risk further.
10.7 Stakeholder management of risk
The use of IELTS scores provide documentation of language ability that can be considered within the framework of risk in the workplace. Most stakeholders (70%, n=6) acknowledged that language assessment can reduce risk exposure in their organisation. They accepted that risks were present, and acknowledged that if mistakes were made, then the organisation would be held responsible, but that IELTS could mitigate these risks.
When the respondents in our study were asked “Are you willing to accept some English errors in your organisation to ensure you have multicultural/multilingual workers?”, 33% (n=4) indicated ‘yes’, while 41% (n=5) indicated ‘no’, with 25% (n =3) being ‘unsure’.
“Yes, I’d be interested in understanding why grammatical errors in a post methods era where functional linguistics plays a fundamental role is so important. You can have a very coherent paragraph with tense errors, but your work will not make sense if your tenses are right and your paragraph is all over the place.” (R.23)
“Yes, we would be willing to, particularly many of our colleagues came from different cultural and ethnic backgrounds.” (R.25)
“Yes, given that native English speakers make just as many.” (R.24)
“Yes, as long as the errors don’t impact on the meaning and/or context of the situation.” (R.38)
Accepting a person who does not speak English fluently was considered to be a high-stakes decision, with 56% (n=8) of participants considering that there would be negative consequences if mistakes were made in the real-world context. In terms of the transition from academia to the workplace, these findings are relatable to those of Knoch et al. (2016) who found that stakeholders considered that IELTS candidates would struggle with the ability to translate theoretical applications (e.g. essay writing) into real-life situations (e.g., workplace documentation).
10.7.1 Identified risks in the workplace
When asked about risk concerns in the workplace, a number of significant risks (62%, n=8) were identified within the workplace (see Table 31) with varying results as to what these were.
Table 31: Risks in the workplace as a concern
| Risks | Percentage | n | Job role and organisation |
|---|---|---|---|
| Yes | 62% | 8 | Academic - University (n=2) Manager - University (n=2) Administration - University or Other (n=2) Other - Government Agency or Registration Body (n=2) |
| Maybe | 15% | 2 | Academic - University (n=2) |
| No | 23% | 3 | Academic - ELICOS or University (n=2) Other (n=1) |
One participant commented on this issue:
“In healthcare, it can mean the difference between life and death if communication is poor due to poor English…Communication issues where there has been a poor outcome have resulted in a notification to the regulatory authority.” [Other-Government Agency] (R.21)
Of note was that administrators, academics, and managerial staff were able to identify such risks and, as such, stakeholder engagement and feedback may be an untapped resource for identifying risks, and therefore, for quality control from an organisationa perspective.
10.7.2 Abilities
This section considers the abilities of IELTS test-takers, and focuses on the core concepts of competency and skill, and the expectations stakeholders have of the individual rather than of IELTS. Again, this relates to the risk involved with ensuring that people with an IELTS qualification have the requisite English-language skills for the IELTS band they had achieved.
In considering competency and skillset, the respondents clearly acknowledged that practising English was crucial.
“Improvement is sometimes evident over the course of the degree…it very much depends. Some are outstanding, others are very inadequate. There is a worrying divergence by location…comments that x is unemployable and our standards have slipped.” (R.22)
“Of course, if they decide to go back to their country without continuing their English studies? Students who enter university and have used IELTS scores for their entry, often improve their English language skills considerably as they are required to demonstrate their discipline knowledge and understanding in English as they progress in their course.” (R.23)
“It depends, it can if the English speaker is not using English…Occasional comments are made by tutors.” (R.28)
“If they do not have the opportunity to practice the language, it can decline.” (R.32)
“Definitely, they need to live with other English-speaking people so they are continually exposed to the language and can continually practice it.” (R.38)
These responses reflect findings by Knoch et al. (2014), Knoch et al. (2015), and Serrano et al. (2012). They found in their longitudinal studies that fluency (measured by word count) increases over time. Knoch et al. (2015) were careful to note that writing opportunities were obtained by their participants both inside and outside of the academic setting. Knoch et al.’s (2015) interview data provided further illumination in relation to lack of improvement in terms of writing, with participants having few writing requirements throughout their degree (p 50).
10.7.3 Effectiveness of IELTS entry requirement in the workplace
This section considers outcomes in the workplace in relation to the effectiveness of IELTS entry requirements. Outcomes identified ranged from misunderstandings to litigation (although it was unclear whether this was aimed at the individual or the organisation), and poor patient outcomes. These identified outcomes bear sustained examination and are recommended for further research.
“Lack of clarity on tasks, for example, misunderstandings about required outcomes.” (R.7)
“Poor health outcomes, medication errors or even death.” (R.21)
“Low student experience; frustrated students and lecturers; reduction in course content (‘dumbing down’) to allow ‘enough’ students to pass.” (R.24)
“It may cause misunderstanding, inaccurate interpretation to delay our assessment process.” (R.25)
“Miscommunication and distortion of facts.” (R.33).
“It definitely impacts on their progression through our courses.” (R.38)
As can be seen, a number of risk factors and negative outcomes were identified in this section, which clearly need to be managed by stakeholders.
10.7.4 Decision risk
Discussion on arbitrary benchmarks and lack of consultation on admission requirements was seen primarily from respondents who worked in the tertiary setting. In a risk situation, choices about appropriate risk levels will be disputed. However, it should be noted that the benchmarks for these risk levels are often put in place by the organisation which may not be using recommended band scores suggested by IELTS. This supports the issues raised, and in part the recommendations made, by Merrifield (2016). Criticisms were made of the benchmarks that were in place and how they were chosen:
“IELTS tends to be a rather arbitrary benchmark which some students are able to study for very successfully.” (R.34)
“What is deemed to be an appropriate level of English language skills for studying in Australia appears to be more a function of business decisions than of academic considerations. This leads to a risk in student experience, as well as frustration for both students and academics.” (R.24)
“It seems to me that a number of students with acceptable IELTS still struggle with their English comprehension and writing.” (R.38)
“Experience raises questions about the integrity of the system.” (R.22)
“As I said previously, we are looking at raising the entry requirement to 7.0, but for some reason, this requirement hasn’t yet gone through.” (R.38)
A number of these criticisms are somewhat concerning in relation to managing risk. For example, the first comment reveals a stakeholder perception that IELTS is an arbitrary benchmark. This comment represents a lack of confidence in the IELTS test and a lack of understanding of how much work is undertaken by the IELTS organisation to ensure that the test is not arbitrary.
10.8 A necessary benchmark
Despite the perception of arbitrary benchmarks, the IELTS test was considered to be a necessary hurdle (see Table 32) for entry into stakeholder environments, and was therefore an enabling factor for both the organisation and the individual as well as a risk mitigation factor. These findings are similar to those of Gribble et al. (2016) and Chan and Taylor (2020). Participants wrote:
“IELTS is widely used and recognised across the sector and has been for many years. It is an essential benchmark. Language testing is complex and it is impossible to accurately define every individual person’s proficiency.” (R.7)
“From our understanding, the IELTS Reading module usually contains 1-2 scientific and technological articles to require the candidate to answer 20-40 questions. As a peak professional body, we love to see these components to evaluate the candidate’s engineering, scientific and technological knowledge.” (R.25)
Another risk that can be identified here is apparent at the end of the second quote above, in which a stakeholder representing a peak professional body has stated that some components of the IELTS test help the organisation to “evaluate the candidate’s engineering, scientific, and technological knowledge”, which is clearly not what the IELTS test is made for, and certainly not what the IELTS organisation would claim that the test is able to do.
Table 32: IELTS as an appropriate indicator of language proficiency
| Appropriate benchmark | Percentage | n |
|---|---|---|
| Yes | 59% | 10 |
| No | 6% | 1 |
| Maybe | 29% | 5 |
| Unsure | 6% | 1 |
| Total | 100% | 17 |
As can be seen in Table 33, respondents (54%, n=7) were definitely or probably sure that the IELTS test ensured that candidates would subsequently have the competency to work in the environment in which the assessment was applied (e.g., with the public, patients, and staff), while (46%, n=6) were unsure. Again, this is an issue to be managed by stakeholders as this level of uncertainty can pose a risk to stakeholder organisations, particularly in terms of organisational cohesion, and the confidence that organisations have in relation to employee interaction with the public.
Table 33: Stakeholder perceptions of assessment fit
| Interface competency | Percentage | n |
|---|---|---|
| Definitely yes | 8% | 1 |
| Probably yes | 46% | 6 |
| Maybe | 46% | 6 |
| Probably not | 0% | 0 |
| Definitely not | 0% | 0 |
| Total | 100% | 13 |
10.9 Communication
Respondents made the following comments on the ability of people who had passed the IELTS test to perform in the stakeholder setting. Note that they identified that there could be several factors that affect communication upon entry into an organisation, and they wrote about accent, confidence, telephone skills, and difficulty with expression:
“Students have different strengths and levels of confidence with speaking English in different situations.” (R.7)
“Yes - still don’t necessarily speak flawless English. Accents can be a big barrier.” (R.21)
“Yes, we have. Occasionally we do receive phone calls from our clients to inquire about the skills assessment status. During the phone conversation, we found some clients had some difficulties in expressing themselves.” (R.25)
“Yes, a student who submitted an IELTS exam result and met the English language requirements was unable to communicate and could not complete the program. This was a once-off scenario and is not a common occurrence.” (R.28)
“Could be for a number of reasons, e.g., they didn’t take the exam, or they have not been able to maintain their English proficiency through lack of practice.” (R.38)
Revisiting an earlier theme, but relating it to communication here, there were several beneficial outcomes that stakeholders identified in relation to multicultural/multilingua workers. It was found that 67% (n=8) of respondents said that their workplace actively sought out functional multicultural/ multilingual workers. Furthermore, 50% (n=6) of respondents stated that their workplace sought to understand the communication needs of their multicultural/multilingual workers; however, 17% (n=2) disagreed that this was the case.
Of note, 92% (n=11) of respondents thought that stakeholders benefited from having functional multicultural/multilingual workers. One respondent commented: “As a skills assessing team, we have benefited so much from the multicultural and multilingual in the workplace.” (R.25) This backs up Moore et al.’s (2015, p 28) findings that “non-Anglophone graduates could often be selected for positions primarily for reasons other than their communicative proficiency, including…the cultural familiarity they had with particular client/customer bases of an organisation”.
11 SUMMARY OF STAKEHOLDER RESULTS
In summary, the stakeholder survey indicates a strong overall relationship between test scores and risk, and the presentation of error rates caused a re-think of their current IELTS requirements. Also, more generally, respondents wanted more control over language assessment and wanted to see IELTS scores raised. Some wanted further decision-making capacity when setting minimum scores, although this varied across settings and by employment role. This is marked as an issue for further research. There was also a general trend towards wanting higher minimum scores than currently existed in order to mitigate the risks posed to the organisation and, similar to Smith and Haslett (2007, p 27), many felt the scores should be higher, or were at least unsure that their organisation was using appropriate scores.
Another point worth noting is the high number of organisations who did not consult with the IELTS organisation about their own organisational risk and documentation requirements. This indicates that organisations need to be reminded that IELTS undertakes research every year to ensure the integrity and quality of the test, and therefore, that it can only be of benefit to organisations to closely liaise with the IELTS organisation and follow the guidelines given.
There is a clear disconnect by the respondents between minimum IELTS scores and the risks posed for the organisation. To this end, it is clear that there are English proficiency standards that stakeholders expect. This is why the stakeholder perception of the IELTS test results being ‘arbitrary’ is concerning. Organisations may need to be made aware of the effort put in by the IELTS organisation to ensure that the test is not arbitrary, and that the determination of benchmarks can proceed through a number of reliable mechanisms, including liaison with the IELTS organisation and with relevant government departments.
Communication was another important aspect related to risk. Language assessment was found to minimise the risk exposure to the organisation (70%, n=6). Communication issues identified by stakeholders included accents, phone skills, and difficulties with expression. While the results demonstrated that respondents valued their multilingual workplace colleagues, the fact remained that they were unsure, and thus uncertain, about the language competency levels of their colleagues to function in the workplace environment. Therefore, it could be argued that stakeholders value the multicultura workplace, but do not want to sacrifice safety or face the inherent risks they have identified.
12 KNOWLEDGE TRANSLATION AND RECOMMENDATIONS
This study set out to establish the minimum grammatical error rates to be expected of eight parts of speech (and their 33 subtypes) for each IELTS half-band score between 5.5 and 7.5, and if any patterns emerged across the IELTS bands. This study also explored stakeholders’ understanding of language and language testing, and how knowledge of error (compared to a test score alone) changed their perceptions about the minimum test scores. It asked about organisations’ communicative requirements and risk perceptions.
12.1 Errors
Before the findings about error are summarised, it needs to be emphasised that the methodology counted only the barest minimum grammatical error counts and did not measure other features of communication which may cause issues. As such, the representation of error and miscommunication in real life will be higher and more complex than presented here.
Our study found that fewer errors were found overall with higher test scores (similar to Barkaoui, 2016). Our study average of 8.5% errors was much higher than Barkaoui’s 3 grammatical errors per 100 words, but it is unknown how and what Barkaoui counted, given their focus on all dimensions of the IELTS writing test rather than just grammar. We found that grammatical error rates reduced as IELTS scores increased, as follows: 5.5 (14.8%), 6.0 (10.1%), 6.5 (8.3%), 7.0 (6.0%), and 7.5 (4.9%). Thus, IELTS 5.5 writers are making more than 1 grammatical error every 7 words, and IELTS 7.5 writers are making nearly 1 grammatical error every 20 words. The latter is a notably high error rate, and the type of error is crucial because it may or not affect communication. In high-stakes environments, for example, communication should not rely on the receiver having to repair errors in order to understand errors.
Despite the overall average improvement, there was a notable ‘churn’ that occurred among the error types at 6.5 and 7.0. Previously, there had been a clear linear improvement, but at 6.5 and 7.0, there was a mixture of slight regression and slower improvement that was not repeated for the other bands.
Stability was restored again at 7.5, which tends to support the IELTS test-maker recommendations that the English of people with this score will be acceptable for all purposes. This finding should be of concern to stakeholders using IELTS scores below 7.5. While the incident rate ratios indicate that all grammatical types improved between IELTS 7.0 and 7.5, significant differences were only found for nouns and adverbs. This is because the confidence intervals are very wide for verbs, determiners, pronouns, adjectives, prepositions, and conjunctions, indicating substantial variability in individual ability. This is a less than ideal situation when trying to minimise risk.
There are reasons why IELTS 6.5/7.0 ‘churn’ occurs. First, it is proposed that people start to think in English around IELTS 7.0 (Hogan, cited in Birrell, 2006; Craven, 2012) rather than relying on translation as a major strategy to produce English. The findings in this study point to a possible cognitive shift taking place at the expense of grammatical subtype accuracy. Vercellotti (2017) points to cognitive-based reasons why performance might go backwards, based on competition for cognitive resources. The problem is that, in order to improve language skills, a person must try new formulations, and the chances of having wrong output increase in this situation of attempting growth, in preference to repeating tried and (mostly) successful formulations. Growth sometimes also means un-learning some of the habits formed to ‘get by’, or at least evaluating and modifying existing habits. Another point in Vercellotti’s (2017) literature summary is that accuracy development is possibly affected by improvements in the areas of lexis and fluency. Proficient language users (higher vocabulary and fluency) may well “not continue to develop grammatical accuracy because of proactive interference, in which learning to communicate interferes with the ability to subsequently learn how to communicate with accuracy” (Vercellotti, 2017, p 94), but she was not able to substantiate these claims in her own study and suggested caution about accuracy measures based on clause length. It is also possible that particular grammatical subtypes might be affected by first language background and its interference with second language acquisition, causing fossilization, as evident in a regression or plateau in improvement. Currently, first language background is not considered when thinking about stakeholder contexts, but it might be that a particular type of error typical of a first-language background will negatively affect performance. Furthermore, the issue of needing to think in English for linguistically demanding environments was not considered by stakeholders (probably because this cannot easily be measured empirically).
The average distribution of errors across all texts were: determiners (12.5%), verbs (8.8%), pronouns (8.7%), prepositions (8.3%), nouns (8.1%), conjunctions (7.5%), adverbs (6.7%) and adjectives (5.2%). However, the average distribution of grammatical types across all texts were: nouns (25.6%), verbs (22.0%), prepositions (15.2%), determiners (13.2%), adjectives (9.6%), adverbs (6.3%), pronouns (4.4%), and conjunctions (3.7%). Some subtypes of error extinguished altogether: possessive wh-pronouns, same plural nouns, predeterminers, and superlative adverbs. Some subtypes of errors remained very high: personal wh-pronouns, possessive endings, and proper singular nouns. Particular errors jumped back up in rate at IELTS 7.5: proper nouns, existential ‘there’, infinitival ‘to’, verbs in their base and past participle forms, and pronouns in possessive, personal, and wh- forms.
A person’s first language was found to affect the grammatical error rate. This meant that some first-language backgrounds had higher error rates than other language backgrounds, despite obtaining the same IELTS score. Italian speakers had the lowest error rates overall. Arabic speakers may have started with the worst error rates at IELTS 5.5, but they consistently improved and ended up with the second-best rates at IELTS 7.5. Chinese speakers had the second-best error rates at IELTS 5.5, but had the worst error rates of all groups at IELTS 7.5. Italian and Russian speakers remained first and third place throughout. Regression occurs for Chinese and Russian speakers at IELTS 6.5, then for Italian and Arabic speakers at IELTS 7.0, and a second regression occurs for the Chinese speakers at IELTS 7.5.
The research informs teachers about which error types need to be targeted (Müller, Gregoric, & Rowland, 2017), thus also informing student support services and educationalists about areas of need to be targeted according to which band the student sits on and what first language they have. More information on what linguistic areas most need improvement, such as specific parts of grammar, would help organisational stakeholders target their resources to better support students.
12.2 Stakeholders
Overall, stakeholders showed awareness of the range of language tests available to them, and had some knowledge about language change. They felt IELTS served an important role in managing risk, but not every organisation engaged with IELTS to help them set their IELTS benchmarks. It also seemed that the people setting the standards were not necessarily the ones who wanted that task, and others who may be better positioned to do this were not put in a position to advise on the minimum standards.
Good communication skills were universally valued, and a range of negative consequences (sometimes very serious) were identified if miscommunication were to occur. Stakeholders definitely valued their multicultural workplaces. However, they still held uncertainty about the communicative competency of those who do not have English as a first language, at least when framing performance in terms of risk. Many stakeholders either wanted higher IELTS scores, or were unsure that the current ones should be retained. Thus, stakeholders value the multicultural workplace, but do not want to sacrifice safety or face the inherent risks they have identified.
Knowledge of error rate and types of error made at each level destabilised stakeholder confidence in the current organisational requirements for IELTS scores, with many suggesting that higher IELTS score requirements were needed after viewing a selection of the results of the first part of this study. This is not to say that error rates were the only factor underlying the desire for higher scores. There was also a pre-existing doubt about the adequacy of IELTS standards in their organisation for some, but the error rates tended to concretise their concerns.
Finally, it was particularly interesting to see how stakeholders rated their expectations of written error among English as a first language speakers and those with English as a second language. There was a bias, perhaps a generosity for high-level English as a Second-Language users, and harsher judgement of writers who had English as a first language. Their estimations of error rate greatly overshot the error rates found in the first part of this study; however, given that this study offered only the minimum error rate, and there may be other factors that contributed to the conflated estimates seen among stakeholders (there was little agreement between individuals on their estimations), more research could be done in this area.
12.3 Language educators and linguists
This study has a value for linguists and language educators because of the rich data provided by the error rates and their patterning fluctuations across the half-bands. Progress, it seems, is not linear and the results form some empirical evidence about the slower gains at higher levels. The data can contribute to the development of second language acquisition theory, and is particularly supportive of arguments about cognitive restructuring, destabilisation of output, and fossilization.
The results showed significant grammatical variation between candidates from different language backgrounds, despite receiving the same final test score, and they gained the same test score because IELTS Writing measures performance on four dimensions, with grammatical error being only one these. Good performance in the other three dimensions would compensate for grammatical errors.
Thus, language background seems to be important in both the language classroom and testing arena when considering grammatical competency. Intuitively, educators and test assessors may have sensed, or even informally observed, patterning according language background or country, but this study indicates how factors other than improving a basic language skill like grammatical competence may be leveraged in order to improve communication. The question, though, is how far does that take the individual if put in high-stakes contexts where grammatical accuracy, and indeed lexical precision, are required? The second part of the study informs this question and reveals the concern of many stakeholders. The data that is informative for not only educators in specialised professions such as health, aviation, engineering, and so forth, but also for the professions themselves and how they set standards.
This study may also have application in providing guidance for the professional development of teachers involved in IELTS preparation courses. Additionally, the IELTS organisation might consider the value of giving examples of error types and rates of each half band to stakeholders. Rather than relying on an abstract score to communicate results, examples are helpful-especially when an increment of ‘half a band’ appears to be a small number and shifting down a half-band in standards can seem inconsequential.
12.4 Final words
This study focused on grammatical skills as a key indicator of linguistic ability, so focused on establishing the minimum number of grammatical errors for each half band between 5.5 and 7.5, the typical range of minimum scores required for educational admission and professional registration. The study also looked for patterns of change across those bands, finding that the rates of improvement were much slower at the higher bands, and there is a stage of instability around the middle scores. The study then leveraged grammatical error rates to draw out stakeholder opinions about what standards they set, and enquired about how such standards were set and how this related to risk.
This report raises the bar for other tests which do not provide precise information about error rates by type and test score, which helps stakeholders link acceptable error rates and error types to risk. This is especially important for risk-averse institutions.
References
- Abe, M., & Tono, Y. 2005. Variations in L2 spoken and written English: Investigating patterns of grammatical errors across proficiency levels. Paper presented at the Corpus Linguistics Conference Series 1.1. Corpus Linguistics 2005.
- Ahern, S. 2009. ‘“Like cars or breakfast cereal”, IELTS and the trade in education and immigration’, TESOL Context, vol 19, no 1, pp 39-51.
- Arkoudis, S., Baik, C., & Richardson, S. 2012. English Language Standards in Higher Education. Acer Press, Camberwell.
- Australian Nursing and Midwifery Council. 2019. Registered Nurse Accreditation Standards 2019. Australian Nursing and Midwifery Council, ACT. Available: https://www.anmac.org.au/sites/default/files/documents/ registerednurseaccreditationstandards2019_0.pdf [Accessed 4 December 2021].
- Banerjee, J., Franceschina, F., & Smith, A. M. 2007. ‘Documenting features of written language production typical at different IELTS band score levels’, IELTS Research Reports, vol 7, pp 1-69. IELTS Australia and British Council. Available: https://www.ielts. org/for-researchers/research-reports/volume-07-report-5 [Accessed 5 July 2020].
- Barkaoui, K. 2016. ‘What changes and what doesn’t? An examination of changes in the linguistic characteristics of IELTS repeaters Writing Task 2 scripts’, IELTS Research Reports, vol 3, p 1-55. IELTS Australia Pty Ltd. Available: https://www.ielts.org/forresearchers/research-reports/online-series-2016-3 [Accessed 5 July 2020].
- Beck, U. 1997. The Reinvention of Politics: Rethinking Modernity in the Global Social Order. Polity Press, Massachusetts.
- Beck, U. 1999. World Risk Society. Polity Press, Cambridge.
- Birrell, B. 2006. ‘Implication of low English standards among overseas students at Australian universities’, People and Place, vol 14, no 4, pp 53-64. Available: http://arrow.monash.edu.au/hdl/1959.1/481827 [Accessed 18 December 18, 2013].
- Cambridge ESOL. 2004. ‘IELTS - some frequently asked questions’, Research Notes, vol 18, pp 14-17. Available: http://www.cambridgeenglish.org/images/23135-researchnotes-18.pdf [Accessed 21 May 2013].
- Casal, J. E., & Lee, J. J. 2019. ‘Syntactic complexity and writing quality in assessed first-year L2 Writing’. Journal of Second Language Writing, vol 44, pp 51-62.
- Chan, S., & Taylor, L. 2020. ‘Comparing writing proficiency assessments used in professional medical registration: a methodology to inform policy and practice’, Assessing Writing, vol 46, p 100493 [1-12].
- Chomsky, N. 2012. ‘Poverty of stimulus: Unfinished business’, Studies in Chinese Linguistics, vol 33, no 1, pp 3-16.
- Coleman, D., Starfield, S., & Hagan, A. 2004. ‘The attitudes of IELTS stakeholders: Student and staff perceptions of IELTS in Australian, UK and Chinese tertiary institutions’, IELTS Research Reports, vol 4, pp 160-235. IELTS Australia Pty Ltd. Available: https://www.ielts.org/for-researchers/research-reports/volume-05-report-4 [Accessed 5 July 2020].
- Connor, U. 1996. Contrastive Rhetoric: Cross-Cultural Aspects of Second Language Writing. Cambridge University Press: Cambridge.
- Connor, U. 2018. ‘Intercultural Rhetoric’. In J. I. Liontas, T. International Association and M. DelliCarpini (eds.), The TESOL Encyclopedia of English Language Teaching, pp 1-7. Wiley: Hoboken, USA.
- Cooper, T. 2013. ‘Can IELTS writing scores predict university performance? Comparing the use of lexical bundles in IELTS writing tests and first-year academic writing’, Stellenbosch Papers in Linguistics Plus, vol 42, pp 63-79. doi: 10.5842/42-0-155
- Craven, E. 2012. ‘The quest for IELTS Band 7.0: Investigating English language proficiency development of international students at an Australian university’, IELTS Research Reports, vol 13, pp 1-61. IDP: IELTS Australia and British Council. Available: https://www.ielts.org/for-researchers/research-reports/volume-13-report-2 [Accessed 5 July 2020].
- Cotton, F., & Wilson, K. 2008. ‘An investigation of examiner rating of coherence and cohesion in the IELTS Academic Writing Task 2’, IELTS Research Reports, vol 12, pp 1-76. IDP: IELTS Australia and British Council. Available: https://www.ielts.org/-/media/research-reports/ielts_rr_volume12_report6.ashx [Accessed 2 December 2020].
- Dagut, M. B., & Laufer, B. 1982. ‘How intralingual are “intralingual errors”?’ in Error Analysis, Contrastive Linguistics and Second Language Learning, eds C. Nickel & D. Nehls, IRAL: International Review of Applied Linguistics in Language Teaching: Special Issue, Groos, p 19-42.
- Daller, M. H., & Phelan, D. 2013. ‘Predicting international student study success’, Applied Linguistics Review, vol 4, no 1, pp 173-193.
- Darus, S., & Ching, K. H. 2009. ‘Common errors in written English essays of form one Chinese students: A case study’, European Journal of Social Sciences, vol 10, pp 242-253.
- Dye, C., Kedar, Y., & Lust, B. 2019. ‘From lexical to functional categories: New foundations for the study of language development’, First Language, vol 39, no 1, pp 9-32.
- Elder, C., Pill, J., Woodward-Kron, R., McNamara, T., Manias, E., Webb, G., & McColl, G. 2012. ‘Health professionals’ views of communication: Implications for assessing performance on a health-specific English language test, TESOL Quarterly, vol 46, no 2, pp 409-419.
- Elder, C., McNamara, T., Woodward-Kron, R., Manias, E., McColl, G., Webb, G., Pill, J., & O’Hagan, S. 2013. ‘Developing and validating language proficiency standards for non-native English speaking health professionals’, Papers in Language Testing and Assessment, vol 2, no 1, pp 66-70.
- Elliott, A. 2002. ‘Beck’s sociology of risk: a critical assessment’, Sociology, vol 36, pp 293-315.
- Ellis, R. 2010. The Study of Second Language Acquisition, 2nd ed. Oxford University Press, Oxford.
- Ferris, D. 2011. Treatment of Error in Second Language Student Writing, 2nd ed. The University of Michigan Press, Michigan, USA.
- Fischhoff, B., Watson, S., & Hope, C. 1984. ‘Defining risk’, Policy Sciences, vol 17, pp 123-139.
- Forsberg, F., & Bartning, I. 2010. ‘Can linguistic features discriminate between the communicative CEFR-levels? A pilot study of written L2 French’, EUROSLA Monographs Series, vol 1, pp 133-158.
- Golder, K., Reeder, K., & Flemming, S. 2011. ‘Determination of appropriate IELTS writing and speaking band scores for admission into two programs at a Canadian postsecondary polytechnic institution’, The Canadian Journal of Applied Linguistics, vol 14, no 1, pp 222-250.
- Granger, S. 2008. ‘Learner corpora in foreign language education’, in Encyclopedia of Language and Education, eds NH Hornberger. Springer, Boston, MA. https://doi.org/10.1007/978-0-387-30424-3_109.
- Green, A. 2005. ‘EAP study recommendations and score gains on the IELTS Academic writing test’, Assessing Writing, vol 10, pp 44-60. doi:10.1016/j.asw.2005.02.002
- Gribble, C., Blackmore, J., Morrissey, A., & Capic, T. 2016. ‘Investigating the use of IELTS in determining employment, migration and professional registration outcomes in healthcare and early childcare education in Australia’, IELTS Research Reports, vol 4, pp 1-58. IELTS Australia Pty Ltd. Available: https://www.ielts.org/for-researchers/ research-reports/online-series-2016-4 [Accessed 5 July 2020].
- Halliday, M. A. K., & Mathiessen, C. 1999. Construing Experience through Meaning: A Language Based Approach to Cognition. Cassell, London.
- Han, W. 2013. Word Order Typology: Topic and Topic Marker Structure. Foreign Language Education Press, Shanghai.
- Han, Z-H. 2009. ‘Interlanguage and fossilization: Towards an analytic model’, in Contemporary Applied Linguistics Vol. I: Language Teaching and Learning, eds V. Cook & L. Wei, pp 137-162. Continuum, London.
- Han, W., Brebner, C., & McAllister, S. 2016. ‘Redefining ‘Chinese’ L1 in SLPconsiderations for the assessment of Chinese bilingual-bidialectal language skills’, International Journal of Speech-Language Pathology, vol 18, no 2, pp 135-146.
- Hawkins, J., & Buttery, P. 2010. ‘Critical features in learner corpora: Theory and illustrations’, English Profile Journal, vol 1, pp 1-23.
- Haznedar, B. 2019. ‘Morpho-syntactic properties of simultaneous bilingualism: Evidence from bilingual English-Turkish, International Journal of Bilingualism, vol 23, no 4, pp 793-803.
- Humphreys, P., Haugh, Fenton-Smith, M., Lobo, A., Michael, R., & Walkinshaw, I. 2012. ‘Tracking international students’, English proficiency over the first semester of undergraduate study’, IELTS Research Reports, vol 4, pp 1-41. IELTS Australia Pty Ltd. Available: https://www.ielts.org/for-researchers/research-reports/online-series-2012-1 [Accessed 5 July 2020].
- Hyatt, D. 2013. ‘Stakeholders’ perceptions of IELTS as an entry requirement for higher education in the UK’, Journal of Further and Higher Education, vol 37, no 6, pp 844-863.
- Hyatt, D., & Brooks, G. 2009. ‘Investigating stakeholder’s perceptions of IELTS as an entry requirement for higher education in the UK’, IELTS Research Reports, vol 10, p 1-50. IELTS Australia and British Council. Available: http://www.ielts.org/pdf/Vol10_ Report1.pdf [Accessed 21 May 2014].
- IDP: IELTS International English Language Testing System. 2021. IELTS Academic Writing, Available: https://ielts.idp.com/prepare/academic-writing [Accessed 15 September 2021].
- International English Language Testing System. 2018. Setting IELTS Entry Scores. Available: https://www.ielts.org/ielts-for-organisations/setting-ielts-entry-scores [Accessed: 22 June 2018].
- Kaplan, R. 1966. ‘Cultural thought patterns in intercultural education’, Language Learning, vol 16, pp 1-2.
- Knoch, U., May, L., McQueen, S., Pill, J., & Storch, N. 2016. ‘Transitioning from university to the workplace: Stakeholder perceptions of academic and professional writing demands’, IELTS Research Reports, vol 1, pp 1-37. IELTS Australia Pty Ltd. Available: https://www.ielts.org/for-researchers/research-reports/online-series-2012-1 [Accessed 5 July 2020].
- Knoch, U., Rouhshad, A., Oon, S. P., & Storch, N. 2015. ‘What happens to ESL students writing after three years of study at an English medium university?’, Journal of Second Language Writing, vol 28, pp 39-52.
- Knoch, U., Rouhshad, A., & Storch, N. 2014. ‘Does the writing of undergraduate ESL students develop after one year of study in an English- medium university?’, Assessing Writing, vol 21, no 1, pp 1-17. http://dx.doi.org/10.1016/j.asw.2014.01.001.
- Larsen-Freeman, D. 2006. Second language acquisition and the issue of fossilization: There is no end, and there is no state. In Z. Han & T. Odlin (Eds.), Studies of Fossilization in Second Language Acquisition (pp. 189-200). Multilingual Matters: Clevedon, England.
- Lasnik, H., & Lidz, J. 2016. ‘The argument from the poverty of stimulus’. In I. Roberts (Ed), The Oxford Handbook of Universal Grammar, pp 1-33, Oxford University Press, Oxford.
- Liddy, C., Wiens, M., & Hogg, W. 2011. ‘Methods to achieve high interrater reliability in data collection from primary care medical records’, Annals of Family Medicine, vol 9, no 1, pp 57-62. https://doi.org/10.1370/afm.1195
- Lyons, J. 1977. Semantics. Cambridge University Press, Cambridge.
- Manning, C. D. 2011. Part-of-Speech Tagging from 97% to 100%: Is it time for some linguistics? Available: https://nlp.stanford.edu/pubs/CICLing2011-manning-tagging.pdf [Accessed 7 Feb 2022]
- Matthews, P. 2001. A Short History of Structural Linguistics. Cambridge University Press, Cambridge.
- Mayor, B., Hewings, A., North, S., Swann, J., & Coffin, C. 2002. A Linguistic Analysis of Chinese and Greek L1 Scripts for IELTS Academic Writing Task 2, IELTS British Council Research Program, UK.
- Merrifield, G. 2016. ‘An impact study into the use of IELTS by professional associations in the United Kingdom, Canada, Australia and New Zealand, 2014 to 2015’, IELTS Research Reports, vol 7, pp 1-35. IELTS Australia and British Council. Available: https://www.ielts.org/for-researchers/research-reports/ielts_online_rr_2016-7 [Accessed 5 July 2020].
- Moon, G. 2000. ‘Risk and protection: the discourse of confinement in contemporary mental health policy’, Health & Place, vol 6, pp 239-250.
- Moore, T. 2015. ‘Literacy practices in the professional workplace: Implications for the IELTS reading and writing tests’, IELTS Research Reports, vol 1, pp 1-46. IELTS Australia Pty Ltd. Available: https://www.ielts.org/for-researchers/research-reports/onlineseries-2015-1 [Accessed 5 July 2020].
- Müller, A. 2015. ‘The differences in error rate and type between IELTS writing bands and their impact on academic workload’, Higher Education Research & Development. doi: 10.1080/07294360.2015.1024627
- Müller, A., & Daller, M. 2019. ‘Predicting international students’ clinical and academic grades using two language tests (IELTS and C-test): A correlational research study’, Nurse Education Today, vol 72, pp 6-11.
- Müller, A., Gregoric, C., & Rowland, D. R. 2017. ‘The impact of explicit instruction and corrective feedback on ESL postgraduate students’ grammar in academic writing, Journal of Academic Language and Learning, vol 11, no1, pp A125-A144.
- Nursing and Midwifery Board of Australia. 2019. Registration Standard: English Language Skills, Nursing and Midwifery Board of Australia, Victoria. Available: https://www.nursingmidwiferyboard.gov.au/documents/default. aspx?record=WD19%2f28849&dbid=AP&chksum=iQZigaacCzjnlAMcvGDb7Q%3d%3d [Accessed 5 December 2021].
- O’Loughlin, K. 2011. ‘The interpretation and use of proficiency test scores in university selection: How valid and ethical are they?’, Language Assessment Quarterly, vol 8, no 2, pp 146-160. doi: 10.1080/15434303.2011.564698
- O’Loughlin, K. 2013. ‘Developing the assessment literacy of university proficiency test users’, Language Testing, vol 30, no 3, pp 363-380.
- O’Neill, T. R., Buckendahl, C. W., Plake, B. S., & Taylor, L. 2007. ‘Recommending a nursing-specific passing standard for the IELTS examination’, Language Assessment Quarterly, vol 4, no 4, pp 295-317.
- O’Neill, T. R. 2011. ‘From language classroom to clinical context: The role of language and culture in communication for nurses using English as a second language’, International Journal of Nursing Studies, vol 48, pp 1120-1128. doi: 10.1016/j.ijnurstu.2011.02.008
- Ortega, L. 2015. ‘Syntactic complexity in L2 writing: Progress and expansion’, Journal of Second Language Writing, vol 29, pp 82-94.
- Pienemann, M. 1998. Language Processing and Second Language Development: Processability Theory. John Benjamins: Amsterdam, Netherlands.
- Rea-Dickins, P., Kiely, R., & Yu, G. 2007. ‘Student identity, learning and progression: The affective and academic impact of IELTS on ‘successful’ candidates’, IELTS Research Reports, vol 7, p 1-78. IELTS Australia and British Council. Available: http://www.ielts.org/ PDF/Vol7_Report2.pdf [Accessed 21 May 2014]
- Read, J., & Wette, R. 2006. ‘Achieving English proficiency for professional registration: The experience of overseas-qualified health professionals in the New Zealand context’, IELTS Research Reports, vol 10, pp 1-42. IELTS Australia and British Council. Available: https://www.ielts.org/for-researchers/research-reports/volume-10-report-4 [Accessed 5 July 2020].
- Rumsey, M., Thiessen, J., Buchan, J., & Daly, J. 2016. ‘The consequences of English language testing for international health professionals and students: An Australian case study’, International Journal of Nursing Studies, vol 54, pp 95-103.
- Sato, T., & McNamara, T. 2019. ‘What counts in second language oral communication ability? The perspective of linguistic laypersons’, Applied Linguistics, vol 40, no 6, pp 894-916.
- Serrano, R., Tragant, E., & Lanes, A. 2012. ‘A longitudinal analysis of the effects of one year abroad’, Canadian Modern Language Review, vol 68, pp 138-163.
- Scott, A., Doughty, C., & Kahi, H. 2011. ‘Having those conversations’: The politics of risk in peer support practice,’ Health Sociology Review, vol 20, pp 187-201.
- Selinker, L. 1996. Fossilization: What We Think We Know. Longman Group UK Limited, London.
- Slovic, P. 2007. Perception of Risk. Earthscan, London.
- Smith, H., & Haslett, S. 2007. ‘Attitudes of tertiary key decision-makers towards English language tests in Aotearoa New Zealand: Report on the results of a national provider survey’, IELTS Research Reports, vol 7, pp 1-44. IELTS Australia and British Council. Available: http://www.ielts.org/pdf/Vol7,Report1.pdf [Accessed 21 May 2014]
- Swan, M., & Smith, B. 2001. Learner English, 2nd ed. Cambridge University Press, Cambridge.
- Tarone, E. 2006. ‘Fossilization, social context and language play’. In Z. H. Han & T. Odlin (Eds.), Studies of Fossilization in Second Language Acquisition (pp 157-172). Multilingual Matters: Clevedon.
- Terwijn, R., Pearce, S., & Rogers-Clark, C. 2012. ‘A systematic review of the experiences of undergraduate nursing students choosing to study at an English speaking university outside their homeland’, JBI Library of Systematic Reviews (JBI000476), vol 10, no 2, pp 66-186.
- Thewissen, J. 2012. Accuracy across Proficiency Levels: Insights from Error-tagged EFL Learner Corpus. Doctoral thesis, Universite Catholique de Louvain, Louvain-la-Neuve, Belgium.
- Trenkic, D., & Warmington, M. 2018. ‘Language and literacy skills of home and international university students: How different are they and does it matter?’, Bilingualism: Language and Cognition, vol 22, no 2, pp 349-365.
- Vercellotti, M. L. 2017. ‘The development of complexity, accuracy, and fluency in second language performance: A longitudinal study’, Applied Linguistics, vol 38, no 1, pp 90-111.
- Washburn, G. N. 1991. Fossilization in Second Language Acquisition: A Vygotskian Perspective. Dissertations available from ProQuest. https://repository.upenn.edu dissertations/AAI9212021
- Wei, X. 2008. ‘Implication of IL Fossilization in Second Language Acquisition’, English Language Teaching, vol 1, pp 127-131.
- Woodrow, L. 2006. ‘Anxiety and speaking English as a second language’, RELC Journal, vol 37, no 3, pp 308-328.
Author biodata
Dr Amanda Müller
Dr Müller is an Associate Professor at Flinders University. Her PhD was in corpus linguistics to examine non-standard and standard variants of Scottish and English grammar, punctuation, spelling, and vocabulary. She has completed numerous research studies which involve the language testing of international students, and examined the topics of IELTS, treatment of error, and linguistic fluency. Dr Müller has also authored several articles in this area, some which have appeared in journals such as International Journal of Nursing Studies, International Journal of Bilingual Education and Bilingualism, and English for Specific Purposes. More generally, she has a published over 50 articles, books, and chapters, with more than 20 conference presentations. She has been an invited speaker in Japan and Australia about language testing, focusing on IELTS and OET.
Dr Müller’s research has been recognised through a Vice Chancellor’s research award and her teaching of international students has been recognised with university accolades and two national awards. She is an expert member and reviewer for the national Tertiary Education Quality and Standards Agency (TEQSA) in the areas of International Students (Onshore) and English for Specific Purposes, and she has been twice commissioned to write for the national TESQA Good Practice Experts Advice Hub.
Dr Weifeng Han
Dr Han has full academic status at Flinders University and is currently a lecturer at Federation University. He has been involved in syntactic and corpus linguistics studies for over 15 years. His first PhD was in theoretical syntax, and the second PhD in Speech Language Pathology studied L1 multidialectal learners’ L2 acquisition at the syntaxsemantics interface and its implication on separating language disorders from language differences.
Dr Han was a post-doctoral research fellow in syntax in Hong Kong and a visiting professor in corpus linguistics in Canada. He is familiar with mixed-method research. He has published four research books, one in syntactic typology and the others in second language lexical and syntactic acquisition. He has authored/co-authored over 30 peer-reviewed articles in syntax, corpus linguistics and second language acquisition. Dr Han also co-authored a vignette in the CRAN Project (R) and a spoken corpus in Wu. He has also presented in Australia, Canada, the US, Japan, Singapore, Hong Kong, Taiwan, the West Indies and Mainland China on topics of syntax and corpus linguistics in their interface with second language acquisition.