
The effects of testwiseness and test-taking anxiety on L2 listening test performance: A visual (eye-tracking) and attentional investigation
Official IELTS research report on IELTS Test - Listening and Reading; Impact and Washback - Impact theory and practice, published in 2014.
Abstract
This study considered the extent to which testwiseness and test anxiety affected performance on the IELTS Listening test. It sought to address the following three research questions.
- What effects does L2-listening-test preparation have on (a) test scores, (b) testwiseness, and (c) test-anxiety levels?
- Do the constructs of testwiseness and test anxiety relate?
- How do the effects of test preparation manifest themselves (i.e., in altered test-taking processes)?
To examine the effects of test-preparation, in the current study we adopted a pre-test-post-test experimental design. We had three groups-two experimental and one control (63 learners total). The two experimental groups included two types of test-taking strategy instruction (e.g. explicit vs. implicit); the explicit group being taught specific test-taking strategies and skills, while the implicit group focused on vocabulary instruction. Both groups equally practiced two sets of IELTS™ listening tests during the training sessions. Thus, the first (explicit) group took practice tests and received test-taking strategies instruction, and the second (implicit) group took practice tests but did not receive test-taking strategies instruction-that time was instead filled by vocabulary instruction. A third, control group took the pre and post-tests, but did not take practice tests. Rather, these individuals had conversational English classes between tests.
We measured all participants’ testwiseness through survey questionnaires before and after the training sessions. We also assessed test-taking anxiety at pre and post-testing to understand more completely if anxiety co-varies with testwiseness in explaining overall L2-listening-test-score variance.
In addition to retrospective verbal reports (e.g. stimulated recall) to comprehend test takers’ cognitive test-taking processes, we added eye-movement recordings to capture how test-takers process visual information while listening and to monitor how they manage their attentional resources while taking L2-listening tests.
We found that the effects of the three different test-preparation types were essentially the same. We conclude that test preparation’s best function is perhaps familiarization with test format and the test’s item types, especially items that are relatively new or unknown to the test takers. Extensive test preparation is most likely not needed, especially when the test takers are adults used to taking standardized tests, as in the test takers were in this study. We found that test-taking anxiety was inversely related to L2-listening test performance, and this relationship remained stable regardless of the test taker’s type of test preparation.
1 INTRODUCTION AND LITERATURE REVIEW
Outside of regular academic classrooms, test preparation courses and programs can be considered an industry, with cram schools, specialized online classes, workshops, and intensive summer camps marketed as test-preparation packages for prospective college and university students. Test preparation is a multi-million dollar industry because standardized test scores are important for college admissions, with most university programs requiring a minimum score before an applicant’s file can be reviewed. Many programs and institutions that focus on test preparation do so in three ways: (a) by supplying intensive instruction of the skill to be measured; (b) by teaching relevant and specific test-taking strategies; or (c) by teaching the exam format through repeated practice in taking the tests. The schools often advertise that they will help maximize or raise students’ scores, reduce test-taking anxiety, improve confidence, or even help free up working memory for optimized, cognitive-test-taking conditions (Paul 2012).
The question is, does extensive test preparation work? And if it does work, how and why does it work? And is it, overall, worth it, economically or in terms of time? In this paper we investigate these questions in relation to an academic, English-language-listening test, specifically, the International English Language Testing System™ (IELTS) academic listening test, a high-stakes English-language listening exam administered by the British Council, IDP:IELTS Australia and the Cambridge English Language Assessment. We investigate preparation for this English-language listening test because listening skills, out of the commonly-defined and researched four (listening, speaking, reading, and writing), are perhaps the least understood and most difficult to assess (Buck 2001; Dunkel 1991). Thus, test preparation might be most advantageous for this type of skill, we assume.
Before proceeding with the description of the study, we first review the construct of second-language (L2) listening. We also review the relevant literature on listening-test preparation, including research on two main factors (apart from the skill being measured, i.e., L2 listening) that listening-test preparation may assist with: testwiseness and test-taking anxiety.
1.1 The construct of listening
L2 listening comprehension is the process of relating propositions (words, phrases, etc.) in the aural L2-speech stream to concepts the listener has in mind and to references in the real world (Buck 2001; Rost 1990; Vandergrift 2007; Rost 2005). L2 listeners have to isolate and semantically process salient, linguistic information (Révész & Brunfaut 2013), and part of that process is knowing which parts of the incoming speech stream are most important. L2 learners often do not fully understand the incoming speech stream (especially when their level of L2 proficiency is below that of the L2 speech). Therefore, they must use their background knowledge and interpretive abilities to try to compensate for their
deficits in automatic linguistic processing (Segalowitz 2010). Through compensation, skilled L2 listeners can maintain a certain level of comprehension while failing to recognize some of the individual linguistic elements in the speech stream. But not all L2 listeners can do this well, and even skilled L2 listeners sometimes experience breakdowns in comprehension, even when the speech stream is matched with or below (in linguistic terms) their level of L2 proficiency.
The breakdowns in L2 listening comprehension can stem from several sources (Goh 2000): in failure to chunk and/or store the oral stream; recognize phonemes; or map meaning to grammatical concepts. The failure, in turn may emerge from a lack of attention, misdirected attention, or split-attention (Mayer & Moreno 1998) stemming from competing cognitive demands. The essential notion is that L2-listening comprehension involves many sub-skills at various cognitive, linguistic, and even social and cultural levels. Moreover, the sub-skills required may change depending on the relationships among the listener’s proficiency, his or her perceived need to understand, and the linguistic level and genre of the speech. Overall, there is no one, uniform definition for the construct of L2 listening ability. As stated by Wagner (2004), a global and comprehensive definition of L2 listening ability may be elusive because there are so many various cognitive processes and individual variables involved in listening.
Even though listening as a L2-subskill is difficult to define, many L2-test developers are tasked with designing tests that isolate and assess test takers’ abilities in L2 listening. For example, large-scale, high-stakes tests such as the Educational Testing Service’s (ETS) Test of English as a Foreign Language® (TOEFL) and the International English Language Testing System™ (IELTS) measure academic listening as a skill separate from speaking, reading, and writing. As part of the test design process, the test creators must define and operationalize the type (or construct) of L2 listening that they are assessing. They must follow one of the main tenets in test construction: Test designers should create tests that have the test takers use or produce the language in the same way they are expected to use or produce the language in real life (Chalhoub-Deville 1997; Chalhoub-Deville 2001). In foreign-language-learning (instructed) settings (e.g., when the language being taught is not used outside of the classroom), real-life use may be defined by how the language is used in the classroom.
Thus, an appropriate construct-definition underlying a reliable and valid L2-listening test depends, in part, on who the test takers are, what age they are, what they listen for in the language, what modes of listening they employ, and how they listen. Defining the L2-listening construct is a large process that involves multiple factors. If test scores are used to predict ability (as TOEFL® and IELTS™ test scores often are: they are often used by admissions committees to predict the future academic performance of the test takers), then the test designers should create tests that have the test takers use the language in the way they will need to use it in the future, prospective situation. Furthermore, the tasks used to assess listening performance must also mirror the types of tasks the people would encounter at the academic institution.
1.2 Testwiseness
Any good L2-listening test measures L2-listening skills, but it most likely also assesses (unintentionally) secondary skills (also known as construct-irrelevant skills; things the test is not supposed to be measuring). As explained by Buck (2001), “in all listening tests the response [format] will be a potential source of construct-irrelevant variance” (p. 125). This is because listening comprehension is an internal, cognitive process. Measuring it requires the listener to react to some external stimulus (i.e., a multiple-choice question) or speak or write about the listening text. The performance score constitutes an indirect measure of the underlying cognitive process. Thus, if listening is measured through writing, the test taker’s writing skills may be confounded with his or her listening test performance.
Another potential secondary skill that may be implicated during listening-test-taking is known as testwiseness (Rogers & Harley 1999; Carter 1986; Sarnaki 1979; Millman, Bishop & Ebel 1965), that is, talent in being able to apply appropriate and effective test-taking strategies that relate directly to the test format (Sarnaki 1979). Testwiseness is considered something that helps test takers maximize their observed test scores (Rogers & Yang 1996), but it is also considered independent of the test takers’ knowledge of the subject matter being tested (Millman, Bishop & Ebel 1965). Researchers have suggested different operational definitions of testwiseness and ways in how to teach it (Pan 2010). In this study, however, we take testwiseness to mean both testwiseness (as defined by Sarnaki, 1979) and test-management skills (as defined by Cohen 2007); testwiseness meaning one’s ability to use the clues embedded in test formats, and test-management skills indicating one’s strategies to control the test situation and one’s thoughts and behaviors while testing.
There have been very few studies on the role of testwiseness and test-management skills on foreign and second language listening test scores, although in general, testwiseness, and test-management skills (including test-taking strategies), have been shown to be positively related to test outcomes (Cohen 2007). For example, Dolly and Williams (1986) taught 25 undergraduate students a one-hour lesson on common, multiple-choice test-taking strategies before giving them and a control group of 29 similar undergrads a four-option multiple choice test that covered home economics, archeology, macroeconomics and astronomy. Both groups also took a test of testwiseness after the multiple-choice test. Dolly and Williams found that the experimental group received significantly higher scores on the content test and scored significantly higher on the test of testwiseness than the control group. However, the students in the experimental group only scored higher on the multiple-choice items which Dolly and Williams deemed were “susceptible” to testwiseness strategies: that is, items that contained what they called “flaws,” such as the correct answer being the longest, or items that contained similar or opposite options. Such item-writing flaws, they claimed, could be more readily utilized (taken advantage of) by those taught to look for them, thus augmenting the experimental group’s overall score.
In theory, high-stakes tests should not contain item-writing flaws. But if they do not contain flaws, how can testwiseness, as defined by Sarnaki and also by Dolly and Williams (strategies that relate directly to the test format), assist today’s students? Taguchi (2001), Vandergrift (2005), and Pan (2010) emphasized that testwiseness (test-taking strategies or test-management skills) should comprise metacognitive listening strategies that are irrelevant to the item format, such as thinking about everything that one knows about the topic before the listening segment begins, predicting what will happen, or guessing unknown vocabulary from context. However, as Pan noted, higher proficiency students may tend to apply more metacognitive strategies when listening. This suggests that the successful application of metacognitive listening strategies may only be possible when listening skills are matched with (or higher in ability than) the listening file’s difficulty level. In other words, if one is struggling to comprehend (because the listening file is too difficult for one’s proficiency level), then applying strategies such as listening for key words or using sound effects and the tone of the speaker’s voice to help guess the meaning of novel words (Vandergrift 2005) may be impossible. This suggests that there is a relationship among language proficiency, item type, the soundness of (the number and type of flaws in) the item, and the individual’s testwiseness, and that these elements are intertwined during the testing-taking process. Thus, test preparation may be beneficial if it focuses on familiarizing the student with the various items types that might appear on the exam (thus lessening the amount of time needed to read or understand directions, freeing up cognitive resources, if indeed these are limited), and this may be particularly important for sitting exams that have novel or multiple item formats. Test prep may also be helpful if it guides a student in how to implement specific metacognitive strategies appropriate for and relevant to his or her language proficiency level in relation to the listening files to be played. And it may help lower anxiety through test-format familiarization.
Indeed, testing companies make claims that test preparation is beneficial. In fact, most companies capitalize on this notion by selling test-preparation materials for the tests they create and sell. The companies, however, do not explicitly use the term testwiseness in their advertisements, which is not surprising as this is a rather technical and academic term. Below we list how three different testing companies advertised L2-test-preparation materials on their websites. We further describe how the companies refer to testwiseness augmentation.
-
On Educational Testing Service’s (ETS) TOEFL iBT® (2014) website, ETS claimed that TOEFL practice materials, which included “sample questions, practice tests, interactive skill-building programs, and detailed tips and information for understanding more about the test” help test takers prepare (that is, develop their testwiseness). The website also claimed that the practice materials would help test takers “build their English skills”. In other words, the test-preparation would help test takers’ increase their English-language listening skills along with their testwiseness. (http://www.ets.org/toefl/ibt/prepare/)
-
An IELTS (2014) test-preparation document viewable on and downloadable from the IELTS website did not make claims that test-preparation would increase L2 skills. Rather, the document provided a list of sources of sample-test materials and test-preparation courses. The authors of the document claimed that test takers “don’t have to attend a preparation course, but many candidates find that doing so helps them improve their performance”. (http://www.ielts.org/pdf/information\_for\_candidates\_booklet.pdf)
-
The College Board’s (2014) website for the Scholastic Aptitude Test (SAT) offered five different levels of practice-material options, from “free practice” (free, sample practice questions) to “affordable practice” (online practice-test courses) for USD69.95. (http://sat.collegeboard.org/practice) For the language sections, more directions are given. For example, for the French with Listening Subject Test, “recommended preparation” includes three to four years of high school (or equivalent) French classes and a “review of sample listening questions using a Subject Test with Listening practice CD”. (http://sat.collegeboard.org/practice/sat-subject-test-preparation-french-with-listening)
These advertisements suggested that testing companies know that testwiseness is essential in maximizing observed test scores (Rogers & Yang 1996). Through their claims to the benefits of test preparation, they may be acknowledging that the questions on their tests are susceptible to testwiseness strategies. But it is not clear if the companies believe that testwiseness is independent from test takers’ subject-matter knowledge (Millman, Bishop & Ebel 1965), especially if one considers ETS’s claim that practice, which includes their “interactive skill-building programs” aids test-understanding and builds English skills.
1.3 Test anxiety
The second construct-irrelevant variable affecting test outcomes that we aim to investigate is test anxiety; that is, a test-situation-specific anxiety in which test takers cannot perform as well as they should be able to due to negative thinking, worry, or loss of emotional control in response to test conditions and constraints (see Horwitz 2010, for reviews; Hembree 1988). More specifically, as quoted in In’nami (2006, p. 318-319), test anxiety is a “special case of general anxiety consisting of phenomenological, physiological, and behavioral responses” which is related to an overall fear of failure (Seiber 1980, p. 17). It is hypothesized that test anxiety may co-vary with testwiseness in explaining the total variance in L2 listening test performance (Golchi 2012). More specifically, testwiseness may be inversely related to test anxiety-as testwiseness increases, test-taking anxiety may decrease, as researchers in general education (Kalechstein, Hocevar & Kalechstein 1998) and applied linguistics (Elkhafaifi 2005; Golchi 2012) have shown. For example, Kalechstein et al. taught one group of fifth and sixth graders test-taking strategies and gave them
practice-reading tests; a second control group received no test-taking-strategies instruction. Children in the treatment condition not only did better on subsequent reading tests, they also scored lower on items measuring test anxiety. The findings support the notion that a teacher’s positive and supportive attitude may reduce anxiety and help students better cope in anxiety-provoking situations (Gregersen & Horwitz 2002). The findings also corroborate research suggesting that test-taking practice is a form of systematic desensitization, which reduces anxiety (Arnold 2000)-that is, repeated exposure to the anxiety-making situation helps an individual gain emotional and mental control, and eventually the individual can participate in the situation without experiencing anxiety.
While a good number of researchers have investigated anxiety in relation to second language performance (Hewitt & Stephenson 2012; MacIntyre & Gardner 1991; MacIntyre & Gardner 1989; Cheng 2004; Ergene 2003; Cassady & Johnson 2002), only a few have concentrated on anxiety and listening test performance (Elkhafaifi 2005; In’nami 2006; Golchi 2012). For example, in his 2005 study, Elkhafaifi investigated 233 undergraduate learners of Arabic. He wanted to know if there were relationships among their listening-comprehension grades, their Arabic-listening anxiety, and their more general Arabic-language-learning anxiety. Elkhafaifi adapted Saito, Garza, and Horowitz’s (1999) reading anxiety scale for a listening context, and further customized it for Arabic, L2 listening. He unfortunately did not explain how listening comprehension was assessed; rather, he indicated that these scores were submitted by the students’ teachers; in addition, he did not provide the scale or the average scores or standard deviations of the listening comprehension measure. Nonetheless, using correlational analyses and ANOVAs, Elkhafaifi found that as students’ listening comprehension grades increased, their anxiety levels decreased ( for listening comprehension and general foreign language anxiety, for listening comprehension and listening anxiety), and among first, second, and third year students, third year students had significantly less anxiety in both anxiety measures than first and second year students (with no difference between first and second-year students). Elkhafaifi concluded that the study showed “that increased anxiety adversely affects student performance” (p. 214).
Yet another interpretation could be that less abled students (lower proficiency students) had more anxiety precisely because they could not comprehend as much as their more-proficient peers, an argument articulated by other researchers (Sparks & Ganschow 2007). Anxiety may not be causing lower scores, but rather may be an indication of lower comprehension. As reported by Dunkel (1991), students who have a difficult time listening report that they feel inadequate when listening, demonstrating that frustrations in listening may directly relate to anxiety. Thus, while Elkhafaifi’s study is interesting and has its merits, it does not inform researchers as to how (and whether) anxiety, and test-taking anxiety in particular, prevents individuals from performing as well as they should on a test.
To understand this, researchers need to manipulate the level of test-taking anxiety in a group of test takers to see if different anxiety levels result in differentiating test scores.
Golchi (2012) conducted a study similar to Elkhafaifi’s (2005), but better controlled the listening comprehension test scores by providing all of her 63 English-language learners with an IELTS academic-English listening test. She gave the learners the Foreign Language Listening Anxiety Scale (FLLAS) developed by Kim (2000) and later validated by Kimura (2008). Golchi found a correlation between anxiety and listening: the higher the anxiety, the lower the listening-test score ( ). Likewise, the higher the anxiety, the less frequent the use of listening strategies ( ). But again, as with Elkhafaifi (2005), Golchi’s outcomes can only suggest that lower proficiency (as indicated by lower listening-test scores) is related to higher anxiety and the use of fewer listening strategies. Researchers cannot tell from this study if anxiety causes students to perform less well on the test than they should.
In a third study, In’nami (2006) investigated the English-listening comprehension and test-taking anxiety of 79 first-year university students in Japan enrolled in general English classes. In’nami gave the learners listening comprehension test items based on TOEFL listening test items, and had the learners take the Test Anxiety Scale from Sarason (1975) and the Test Influence Inventory from Fujii (1993). Using structural equation modeling, he found that with these participants, test-taking anxiety did not predict listening test performance. In’nami noted, however, that all of his participants had high levels of English-language proficiency. He noted that proficiency level needs to be better controlled and defined in future studies. He also commented that, by providing the anxiety questionnaires first and giving the listening tests second, students may have been influenced by knowing the goals of the research. He suggested in the future, researchers should give the listening test first, and then the tests of anxiety.
2 RESEARCH QUESTIONS
None of the studies above addressed how much of a listening-test-taker’s score can be attributed to testwiseness, test anxiety, or both. Researchers have attempted to answer this before, but results have been inconclusive, as outlined above. Because the promotion of test preparation is becoming more and more prolific, and because testing agencies are selling test preparation materials that will (they claim) increase test scores, we believe this question is becoming more and more essential to answer. There may be an ethical dilemma here: If a testing company believes that test preparation augments test scores, then is it problematic to sell (essentially) two types or tiers of test packages, one with test preparation, and one without? If test takers who did not prepare are at a real disadvantage, is it fair to sell test preparation separately from the test? Does the testing company advantage those who pay more? While these ethical questions are extremely important, we first take a step back and try to answer preliminary questions that can be investigated with empirical data.
From a review of the literature, one can see how and why L2 learners improve their testwiseness through intensive training (through the taking of practice tests and/or through the explicit learning of test-taking strategies). Eventually, through increased testwiseness test takers can, when faced with test items that are susceptible to test-taking strategies, increase their test scores to a certain extent. In this study we aim to investigate exactly to what extent and how test takers increase their test scores through test-taking strategies.
In contrast to previous research, in this study we plan to examine the differential effectiveness of two types of test-taking instruction (e.g. explicit strategies instruction vs. implicit strategies instruction) and the differential effectiveness of multiple practice tests versus only one. We also measure test-taking anxiety to understand more completely if anxiety covaries with testwiseness in explaining overall L2-listening-test score variance. In addition to retrospective verbal reports (e.g. stimulated recall) to comprehend test-takers’ cognitive test-taking processes, we add eye-tracking methodology to accurately capture how test-takers process visual information while listening and to monitor how they manage their attentional resources while taking a L2-listening test. In other words, we will monitor, via eye-tracking, changes in observable test-taking strategies that may result from the different test-preparation paths. We do this because there is little or no research on the effects of different question formats in L2 listening tests. The present study will help fill this research gap. We were motivated to include eye-movement data because eye-tracking is beginning to be used in language-test-development research and in research that explores the cognitive validity of test items. For example, Feng (2014) explained that Educational Testing Service uses eye-tracking proactively to explore the strategies test takers use to derive the correct answers to test questions. Such information helps the item developers ensure the items are measuring what they are intended to measure. Likewise, researchers such as Bax (2013) and Bax and Weir (2012) have used eye trackers to monitor whether test items elicit the type of cognitive processing they are supposed to.
A summary of the study’s variables are in Figure 1. In particular, with the current research, we aim to address the following questions.
- What effects does L2-listening-test preparation have on (a) test scores, (b) testwiseness, and (c) test-anxiety levels?
- Do the constructs of testwiseness and test anxiety relate?
- How do the effects of test preparation manifest themselves (i.e., in altered test-taking processes)?
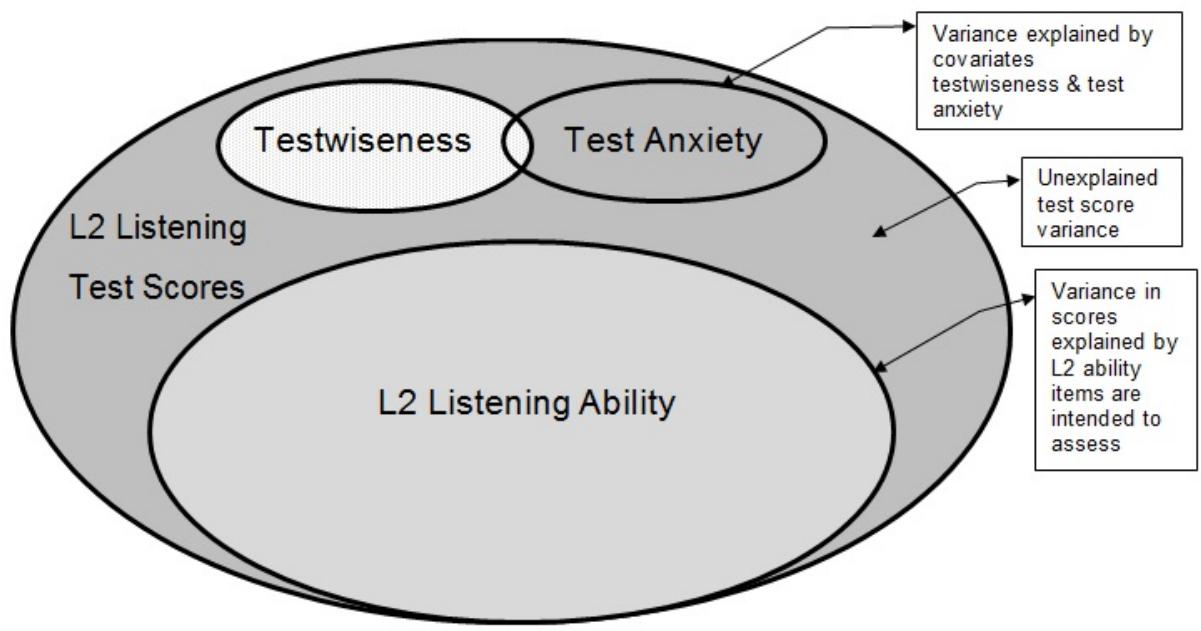
Figure 1: Diagram of the proposed constructs contributing to L2-listening test scores
3 METHODOLOGY
3.1 Participants
Seventy-six English-language learners from Michigan State University’s (MSU) English Language Center (ELC) participated in at least the first parts of this study. However, only 63 completed all measures (pre-test, two test-preparation training sessions, questionnaires, interview, and post-test-approximately 8 hours per participant). Thus, in this study, we include the results from the 63 test takers who completed all steps in the study.
The 63 test takers were in the ELC’s English for Academic Purposes classes, which are for students provisionally admitted to the university. They take classes in the ELC to improve their English-language abilities so that they may eventually move from provisional status to regularly-matriculated students in MSU academic programs. Based on the placement test scores that the ELC and the university used to place them into the EAP courses (the Michigan State University English Placement Test, or MSUELT, see http://elc.msu.edu/programs/eap/ for information on the test and the EAP Program), the students’ language proficiency varied from intermediate to advanced on the American Council on the Teaching of Foreign Languages (ACTFL) Proficiency Guidelines scale (ACTFL 2012).
3.2 Materials
3.2.1 Pre and post-tests of listening
In this study, we had all 63 learners take a 40-item listening pre-test and 40-item listening post-test so that we could see the change in scores and test-taking perceptions and behaviors the test takers would have depending on the type of listening-test practice they would receive. For these two tests, we choose two different IELTS™ practice-test forms from an official IELTS™ practice-test book published by Cambridge University Press (Cambridge IELTS 8 2011). The pre-test was Test 3 (pp. 56-64) and the post-test was Test 1 (pp. 10-17). The forms were comparable in terms of test formats (fill-in-tables, fill-in-gaps, multiple-choice questions). A computer programmer (Vineet Bansal) at the Center for Language Education and Research (CLEAR, www.clear.msu.edu) at Michigan State University computerized the test forms for this project in the summer of 2012.
3.2.2 Three questionnaires (listening strategies, test-taking strategies, test anxiety)
Besides a general background questionnaire, we employed three questionnaires in this study that each learner would take twice (pre and post treatment): (a) a listening-strategies questionnaire, (b) a test-taking-strategies questionnaire, and (c) a test-anxiety questionnaire, which were administered as three parts on a single questionnaire form.
We finalized the three questionnaires through piloting in the summer of 2012; 40 English-language learners (not those included in the fall (autumn) 2012 data collection sessions) at Michigan State University’s English Language Center participated in the pilot testing.
We adopted and modified the listening-strategy questionnaire from Vandergrift (1997). The test-taking-strategy questionnaire was adopted and modified from Cohen and Upton (2007). Because Cohen and Upton’s work targeted the iBT TOEFL® reading test, which only involves multiple-choice items, we added in questions about fill-in-the-gap items, which are included in the IELTS™ listening test. We adopted and modified the test of test anxiety from Cassady and Johnson (2002), which originally was not specific to ESL language tests. We therefore revised the instrument accordingly.
The original numbers of items on the questionnaires were 28, 32, and 14, respectively. Using IBM’s SPSS version 19, we ran an exploratory factor analysis (EFA) on the data from the 40 summer pilot-test learners to help us reduce the number of items on each questionnaire. Given that we expected the question items and the factors to be related to one another, we used an oblique rotation and applied the direct oblimin method (see Field 2009 for information on EFA methods). We interpreted the data from the pattern matrix to shorten the questionnaires. To make the interpretation simpler, we suppressed any item whose coefficient value was less than .40 (we did not consider that item as loading on that factor). First, we deleted the factors that showed relatively small Eigenvalues (smaller than 1). Second, the items that loaded on more than one factor were excluded to avoid overlap between factors. For the test-taking strategies, a pattern matrix was not generated by SPSS because the rotation failed to converge. Thus, the component matrix was considered for item reduction. As a result of pilot testing and the EFA, we had 15 items to measure listening strategies, 16 items for test-taking strategies, and 11 items for test anxiety. For this study we used 6-point Likert-scale items that ranged from “extremely true of me” (6) to “not true of me at all” (1). The questionnaire items that remained after pilot testing and which were used in the main study are listed in Appendix A.
3.2.3 Stimulated-recall interview questions
We created a list of questions to ask each test taker at the end of his or her final data collection session to investigate a cross-section of the learners’ thought processes while they were taking the listening post-test. These questions were asked in conjunction with showing the learner a video (which was the stimulus) of his or her eye movements across the final page of his or her post-test. The directions and questions that the researcher used to guide the stimulated recall were based on procedures outlined by Gass and Mackey (2000) and were as follows.
Directions, read by the researcher: I will audio tape you for this part of the session, is that okay? (If yes, start recording with Audacity). What we will do is watch a video clip of your eye movements. Please watch your eye movements and tell me what you remember you were thinking at that time.
You may stop the video at any point when you want to discuss what you remember you were thinking then, at that time. I may stop the video from time to time too to ask you a question. Try to remember to tell me only what you remember thinking then, not what you think now when you see the video. I am trying to understand what you thought when you took the test. Any questions?
Questions the researcher was allowed to ask during the stimulated recall:
- What were you thinking then?
- What were you thinking at the time when you read the question?
- What were you thinking about when you checked the options?
- What were you thinking when you read that?
Final questions:
- When you were making decisions on the test, did you have any thoughts that popped into your head?
- Did anything in particular occur to you while you were solving the test questions?
3.3 Procedure
We used the listening pre-test scores to assign the original 76 participants to three different treatment groups. The groups were the following:
- Explicit group: received test-taking strategies instruction and took practice IELTS listening tests
- Implicit group: received vocabulary instruction and took the same practice IELTS listening tests as the explicit group
- Control group: received instruction on American culture.
We balanced each group so that each would have the same listening-pre-test-score average and standard deviation. After accounting for attrition, 21 remained in the explicit group, 22 in the implicit-instruction group, and 20 in a control group, with listening proficiency still balanced across the three groups even after attrition (see Appendix B for the groups’ average scores). We compared the three groups’ average listening pre-test scores using one-way, analysis of variance (ANOVA) and found no differences among the groups (with the analysis including only the 63 who completed all measures), , , eta squared = .006.
For the data collection phases of the study, we administered the listening pre and post-tests on a computer (23” wide screen TFT monitor) with the Tobii TX300 eye-tracking cameras attached to record the test takers’ eye movements. Test takers were given a blank sheet of paper for note-taking while listening.
All learners were invited individually to take the tests and fill out the questionnaires at the Michigan State University, Second Language Studies Tobii eye-tracking laboratory, where they met with the second researcher, Hyojung Lim. After signing the consent form and filling out the background questionnaire, Hyojung had the participant adjust his or her chair height and sitting posture to ensure the participant’s eyes were level with
the center of the computer screen. Hyojung checked that the distance between the participant’s eyes and the cameras were between 60 cm to 65cm to optimize gaze accuracy and precision. The participants’ eye movements were calibrated to the eye-tracking camera via a standard 9-point calibration procedure during which the participant watched a series of 9 dots that appeared one-by-one in locations on the computer screen. Hyojung monitored the participants’ eye movements on the external viewer during eye calibration and during the experiment to prevent any unexpected failure of eye recording. If the eyes of a participant became no longer trackable, Hyojung saw this on the external viewer, stopped the experiment, recalibrated, and started the experiment again. This did not happen with any of the 63 participants that remained in the study.
On the first visit, a participant took the first form of the IELTS listening test (as a pre-test) on a computer screen. This took 30 minutes. Hyojung gave each test taker a blank sheet of paper and a pen for note-taking. An additional 10 minutes were allowed after the audio was over for participants to finalize their answers. This was necessary for those who needed to transfer their answers from the notes to the computer screen. Upon the completion of a pre-test, three questionnaires were administered online; the listening strategy questionnaire, the test-taking strategy questionnaire, and the test of test anxiety (see Appendix A for the items from these questionnaires).
One day to two weeks after finishing the pre-test and initial questionnaires, participants attended the first training session to which we assigned them. The training session lasted for two hours. As explained above, based on the pre-test results, the learners were put into three different groups (explicit, implicit, or control) with the mean pre-test score balanced between groups. In each of the two experimental groups (explicit and implicit), the participants took the same IELTS listening-practice tests (also from Cambridge IELTS 8 2011; Cambridge IELTS 7 2009), but different from the ones they took as pre and post-tests. When reviewing answers from the practice tests, the explicit group was explicitly taught test-taking strategies, and the implicit group was taught vocabulary related to the listening test items and specific vocabulary in the audio files. The control group did not take any practice tests; rather, the control group received two hours of general English-language and American culture lessons. Each two-hour session had a break in the middle for dinner, which we provided (pizza and fruit for the first session and Asian food for the second session).
A week later, the second two-hour training session was held, wherein each group continued to receive the same instruction it had before. There were two instructors of the training and control sessions: Paula Winke, and English Language Center instructor Laura Ballard, who had a teaching background similar to Paula’s. To control for any teacher effect, however, the instructors switched teaching roles during the second session. That is, Paula taught the explicit group the first week (for the first two hours of instruction), and Laura taught the implicit group the first week (for the first two hours of instruction). Laura taught the explicit group the second week, while Paula taught the implicit group the second week. For the control group, Paula taught the first two-hour session, and Laura taught the second two-hour session. Thus each learner, regardless of the condition, had the same instructors.
Within two weeks after the second training, each participant came to the eye-tracking laboratory individually to meet with Hyojung again and to take the second form of the IELTS listening test, the post-test. Note-taking was again allowed, and an extra 10 minutes were given after the 30-minute listening session as before. After the post-test, Hyojung asked the participant to fill out the same questionnaires that they did after the pre-test; the listening strategy questionnaire, the test-taking strategy questionnaire, and the test of text anxiety (see Appendix A). Hyojung instructed the participants to respond to the questionnaires based on the post-test experience this time.
The test takers also then participated in a stimulated recall session, during which time the participant watched a video recording of his or her eye movements across the very final web page of test questions from the listening post-test. Hyojung allowed the participants to respond in English or their native language. She audio recorded the stimulated recall sessions. When the entire procedure was completed, we paid each participant USD40 for their time. As we could test only one participant at a time for the pre and post-test, the time gap between the pre-test and the first training session and between the second training session and the post-test varied across participants, but was no more than two weeks.
A diagram of the study procedure is in Figure 2 below.
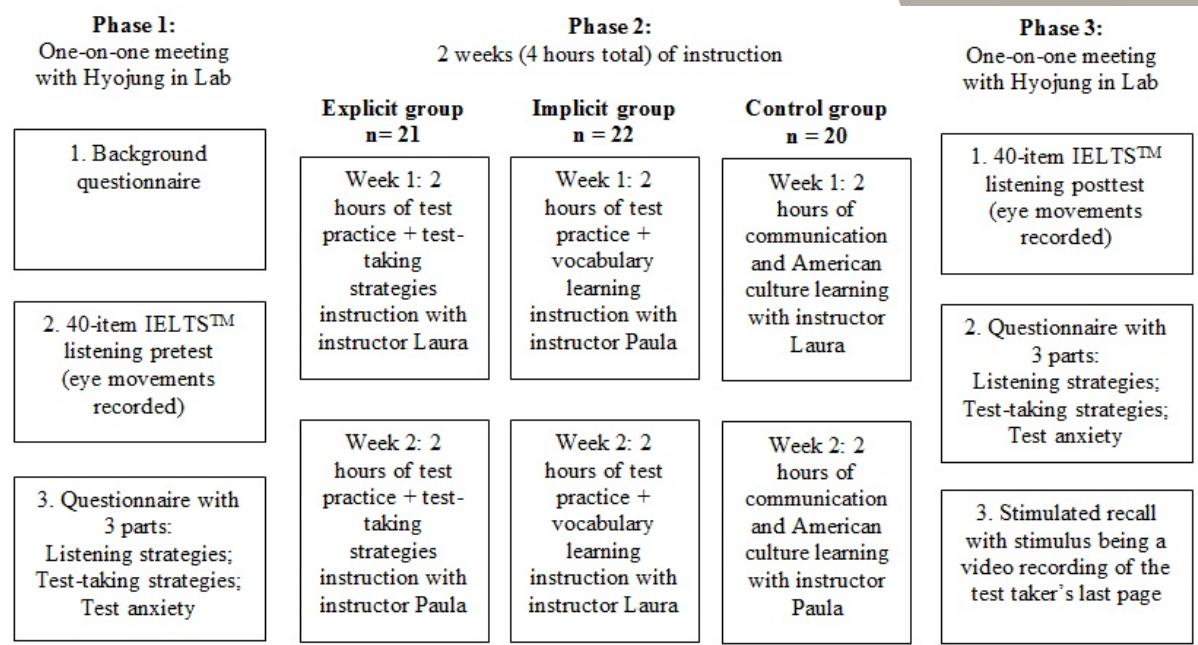
Figure 2: Study procedure
3.4 Analyses
In this multiple-methods study, we employed both quantitative and qualitative methods to analyze the various types of data we collected. For each participant in the study and for each group, we derived summary scores on the quantitative measures to be used for further analysis. Before doing this, we reverse-coded the individuals’ responses to the first two statements on the test-taking anxiety questionnaire. We did this because these two statements (Before taking a test, I feel confident and relaxed; I am less nervous about tests than the average college student) measure anxiety in the opposite direction from the other nine items.
To answer research question one (What effects does L2-listening-test-preparation have on test scores, testwiseness, and test-anxiety levels?), we inspected descriptive statistics and ran one-way, ANOVA tests in IBM’s SPSS version 22 to understand if the three groups performed differently on the various measures (listening test, testwiseness, test-taking anxiety) after treatment (after the four hours of instruction).
To address research question two (Do the constructs of testwiseness and test anxiety relate?), we ran Spearman correlations.
To address question three (How do the effects of test preparation manifest themselves?), we quantitatively and qualitatively analyzed the eye movement data and the stimulated recall interview data. We followed some of the procedures outlined in previous research that investigated the eye movements and corresponding stimulated recalls of L2-test takers (Bax & Weir 2012; Bax 2013).
4 RESULTS
The first part of research question one asked what effects L2-listening test preparation has on test scores. Before answering this question, we first present descriptive statistics (in Table 1) that show the learners’ scores on the various measures in the study depending on the group to which the learners were assigned.
| Group | Listening pre-test score | Listening post-test score | Gain on fill-in-the-gap questions from pre to post-test (in %) | Gain on multiple-choice questions from pre to post-test (in %) | Gain in listening strategies score (pre to post) | Gain in test-taking strategies score (pre to post) | Gain in test-taking-anxiety score (pre to post) | |
|---|---|---|---|---|---|---|---|---|
| Explicit | M | 17.05 | 21.95 | 28% | 6% | 2.35 | 2.35 | -3.60 |
| Explicit | Min | 4.00 | 6.00 | -13% | -8% | -19.00 | -19.00 | -18.00 |
| Explicit | Max | 29.00 | 34.00 | 71% | 21% | 23.00 | 23.00 | 21.00 |
| Explicit | SD | 6.66 | 6.79 | 22% | 7% | 10.92 | 10.92 | 8.14 |
| Implicit | M | 16.36 | 19.41 | 18% | 4% | 1.95 | 1.95 | -3.73 |
| Implicit | Min | 6.00 | 4.00 | -21% | -26% | -9.00 | -9.00 | -27.00 |
| Implicit | Max | 33.00 | 33.00 | 44% | 26% | 18.00 | 18.00 | 9.00 |
| Implicit | SD | 7.52 | 7.64 | 17% | 12% | 7.84 | 7.84 | 8.81 |
| Control | M | 15.80 | 21.35 | 28% | 9% | 1.21 | 1.21 | -1.79 |
| Control | Min | 6.00 | 10.00 | -4% | -15% | -25.00 | -25.00 | -13.00 |
| Control | Max | 28.00 | 36.00 | 70% | 26% | 13.00 | 13.00 | 10.00 |
| Control | SD | 6.14 | 7.55 | 20% | 12% | 9.41 | 9.41 | 5.90 |
| Total | M | 16.41 | 20.87 | 24% | 6% | 1.85 | 1.85 | -3.08 |
| Total | Min | 4.00 | 4.00 | -21% | -26% | -25.00 | -25.00 | -27.00 |
| Total | Max | 33.00 | 36.00 | 71% | 26% | 23.00 | 23.00 | 21.00 |
| Total | SD | 6.73 | 7.30 | 20% | 11% | 9.28 | 9.28 | 7.70 |
Table 1: Descriptive statistics of the test takers scores on the study’s measures pre to post-testing
Using an independent samples t test, we found that overall, the 63 English-language learners in this study obtained higher scores on their second IELTS™ listening test (increasing their average score from 16.41 to 20.87 out of 40) after the first examination and the four-hours of instruction, with the learners increasing their test score by 4 points on average (t = 8.2, df = 62, , d = .64). But after we broke the gain scores down by group, differences in post-test scores due to group were non-existent. There were no group differences at pre-testing, , , eta squared = .006, and likewise there were no group differences at post-testing, , , eta squared = .023.
Thus, while the learners in the study showed gains overall from the pre-test to the post-test, we do not see any differential gains due to the type of instruction they received. In other words, these data suggest that we should accept the null hypothesis (we cannot reject it) that there are no differences among the groups in terms of their L2-listening-post-test performances. The type of instruction did not impact the amount of gains the learners made in their test scores. These data can be seen graphically in Figure 3.
We looked at the test takers’ scores by item type as well. We looked at group performance on the multiple-choice test questions, and the groups’ scores on the fill-in-the-gap questions, to see if either question format was more susceptible to test-taking-strategies instruction or practice-testing types. That is, would students in a certain test-preparation group do better overall on the post-test on either of these two item types? We use the averages reported in Table 2 to first ensure that the groups performed similarly on the subsets of multiple-choice and fill-in-the-blank questions on the pre-test. They did: , for multiple-choice; and , for fill-in-the-gap. Likewise, the learners on average performed the same on the multiple-choice and fill-in-the-gap questions on the post-test: , for multiple-choice; and , for fill-in-the-gap.
Thus, performance on either of the two main question formats on the L2-listening test did not differentially increase depending on participation in a specific test-training type. Rather, performance remained stable across groups for both item types, regardless of the learners’ type of test preparation.
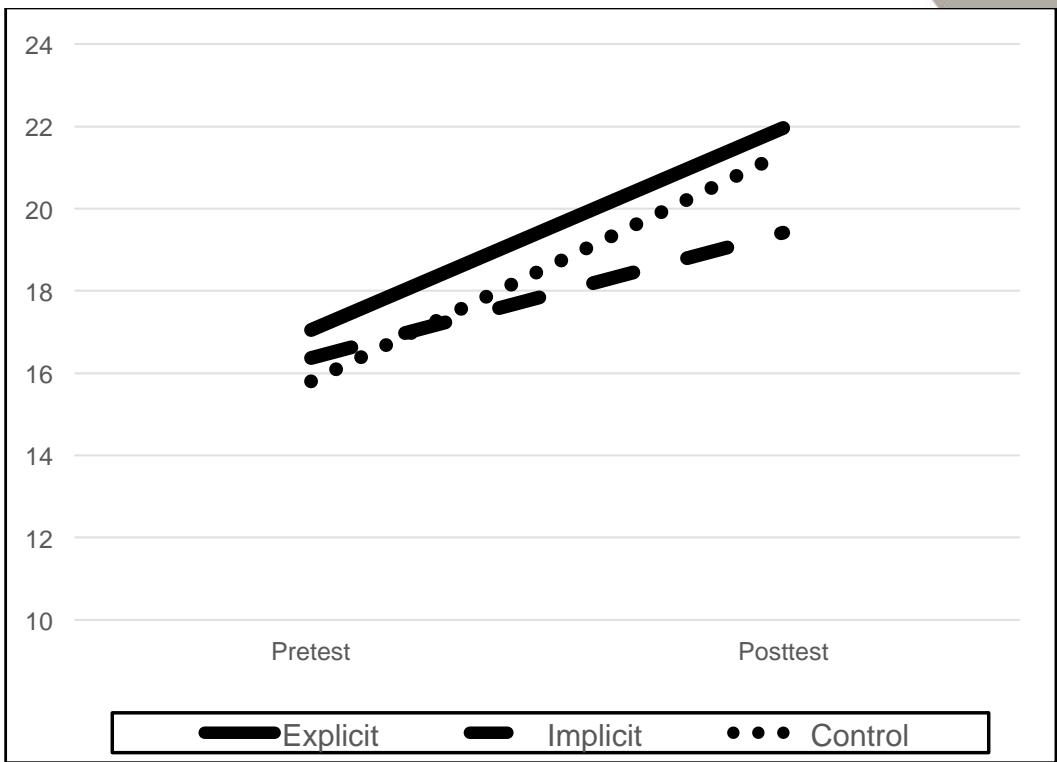
Figure 3: Gains from pre-testing to post-testing on the L2-listening test by group
| L2 Listening Test | Question Types | Group | M | SD | SE | CI LB | CI UB | Min | Max |
|---|---|---|---|---|---|---|---|---|---|
| Pretest | Multiple-Choice Questions | Explicit | 7.19 | 2.27 | 0.50 | 6.16 | 8.22 | 3.00 | 13.00 |
| Pretest | Multiple-Choice Questions | Implicit | 7.09 | 2.49 | 0.53 | 5.99 | 8.19 | 3.00 | 12.00 |
| Pretest | Multiple-Choice Questions | Control | 6.85 | 2.32 | 0.52 | 5.76 | 7.94 | 4.00 | 12.00 |
| Pretest | Multiple-Choice Questions | Total | 7.05 | 2.33 | 0.29 | 6.46 | 7.63 | 3.00 | 13.00 |
| Pretest | Fill-in-Gap Questions | Explicit | 9.86 | 5.15 | 1.12 | 7.51 | 12.20 | 0.00 | 19.00 |
| Pretest | Fill-in-Gap Questions | Implicit | 9.27 | 5.62 | 1.20 | 6.78 | 11.76 | 0.00 | 21.00 |
| Pretest | Fill-in-Gap Questions | Control | 9.16 | 4.79 | 1.10 | 6.85 | 11.47 | 2.00 | 19.00 |
| Pretest | Fill-in-Gap Questions | Total | 9.44 | 5.14 | 0.65 | 8.13 | 10.74 | 0.00 | 21.00 |
| Posttest | Multiple-Choice Questions | Explicit | 9.48 | 2.52 | 0.55 | 8.33 | 10.62 | 4.00 | 14.00 |
| Posttest | Multiple-Choice Questions | Implicit | 8.77 | 2.37 | 0.51 | 7.72 | 9.82 | 3.00 | 12.00 |
| Posttest | Multiple-Choice Questions | Control | 9.70 | 1.92 | 0.43 | 8.80 | 10.60 | 6.00 | 13.00 |
| Posttest | Multiple-Choice Questions | Total | 9.30 | 2.29 | 0.29 | 8.72 | 9.88 | 3.00 | 14.00 |
| Posttest | Fill-in-Gap Questions | Explicit | 12.48 | 4.79 | 1.05 | 10.29 | 14.66 | 2.00 | 20.00 |
| Posttest | Fill-in-Gap Questions | Implicit | 10.64 | 5.72 | 1.22 | 8.10 | 13.17 | 1.00 | 21.00 |
| Posttest | Fill-in-Gap Questions | Control | 11.65 | 6.18 | 1.38 | 8.76 | 14.54 | 3.00 | 23.00 |
| Posttest | Fill-in-Gap Questions | Total | 11.57 | 5.55 | 0.70 | 10.17 | 12.97 | 1.00 | 23.00 |
Table 2: L2-listening test question types and group performance on them
| Group | Group | Listening strategies Pre | Listening strategies Post | Test-taking strategies Pre | Test-taking strategies Post | Test-taking anxiety Pre | Test-taking anxiety Post |
|---|---|---|---|---|---|---|---|
| Explicit | M | 57.90 | 61.60 | 24.05 | 25.67 | 37.80 | 34.67 |
| Explicit | Min | 31.00 | 42.00 | 17.00 | 15.00 | 18.00 | 20.00 |
| Explicit | Max | 85.00 | 81.00 | 31.00 | 34.00 | 54.00 | 52.00 |
| Explicit | SD | 12.57 | 10.28 | 3.96 | 4.98 | 9.50 | 9.57 |
| Implicit | M | 56.86 | 58.82 | 23.36 | 24.23 | 40.00 | 36.27 |
| Implicit | Min | 38.00 | 44.00 | 15.00 | 16.00 | 24.00 | 19.00 |
| Implicit | Max | 77.00 | 75.00 | 32.00 | 35.00 | 57.00 | 51.00 |
| Implicit | SD | 9.63 | 9.73 | 4.23 | 5.90 | 10.48 | 9.78 |
| Control | M | 57.53 | 58.55 | 25.11 | 25.55 | 34.74 | 33.70 |
| Control | Min | 48.00 | 43.00 | 19.00 | 16.00 | 18.00 | 11.00 |
| Control | Max | 75.00 | 69.00 | 35.00 | 35.00 | 48.00 | 55.00 |
| Control | SD | 6.66 | 7.20 | 4.16 | 4.57 | 9.37 | 11.41 |
| Total | M | 57.43 | 59.66 | 24.17 | 25.15 | 37.51 | 34.88 |
| Total | Min | 39.00 | 43.00 | 17.00 | 15.67 | 20.00 | 16.67 |
| Total | Max | 79.00 | 75.00 | 32.67 | 34.67 | 53.00 | 52.67 |
| Total | SD | 9.62 | 9.07 | 4.12 | 5.15 | 9.78 | 10.26 |
Table 3: Average scores per group on the three questionnaires, pre- and post-treatment
Looking at the learners’ scores on the three questionnaires (L2-listening strategies, test-taking strategies, and test-taking anxiety) that they took post-treatment (after the four hours of instruction), we likewise see no cross-group differences. Table 3 presents the descriptive statistics of the learners’ scores across the three measures by group. Regardless of the type of instruction the learners received, their average scores on the three questionnaires post-treatment did not exhibit statistically significant differences (for listening strategies, , ; for test-taking strategies, , ; for test anxiety, , ).
Research question two asked, “Do the constructs of testwiseness and test-taking anxiety relate?” We posed this question because several researchers (Elkhafaifi 2005; Golchi 2012; Kalechstein, Hocevar & Kalechstein 1998; Gregersen 2005) have found that these two factors do relate, and inversely, with increases in testwiseness resulting in lowered test-taking anxiety. We ran Spearman correlations because the questionnaire data included in these analyses were ordinal, Likert-scale responses (see Field 2009). We investigated the associations across time by first correlating testwiseness factors (listening-strategies and test-taking strategies) with test-taking anxiety at time 1 (pre-testing), and then at time 2 (post-testing).
We did not find that the constructs of testwiseness and test anxiety were related for these learners. At both pre-testing and post-testing, learners’ scores on the listening strategies and test-taking strategies questionnaires (both constructs of testwiseness) did not correlate with the learners’ scores on the test-taking anxiety measure. However, at both pre-testing and post-testing, the learners’ test-taking anxiety scores were inversely related to their overall scores (out of 40) on the L2-listening test. These similar relationships (across the two times) in the data were rather weak (-.267 at pre-testing, and -.279 at post-testing), but each time it was significant. These results seem to suggest that a learner’s test-taking anxiety level can (but only weakly) predict his or her overall L2-listening test score and vice versa; in other words, a small relationship between these two factors exists.
In Figure 4, we present the post-testing relationship between L2-listening test scores and the learners scores on the test-taking anxiety questionnaire. Figure 4 shows the weak inclination that when a learner scores high on one measure, he or she conversely scores low on the other measure.
| Measure | L2-Listening Test | Listening Strategies | Test-taking Strategies | |
|---|---|---|---|---|
| Pretest | Listening Strategies | -.020 (.865) | ||
| Pretest | Test-taking Strategies | -.042 (.730) | .537** (.000) | |
| Pretest | Test-taking Anxiety | -.267* (.023) | .057 (.635) | .017 (.890) |
| Posttest | Listening Strategies | -.266* (.035) | ||
| Posttest | Test-taking Strategies | .022 (.860) | .681** (.000) | |
| Posttest | Test-taking Anxiety | -.279 (.025)* | .084 (.512) | .200 (.112) |
Notes. Significant correlations are marked with asterisks. Significant at .05 level is *, .01 is **. P values are listed in parentheses behind the correlation coefficients.
Table 4: Spearman’s Rho (r) correlations among questionnaire and L2-listening-test data
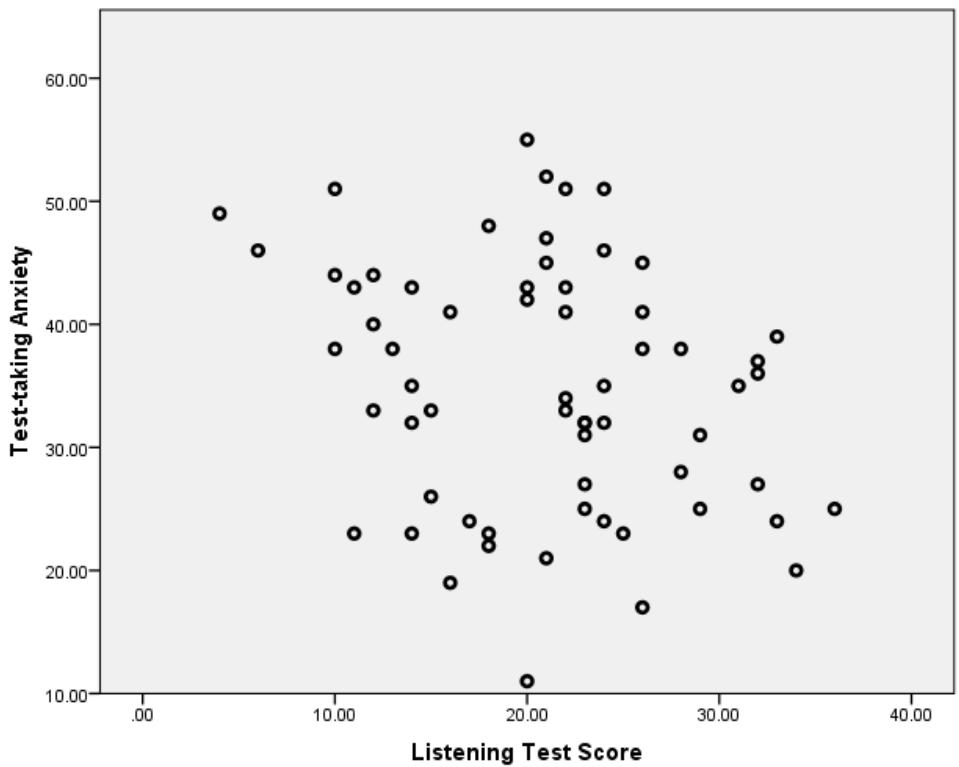
Figure 4: Test-taking anxiety and L2-listening test performance (at post-testing)
Research question three asked, “How do the effects of test preparation manifest themselves (i.e., in altered test-taking processes)?” We had planned to investigate this question in terms of any group differences we found, hypothesizing that if the three groups performed differently on the post-test, and if those differences could be attributed to the learners’ participation in differing instructional settings, then differences in their test-taking processes may also relate to the instructional differences. We had thought, for example, that we might find learners in the explicit group using more test-taking strategies than learners in the control group. We thought we might see triangulation of such a result in the eye-movement records or in the stimulated recall transcripts. However, we found no group-related differences on the L2-listening post-test. Nor did we find any group-related differences on the measures of testwiseness or test-taking anxiety at post-testing.
Because we didn’t find any effects of test preparation on L2-listening-test scores or on testwiseness or test-taking anxiety, we instead rephrased the question and explored the relationship between test-taking anxiety and L2-listening test scores. We looked at why test-anxious and less test-anxious learners tended to score differently on the L2-listening test (regardless of instruction).
We first identified the 12 highest scorers on test-taking anxiety (after adding together each learner’s scores on the two anxiety measures) and the 12 lowest scorers on the same measure. The low-anxiety group’s average score on the two tests of test anxiety (with 11 questions on each test, 6-point Likert scale scoring; 132 points possible) was 45.58 (SD = 6.92). The high-anxiety learners had an average score of 96.75 (SD = 6.25). Using an independent sample t test, we confirmed that these two groups were significantly different on test-taking anxiety, t = -19.00, df = 22, p = .000, d = 7.76. The effect size of 7.76 indicates that the higher-anxiety group is almost eight standard deviations (on the anxiety measure’s scale) above the lower-anxiety group.
After identifying those with low and high test-taking anxiety, we looked at their eye-movement records to find if they had any patterns in their visual attention (while taking the L2-listening tests) that corresponded with their anxiety level (low, high). Our motivation for doing this was because researchers have shown that eye movements change or differ from baseline or control conditions when processing breaks down, typically when individuals struggle with the input (Mitchell et al. 2008; Warren & McConnell 2007). In L1 reading-processing studies, for example, difficulties have been found to be signalled by longer eye fixations and more frequent regressions to earlier parts of the text as compared with baseline (or control) data. Eye-movement research, we believe, can help language-testing researchers understand the general processes underlying test-taking, as well as the time frame for the different components in the test-taking process. This is because processing procedures and difficulties can be measured via eye tracking, assuming eye-movements are triggered by cognition (Rayner, Reichle & Pollatsek 2005; Reichle et al. 2013; Rayner 2009; Reichle, Rayner & Pollatsek 2003).
And eye-movement data can be triangulated in relation to other, concurrent or subsequent measures of attention and awareness (Godfroid & Uggen 2013), which we have.
Before presenting some of the eye-movement data, we first present some terms. There are two kinds of eye-movement data that eye-trackers, including the Tobii TX300 we used, tend to record. First, during eye fixations, individuals process visual input; typically (but not always) as they fixate on (that is, look at) a word or image (e.g. Rayner, 1998, 2009a). Saccades occur when the person moves his or her eyes from one location to the next, with the movement indicating, normally, the need to acquire more information (Brysbaert & Nazir 2005). The time in between saccades is the eye fixation duration. Fixation durations are influenced by a number of low-level (visual) and high-level (cognitive) factors. For example, in reading research, low-level factors include the length of the word (Kliegl, Nuthmann & Engbert 2006), while high-level factors are things such as whether the word was correctly processed (Reichle, Warren & McConnell 2009). Text or images that researchers are interested in are identified by the researchers and called interest areas. For example, in this study, we are interested in test directions as interest areas, separate from other types of text and images on the test.
A question in this study that eye-movement data can answer is, do highly test-anxious individuals spend more time on the test’s directions than low-anxious individuals do? By outlining or selecting interest areas, researchers can calculate many eye-movement statistics relating to that interest area, such as the two below that we employ in this study:
- total fixation duration is the total time (in milliseconds) spent fixating on the interest area
- a fixation count is how many times a person’s line of sight entered the area of interest, i.e., the total number of fixations of which the total fixation duration consists.
To answer the third research question in a new way (How do the effects of test-taking anxiety manifest themselves?), we first investigated the total fixation duration that low- and high-anxiety test takers had (on average) on test directions. We used the Tobii Studio software to output the eye movement metrics. We chose the Tobii’s Velocity-Threshold Identification (I-VT) fixation classification algorithm to define fixations and saccades. Given that the average fixation duration of skilled readers of English is 200-250 milliseconds per word (Rayner, 2009), we set the minimum fixation duration at 200 milliseconds for the study; fixations shorter than 200 milliseconds were not analyzed as they may have not been fixations. Fixations that are that short often are noise in the data (e.g., a re-fixation on the screen after a blink or after looking away).
When comparing low test-taking-anxiety learners and high test-taking-anxiety learners, we see that the low-anxious learners spent far less time reading the instructions, at least initially. For example, on the pre-test, the highly anxious test takers spent on average 10.17 milliseconds on the short, initial directions, while the less anxious students spent only 3.46 milliseconds on the same text.
We also found that test-taking anxiety was often related to how much time test takers spent on the key words needed to answer specific fill-in-the-blank test questions. In Table 5, we report the total fixation durations and fixation counts (in milliseconds) that outline test-taking-behavior differences between those with high and low test-taking anxiety. To sum, the highly-anxious test takers spent much more time on initial directions and on processing key words (written in the test booklet) used to correctly answer questions. We also looked at test performance itself as being associated with test-taking behaviors. If L2-listening test scores are a fine-grained indication of listening proficiency in the L2, can we also see the effects of proficiency (in relation to the difficulty level of the test) on test-taking behaviors?
We divided test takers into two groups based on their average L2-listening test scores. Overall, the eye-movement data show that high scorers often fixated their eyes on the key words surrounding the place in which the answer would be entered more quickly than low scorers (the high scorers time to first fixation on the word directly adjacent and prior to the blank was, on average, quicker). As shown in Table 6, both in the pre and post-test, high scorers’ time to first fixation on the words on the left and adjacent to the answer blanks in the fill-in-the-gap questions was significantly shorter than low scorers’. In other words, the high scorers may have been able to spend more time (they got there earlier) on the blanks or in processing information surrounding the blanks. They appeared to be able to more quickly move down stream in the text on the page to process information directly adjacent to the blank. This may indicate that high scorers are simply able to read faster than low scorers on the L2-listening test. The ability to read quickly can either provide them an advantage on the listening test, or it may be evidence of their pre-existing advantage in listening. It is impossible to disentangle the two constructs (reading of the text on the page, L2-listening skills) in this context.
| Mann-Whitney U | High test-taking-anxiety students (N=12) | Low test-taking-anxiety students (N=12) | |||
|---|---|---|---|---|---|
| Pretest | Total fixation duration | Instruction for Q1-3 | Z = -2.271 (p = .023) | 10.17 (6.73) | 3.46 (2.94) |
| Pretest | Total fixation duration | Q16 open | Z = -2.1 (p = .036) | 4.03 (3.37) | 1.58 (1.32) |
| Pretest | Total fixation duration | Q1 location | Z = -2.117 (p = .034) | 12.35 (5.28) | 7.37(4.71) |
| Pretest | Total fixation duration | Q35 from | Z = -1.936 (p = 0.053) | 10.13 (7.45) | 4.99 (5.58) |
| Pretest | Total fixation duration | Q35 idea | Z = -2.721 (p = .007) | 17.50 (9.39) | 6.13 (4.97) |
| Pretest | Total fixation duration | Q36 examples | Z = -2.165 (p = .03) | 6.07 (5.14) | 3.00 (4.69) |
| Pretest | Fixation Count | Instruction for Q1-3 | Z = -2.421 (p = 0.015) | 31.20 (18.81) | 11.10 (9.15) |
| Pretest | Fixation Count | Q16 open | Z = -2.481 (p = 0.013) | 11.38 (6.61) | 4.25 (3.37) |
| Pretest | Fixation Count | Q1 location | Z = -2.348 (p = 0.019) | 35.700 (13.27) | 21.00 (12.74) |
| Pretest | Fixation Count | Q1 in the | Z = -2.007 (p = 0.045) | 24.40 (11.04) | 14.00 (10.52) |
| Pretest | Fixation Count | Q35 from | Z = -2.003 (p = 0.045) | 29.63 (16.60) | 13.83 (13.01) |
| Pretest | Fixation Count | Q35 idea | Z = -2.876 (p = 0.004) | 49.40 (24.00) | 17.70 (13.27) |
| Pretest | Fixation Count | Q36 example | Z = -2.172 (p = 0.03) | 18.56 (16.64) | 8.33 (13.47) |
| Pretest | Fixation Count | Q8 address | Z = -1.961 (p = 0.05) | 6.11 (3.18) | 3.57 (1.39) |
Table 5: Some effects of test-taking anxiety on test-taking behavior
| Question & adjacent word | Mann-Whitney U | High Scorers Mean (SD) | Low Scorers Mean (SD) | |
|---|---|---|---|---|
| Pretest | Q35 idea | Z = -3.24 (p = .001) | 1156.03(154.86) | 1381.95 (145.62) |
| Pretest | Q35 from | Z = -3 (p = .003) | 1215.93 (28.5) | 1427.72 (129.12) |
| Pretest | Q36 example | Z = -2.626 (p = .009) | 1327.04 (142.58) | 1530.51 (95.64) |
| Pretest | Q36 overlooked | Z = -2.43 (p = .015) | 1111.67(448.04) | 1462.86 (150.79) |
| Pretest | Q38 rigorous | Z = -2.205 (p = .027) | 1270.64 (106.15) | 1477.17 (146.73) |
| Posttest | Q31 of Earth | Z = -1.952 (p = .051) | 1205.11 (213.34) | 1418.73 (229.78) |
| Posttest | Q32 dynamic | Z = -2.154 (p = .031) | 1216.77 (145.11) | 1343.38 (172.67) |
| Posttest | Q33 and | Z = -3.033 (p = .002) | 1226.26 (137.76) | 1294.69 (22.02) |
| Posttest | Q34 historical | Z = -1.963 (p = .050) | 1215.41 (250.29) | 1324.28 (102.47) |
| Posttest | Q35 and | Z = -2.216 (p = .027) | 1322.81 (125.761) | 1348.99 (79.13) |
| Posttest | Q37 identify | Z = -2.154 (p = .031) | 1202.86 (375.79) | 1352.81 (237.40) |
| Posttest | Q39 problems | Z = -2.703 (p = .007) | 1301.01 (29.27) | 1438.81 (159.43) |
| Posttest | Q40 monitoring | Z = -3.824 (p = .000) | 1292.33 (26.93) | 1448.97 (144.73) |
Table 6: High and low scorers’ time to first fixation on words adjacent to blanks
5 CONCLUSION AND IMPLICATIONS
In this study, we wanted to investigate whether different types of test preparation (explicit, implicit, or almost none) differentially affected L2-listening test scores, especially when the test takers were relatively unfamiliar, from the onset, with the L2-listening-test format. We measured the test takers’ levels of testwiseness and test-taking anxiety similar to the ways in which these constructs have been measured in the past in empirical research (Rogers & Harley 1999; Hewitt & Stephenson 2012; Golchi 2012; Horwitz 2010; In’nami 2006; Cassady & Johnson 2002; Taguchi 2001; Kalechstein, Hocevar & Kalechstein 1998; Horwitz, Horwitz & Cope 1986). We did this both before and after the test takers participated in four hours (over two weeks’ time) of test preparation, with the test takers being assigned to one of three groups so that the groups would be equal in L2-listening proficiency before the test-preparation lessons. Thus, any gains or advantages by group on the second, L2-listening test could be attributed to the treatment (the type of test preparation received), and not due to differences the individual learners had in L2 proficiency coming into the study.
We were surprised to find that the three different instructional types had no measurable, differential effects on the students’ L2-listening post-test scores, their testwiseness (defined as L2-listening strategies and testing-taking strategies), or their test-taking-anxiety levels. Instead, we found that, overall, even extremely concise test preparation appears to help students perform a bit better on high-stakes, standardized tests.
We can claim this here because even the control group, which had only one round of practice (in that the pre-test was a practice test), performed better on the post-test, as did the learners in the other two experimental groups with more test preparation (four additional hours each). In this study, we also found the data corroborated results from Golchi (2012), in that lower test-taking anxiety was related to higher listening test scores. But Golchi also found that listening strategies were inversely related to anxiety (lower anxiety corresponded with higher scores on a listening strategy inventory). But we did not find a relationship between testwiseness (which included test-taking strategies and listening strategies) and test-taking anxiety in our data. We also did not find that strategies were (in this test, and with this population) related to listening test scores. Our study points to the notion that these may be three distinct and separable variables, at least for the population we investigated.
Overall, the main finding of this study is that the benefits of test preparation may materialize even from short test preparation, that is, from taking the test even just once beforehand as a practice test. Familiarization with the test format may be, hands down, the most important aspect of test preparation. We find that, based on this study, we now agree very much with what Jafari and Hashim (2012) wrote:
Rather than plunging students directly into the listening task without any introduction to it, FL/L2 listeners need to be “tuned in” so that before listening they know what to expect, both in general and for particular tasks. (p. 271)
Jafari and Hashim (2012) investigated a certain type of listening-test preparation-giving students key words before listening-but we think their conclusions are right for also suggesting, in relation to this study, that L2-listening-test takers need to know what to expect in terms of the exam format. They need to know what tasks will be on the test, how the tasks will be presented, and what will be tested. Knowing this will help test takers maximize their observed scores. But test takers might not need much more than that. They may not need extensive test preparation, and extensive test preparation may, in the end, only result in a narrowing of the learner’s L2-listening repertoire, especially if test preparation supersedes other forms or genres of L2-listening-skills practice and task performance.
In a nutshell, extreme and lengthy test preparation, we surmise, may only help a learner bulk-up on the single L2-listening construct being targeted on the test, leaving the learners’ other skills and domains in L2-listening (comparatively) under-developed. We believe that researchers need to more robustly investigate the effects of longer test preparation on test scores and skill learning. This is because extensive test preparation (some of which may be years long) most certainly does more than just increase testwiseness: cherry-picked L2 skills (matching those assessed on the test) are emphasized, practiced, and learned. The question is, does extensive test preparation narrow learning so much that a student’s test-score no longer represents his or her ability to perform in the real, academic world (one without a narrowed curriculum)?
Révész and Brunfaut (summarizing Rost 2005, 2011) noted that L2 listening is a complex, cognitive process that can be defined in terms of four overlapping mechanisms: neurological, linguistic, semantic, and pragmatic processing. They wrote that, in particular, semantic processing involves isolating salient information (e.g., distinguishing new information from old information), activating relevant schemata or mental knowledge networks against which the input is compared, making inferences on the basis of what is explicitly stated in the text, and updating memory representations guided by the previous semantic processes. They described how pragmatic processing encompasses the evaluation of the speaker’s meaning against the listener’s expectations, the activation of the social frame (i.e., the roles and statuses participants have in the interaction), and the integration of contextual information. As a result of these pragmatic processes, the listener becomes equipped with the ability to (a) provide interactive responses while listening and (b) to supply substantive responses in reaction to the speaker’s message (Rost 2005, 2011).
However, in the L2-listening tests that formed the basis of this research, a listener’s normal task of isolating salient information and activating relevant schemata is done for the listener priori. The listener does not identify what is relevant in the speech stream; rather, he or she must perform the pre-determined (on the test) task and isolate the information the test designers’ have deemed as most salient and important for comprehension.
Some of these listening tasks or skills that Rost, Révész and Brunfaut discussed (isolating salient information, activating mental knowledge networks, understanding expectations) are provided by test creators on L2-listening tests, especially when tests involve fill-in-the-gap and MC questions, as seen here. The test-writer has already isolated the salient information and the relevant schemata-it is the test taker’s job to understand what the test writer wants him or her (the test taker) to do with the listening material. The test creator has expectations. Backed up by our research here, we believe that test preparation, even in minimalistic terms, such as by taking a sample practice test, helps test takers identify the test creators’ expectations and the proposed listening frameworks and schemata just enough to maximize observed scores. In this sense, test preparation is essential, especially when complex and unfamiliar item formats are involved on the test, but extensive test preparation is most likely not needed, especially when the test takers are adults used to taking standardized tests, as in the test takers were in this study.
Thus, a question arises about the potential ethical issue of large test companies promoting the (extra) purchase of extensive test-preparation courses or expensive test preparation materials in addition to purchasing the actual test session itself. A reviewer of this paper pointed out that most, if not all, major test companies provide some form of free sample tests. We believe they do so for a reason: practice testing helps familiarize individuals with the test format, a necessary precursor to ensuring one’s observed score is close to his or her true score. But we believe it is not clear if the testing companies monitor levels of practice (no practice, practice through free materials, practice through purchased materials and/or courses), nor does it appear that testing companies monitor the impact of different types of practice on scores.
If, as this research shows, extensive test preparation is not needed (although studies with even lengthier test preparation sessions are needed to verify such speculations), and if more simple practice-testing is adequate for maximizing one’s observed score, then perhaps the test companies may need to soften their claims that test preparation (beyond free practice-testing) is beneficial or even crucial for some test takers. For example, as reviewed at the beginning of this paper, the IELTS™ (2004) test-preparation document viewable on and downloadable from the IELTS website stated that test takers “don’t have to attend a preparation course, but many candidates find that doing so helps them improve their performance”. Perhaps the authors of the document may need to back up such claims with empirical research if such claims are to remain on the website. Likewise, the College Board recommends that French language learners should review sample listening questions before taking the French with Listening SAT Subject Test. Various levels of practice, from free to paid, are offered, but the website offers no explanation of the differential effects of these packages. Perhaps The College Board could ask test takers to self-identify, when they take the test, whether or not they actually reviewed sample listening questions beforehand, and whether they
additionally paid for and worked with more extensive test preparation materials. That way, the testing company itself could investigate whether those who did not practice score, on average, significantly lower on the test than those who did practice, and whether purchased materials (versus freely available ones) make for additional gains in scores.
Such data could reveal whether a bias exists against those who are less testwise and who do not take opportunities to familiarize themselves with the test format. If such a bias were found, then testing companies like the College Board would have to seriously reconsider the role of test preparation on test outcomes. The companies may have to make a certain minimal amount of test preparation (test familiarization, for example, through a practice testing session) mandatory or part of the actual test-taking process, rather than disadvantage (in terms of score outcomes) those who don’t do it. Ensuring a minimal amount of test familiarization across the board could ensure that testwiseness is not contributing to any measurable or significant amount of test takers’ variation in test scores.
We would like to mention here that this study demonstrates that researchers investigating test-taking behaviors need the sensitive and objective measures of attention and processing that eye-movement data provide. As described by Robinson, Mackey, Gass, and Schmidt (2012, p. 261), “verbal reports are unlikely to faithfully reflect everything that learners are attending to and aware of”. We found that eye-tracking is an indispensable technique to examine the effects of test-taking behaviors because it reveals whether specific background variables actually induce test takers to process tests in any given way. Although this was not abundantly revealed in the present data set, the eye-movement recordings indicated that certain test-taker characteristics were associated with certain types of focal attention on the test.
We would like to conclude by discussing some of the main limitations of this study. Because of the nature of the first and last parts of data collection (which were one-on-one in a language lab), we were unable to collect data from a large number of learners. Sixty-three learners is a very large data set in terms of eye-tracking data, but it is a small sample population when measuring the effects of different treatment types on test scores. We fully recognize that the group-level, experimental (non-eye-tracking) part of this research should be replicated with much larger learner numbers. A study of pre-existing data, or a few simple questions about test-preparation on large-scale administrations of standardized tests, would enable researchers to conduct such investigations.
A second limitation we had was in methods in analyzing the eye-movement data. Empirical eye-movement research on L2-assessment is only beginning, with studies by Bax (2013) and others (i.e., Suvorov 2009; Wagner 2007; Bax & Weir 2012) only recently emerging in the literature. We felt we were limited in our ability to analyze the data empirically because we had to, in a sense, invent the wheel.
However, in the future, we would like to take advantage of recent work in scan-path analysis and apply such statistical analyses to select parts of the eye-movement records. We hope that collaborations by researchers conducting similar research will continue in the years to come, and that the field will eventually converge on methods in analyzing the scan-path data of L2-test takers.
Additionally, this study involved a large proportion of East Asian students already in the United States. These individuals may have already been well-versed in testwiseness, forming a possible limitation of the study from the outset. The participants were rather homogeneous in terms of their level of English. The question remains as to whether lower-ability test takers might benefit more from testwiseness. And in this study, we were not able to replicate the true environment of high-stakes testing.
When interpreting the study’s results, we and all readers need to take these issues into consideration.
Despite these limitations, we believe language-testing researchers must explore more fully how eye-movement data can be employed to investigate the impacts of individual differences such as testwiseness and test-taking-anxiety on test performance. The next logical step that we will take is to combine the eye-tracking data with the stimulated recall data. Doing so may allow us to understand more fully how eye-movement data can be best interpreted when researchers are investigating the complex nature of L2-listening test performance.
6 ACKNOWLEDGEMENTS
A portion of this paper was presented at the Language Testing Research Colloquium (LTRC) in Amsterdam in June 2014.
We would like to thank the British Council, the English Language Center, and the College of Arts and Letters for their support and funding of this project. We would also like to thank Vineet Bansal and Laura Ballard for their contributions to this project.
The views and opinions in this paper are our own and do not reflect those of the funders. Any mistakes in this manuscript are our fault alone.
References
- ACTFL, 2012, Proficiency Guidelines.
- Arnold, J, 2000, ‘Seeing through listening comprehension exam anxiety’, TESOL Quarterly, vol. 34, no. 4, pp. 777-786.
- Bax, S, 2013, ‘The cognitive processing of candidates during reading tests: Evidence from eye-tracking’, Language Testing, vol. 30, no. 4, pp. 441-465.
- Bax, S & Weir, C, 2012, ‘Investigating learners’ cognitive reading processes during a computer-based CAE Reading test’, University of Cambridge ESOL Examinations Research Notes, vol. 47, no. 1, pp. 3-14.
- Brysbaert, M & Nazir, T, 2005, ‘Visual constraints in written word recognition: Evidence from the optimal viewing position effect’, Journal of Research in Reading, vol. 28, no. 3, pp. 216-228.
- Buck, G, 2001, Assessing listening, Cambridge University Press, Cambridge.
- Cambridge IELTS 7, 2009, Cambridge University Press, Cambridge.
- Cambridge IELTS 8, 2011, Cambridge University Press, Cambridge.
- Carter, K, 1986, ‘Test-wiseness for teachers and students’, Educational Measurement: Issues and Practice, vol. 5, no. 4, pp. 20-23.
- Cassady, JC & Johnson, RE, 2002, ‘Cognitive test anxiety and academic performance’, Contemporary Educational Psychology, vol. 27, no. 2, pp. 270-295.
- Chalhoub-Deville, M, 1997, ‘Theoretical models, assessment frameworks, and test construction’, Language Testing, vol. 14, pp. 3-22.
- Chalhoub-Deville, M, 2001, ‘Task-based assessments: Characteristics and validity evidence’, in Researching pedagogic tasks, eds M Bygate, P Skehan & M Swain, Pearson Education, Harlow, England, pp. 210-228.
- Cheng, Y-S, 2004, ‘A measure of second language writing anxiety: Scale development and preliminary validation’, Journal of Second Language Writing, vol. 13, no. 4, pp. 313-335.
- Cohen, AD, 2007, ‘The coming of age of research on test-taking strategies’, Language Assessment Quarterly, vol. 3, no. 4, pp. 307-331.
- Cohen, AD & Upton, TA, 2007, ‘I want to go back to the text’: Response strategies on the reading subtest of the new TOEFL®, Language Testing, vol. 24, no. 2, pp. 209-250.
- Dolly, JP & Williams, KS, 1986, ‘Using test-taking strategies to maximize multiple-choice test scores’, Educational & Psychological Measurement, vol. 46, no. 3, pp. 619-625.
- Dunkel, P, 1991, ‘Listening in the native and the second/foreign language: Toward an integration of research and practice’, TESOL Quarterly, vol. 25, no. 3, pp. 431-457.
- Elkhafaifi, H. 2005, ‘Listening comprehension and anxiety in the Arabic language classroom’, The Modern Language Journal, vol. 89, no. 2, pp. 206-220.
- Ergene, T, 2003, ‘Effective interventions on test anxiety reduction. A meta-analysis’, School Psychology International, vol. 24, no. 3, pp. 313-328.
- Feng, G, 2014, ‘Using eye tracking to optimize educational assessment: Present and future’, Tobii Eye Tracking Conference, September 11-12, Washington, DC.
- Field, A, 2009, Discovering statistics using SPSS, 3rd edn, Sage, Thousand Oaks, CA.
- Fujii, Y, 1993, ‘Construction of a Test Influence Inventory (TII)’, Japanese Journal of Psychology, vol. 64, pp. 135-139.
- Gass, SM & Mackey, A, 2000, Stimulated recall methodology in second language research, Erlbaum, Mahwah, NJ.
- Godfroid, A & Uggen, MS, 2013, ‘Attention to irregular verbs by beginning learners of German: An eye-movement study’, Studies in Second Language Acquisition, vol. 35, no. 2, pp. 291-322.
- Goh, CCM, 2000, ‘A cognitive perspective on language learners’ listening comprehension problems’, System, vol. 28, no. 1, pp. 55-75.
- Golchi, MM, 2012, ‘Listening anxiety and its relationship with listening strategy use and listening comprehension among Iranian IELTS learners’, International Journal of English Linguistics, vol. 2, no. 4, pp. 115-128.
- Gregersen, TS, 2005, ‘Nonverbal cues: Clues to the detection of foreign language anxiety’, Foreign Language Annals, vol. 38, no. 3, pp. 388-400.
- Gregersen, TS & Horwitz, EK, 2002, ‘Language learning and perfectionism: Anxious and non-anxious language learners’ reactions to their own oral performance’, The Modern Language Journal, vol. 86, no. 4, pp. 562-270.
- Hembree, R, 1988, ‘Correlates, causes, effects, and treatment of test anxiety’, Review of Educational Research, vol. 58, no. 1, pp. 47-77.
- Hewitt, E & Stephenson, J, 2012, ‘Foreign language anxiety and oral exam performance: A replication of Phillips’s MLJ study’, The Modern Language Journal, vol. 96, no. 2, pp. 170-189.
- Horwitz, EK, 2010, ‘Foreign and second language anxiety’, Language Teaching, vol. 43, no. 2, pp. 154-167.
- Horwitz, EK, Horwitz, MB & Cope, J, 1986, ‘Foreign language classroom anxiety’, The Modern Language Journal, vol. 70, no. 2, pp. 125-132.
- In’nami, Y, 2006, ‘The effects of test anxiety on listening test performance’, System, vol. 34, no. 3, pp. 317-340.
- Jafari, K & Hashim, F, 2012, ‘The effects of using advance organizers on improving EFL learners’ listening comprehension: A mixed method study’, System, vol. 40, no. 2, pp. 270-281. Available from: Linguistics and Language Behavior Abstracts (LLBA).
- Kalechstein, PB, Hocevar, D & Kalechstein, M, 1998, ‘Effects of test-wiseness training on test anxiety, locus of control and reading achievement in elementary school children’, Anxiety Research, vol. 1, no. 3, pp. 247-261.
- Kim, JH, 2000, Foreign language listening anxiety: A study of Korean students learning English, dissertation thesis, University of Texas.
- Kimura, H., 2008, ‘Foreign language listening anxiety: Its dimensionality and group differences’, JALT Journal, vol. 30, no. 2, pp. 173-195.
- Kliegl, R, Nuthmann, A & Engbert, R, 2006, ‘Tracking the mind during reading: The influence of past, present, and future words on fixation durations’, Journal of Experimental Psychology: General, vol. 135, pp. 12-35.
- MacIntyre, PD & Gardner, RC, 1989, ‘Anxiety and second-language learning: Toward a theoretical clarification’, Language Learning, vol. 39, pp. 251-275.
- MacIntyre, PD & Gardner, RC, 1991, ‘Language anxiety: Its relationship to other anxieties and to processing in native and second languages’, Language Learning, vol. 41, pp. 513-534.
- Mayer, RE & Moreno, R, 1998, ‘A split-attention effect in multimedia learning: Evidence for dual processing systems in working memory’, Journal of Educational Psychology, vol. 90, no. 2, pp. 312-320.
- Millman, J, Bishop, CH & Ebel, R, 1965, ‘An analysis of test-wiseness’, Educational & Psychological Measurement, vol. 25, no. 3, pp. 707-726.
- Mitchell, DC, Shen, X, Green, MJ & Hodgson, TL, 2008, ‘Accounting for regressive eye-movements in models of sentence processing: A reappraisal of the Selective Reanalysis hypothesis’, Journal of Memory and Language, vol. 59, no. 3, pp. 266-293. Available from: Linguistics and Language Behavior Abstracts (LLBA).
- Pan, Y-C, 2010, ‘Enhancing students’ communicative competency and test-taking skills through TOEIC preparatory materials’, TESOL Journal, vol. 3, pp. 81-91.
- Paul, AM, 2012, ‘How to be a better test-taker’, New York Times, April 15, p. ED15.
- Rayner, K, 2009, ‘Eye movements and attention in reading, scene perception, and visual search’, The Quarterly Journal of Experimental Psychology, vol. 62, no. 8, pp. 1457-1506.
- Rayner, K, Reichle, ED & Pollatsek, A, 2005, ‘Eye movement control in reading and the E-Z Reader model’, in Cognitive processes in eye guidance, ed. G Underwood, Oxford University Press, Oxford, pp. 131-162.
- Reichle, ED, Liversedge, SP, Drieghe, D, Blythe, HI, Joseph, HSSL, White, SJ & Rayner, K, 2013, ‘Using E-Z Reader to examine the concurrent development of eye-movement control and reading skill’, Developmental Review, vol. 33, no. 2, pp. 110-149.
- Reichle, ED, Rayner, K & Pollatsek, A, 2003, ‘The E-Z Reader model of eye-movement control in reading: Comparisons to other models’, Behavioral and Brain Sciences, vol. 26, no. 4, pp. 445-526. Available from: Linguistics and Language Behavior Abstracts (LLBA).
- Reichle, ED, Warren, T & McConnell, K, 2009, ‘Using E-Z Reader to model the effects of higher level language processing on eye movements during reading’, Psychonomic Bulletin & Review, vol. 16, no. 1, pp. 1-21.
- Révész, A & Brunfaut, T, 2013, ‘Text characteristics of task input and difficulty in second language listening comprehension’, Studies in Second Language Acquisition, vol. 35, no. 1, pp. 31-65. Available from: Linguistics and Language Behavior Abstracts (LLBA).
- Rogers, WT & Harley, D, 1999, ‘An empirical comparison of three-and four-choice items and tests: Susceptibility to testwiseness and internal consistency reliability’, Educational and Psychological Measurement, vol. 59, no. 2, pp. 234-247.
- Rogers, WT & Yang, P, 1996, ‘Test-wiseness: Its nature and application’, European Journal of Psychological Assessment, vol. 12, no. 3, pp. 247-259.
- Rost, M, 1990, Listening in language learning, Longman, London.
- Rost, M., 2005, ‘L2 listening. In E. Hinkel (Ed.), Handbook of research in second language teaching and learning’, in Handbook of research in second language teaching and learning, ed. E Hinkel, Lawrence Erlbaum Associates, Mahwah, NJ, pp. 503-527.
- Saito, Y, Garza, T & Horwitz, EK, 1999, ‘Foreign language reading anxiety’, The Modern Language Journal, vol. 83, pp. 202-218.
- Sarason, IG, 1975, ‘The test anxiety scale: Concept and research’, in Stress and anxiety, vol. 2, eds IG Sarason & CD Spielberger, Hemisphere, Washington, DC, pp. 193-217.
- Sarnaki, RE, 1979, ‘An examination of test-wiseness in the cognitive domain’, Review of Educational Research, vol. 49, no. 2, pp. 252-279.
- Segalowitz, N, 2010, Cognitive bases of second language fluency, Routledge, New York.
- Seiber, JE, 1980, ‘Defining test anxiety: problems and approaches’, in Test anxiety: theory, research and applications, ed. IG Sarason, Lawrence Erlbaum Associates, Hillsdale, NJ, pp. 15-42.
- Sparks, RL & Ganschow, L, 2007, ‘Is the foreign language classroom anxiety scale measuring anxiety or language skills?’, Foreign Language Annals, vol. 40, no. 2, pp. 260-287.
- Suvorov, R, 2009, ‘Context visuals in L2 listening tests: The effects of photographs and video vs. audio-only format’, in Developing and evaluating language learning materials, eds CA Chapelle, HG Jun & I Katz, Iowa State University, Ames, IA, pp. 53-68.
- Taguchi, N, 2001, ‘L2 learners’ strategic mental processes during a listening test’, JALT Journal, vol. 23, no. 2, pp. 176-201.
- Vandergrift, L, 2005, ‘Relationships among motivation, orientations, metacognitive awareness and proficiency in L2 listening’, Applied Linguistics, vol. 26, no. 1, pp. 70-89.
- Vandergrift, L, 2007, ‘Recent developments in second and foreign language listening comprehension research’, Language Teaching, vol. 40, no. 3, pp. 191-201.
- Wagner, E, 2004, A construction validation study of the extended listening sections of the ECPE and MELAB, English Language Institute, University of Michigan, Ann Arbor, MI.
- Wagner, E, 2007, ‘Are they watching? Test-taker viewing behavior during an L2 video listening test’, Language Learning & Technology, vol. 11, no. 1, pp. 67-86.
- Warren, T & McConnell, K, 2007, ‘Investigating effects of selectional restriction violations and plausibility violation severity on eye-movements in reading’, Psychonomic Bulletin & Review, vol. 14, no. 1, pp. 770-775.
Appendix A. Questionnaire Questions With Average Responses By Group (Explicit, Implicit, Control)
| Listening Strategies Questionnaire | Explicit Pre-treatment M | Explicit Pre-treatment SD | Explicit Post-treatment M | Explicit Post-treatment SD | Implicit Pre-treatment M | Implicit Pre-treatment SD | Implicit Post-treatment M | Implicit Post-treatment SD | Control Pre-treatment M | Control Pre-treatment SD | Control Post-treatment M | Control Post-treatment SD |
|---|---|---|---|---|---|---|---|---|---|---|---|---|
| 1. While listening, I ignore irrelevant information. | 4.38 | 1.24 | 4.45 | 1.43 | 4.18 | 1.62 | 4.23 | 1.51 | 4.05 | 1.18 | 3.90 | 1.37 |
| 2. I concentrate hard on what the speaker is saying. | 3.29 | 1.42 | 3.95 | 1.05 | 3.45 | 1.77 | 3.36 | 1.81 | 3.53 | 1.58 | 3.60 | 1.35 |
| 3. I use my knowledge of my first language, primarily sound. | 4.14 | 1.39 | 4.25 | 1.41 | 3.91 | 1.60 | 3.82 | 1.44 | 4.11 | 1.49 | 4.30 | 1.42 |
| 4. I guess the meaning of unknown words, using tone of voice as a clue. | 4.29 | 1.31 | 4.15 | 1.31 | 3.50 | 1.68 | 4.23 | 1.60 | 4.26 | 1.24 | 4.25 | 1.12 |
| 5. Before listening, I set a goal for listening. | 3.57 | 1.80 | 3.65 | 1.63 | 3.27 | 2.12 | 3.82 | 1.92 | 3.16 | 1.64 | 3.80 | 1.51 |
| 6. I use my prior experience to guess meanings. | 4.43 | 1.63 | 4.85 | 1.14 | 4.86 | 1.08 | 4.73 | 1.24 | 4.63 | 1.26 | 4.60 | 0.99 |
| 7. I use the topic to determine the words that I will listen for. | 4.19 | 1.60 | 4.75 | 1.07 | 4.55 | 1.44 | 4.50 | 1.26 | 4.68 | 1.00 | 4.75 | 1.12 |
| 8. I try to recognize names (famous people, historical figures, places, buildings…etc.) to help me know what the speaker is talking about. | 4.33 | 1.62 | 4.55 | 0.94 | 4.27 | 1.80 | 3.91 | 1.48 | 3.53 | 1.78 | 3.95 | 1.64 |
| 9. While listening, I make up a story line, or adopt a clever perspective. | 3.10 | 1.51 | 3.75 | 1.41 | 3.23 | 1.51 | 3.59 | 1.26 | 3.42 | 1.22 | 3.60 | 1.23 |
| 10. I make a mental or written summary of language and information presented in a listening task. | 3.67 | 1.32 | 3.70 | 1.45 | 2.86 | 1.91 | 3.68 | 1.52 | 3.89 | 1.24 | 3.60 | 1.82 |
| 11. I translate, while and/or after listening. | 3.48 | 1.81 | 3.35 | 1.50 | 2.91 | 1.87 | 2.95 | 1.89 | 2.79 | 1.36 | 3.25 | 1.68 |
| 12. I use my knowledge of other languages. | 3.05 | 1.86 | 3.15 | 1.73 | 3.50 | 1.92 | 3.23 | 1.82 | 2.89 | 1.52 | 3.40 | 1.70 |
| 13. I use knowledge of the kinds of words such as parts of speech. | 3.76 | 1.45 | 4.45 | 1.10 | 3.41 | 1.68 | 3.77 | 1.41 | 3.89 | 1.59 | 3.35 | 1.60 |
| 14. When I write down what I heard, it comes to my mind what it means. | 4.29 | 1.31 | 4.35 | 1.04 | 4.86 | 1.08 | 4.86 | 0.99 | 4.68 | 1.20 | 4.15 | 1.04 |
| 15. While listening, I monitor my understanding of the listening passage discourse structure (e.g., compare/contrast, description, definition). | 3.95 | 1.20 | 4.25 | 0.91 | 4.09 | 1.48 | 4.14 | 1.32 | 4.00 | 1.11 | 4.05 | 1.05 |
| Total | 3.86 | 1.50 | 4.11 | 1.27 | 3.79 | 1.64 | 3.92 | 1.50 | 3.84 | 1.36 | 3.90 | 1.38 |
| TEST-TAKING STRATEGIES QUESTIONNAIRE | Explicit pre-treatment M | Explicit pre-treatment SD | Explicit post-treatment M | Explicit post-treatment SD | Implicit pre-treatment M | Implicit pre-treatment SD | Implicit post-treatment M | Implicit post-treatment SD | Control pre-treatment M | Control pre-treatment SD | Control post-treatment M | Control post-treatment SD |
|---|---|---|---|---|---|---|---|---|---|---|---|---|
| 1. I read the multiple-choice options before listening. | 4.84 | 1.38 | 5.29 | 1.06 | 4.82 | 1.62 | 4.82 | 1.40 | 5.05 | 1.58 | 5.40 | 1.23 |
| 2. I eliminate incorrect options while listening. | 3.68 | 1.49 | 4.29 | 1.55 | 3.23 | 1.90 | 4.73 | 1.16 | 3.68 | 1.63 | 4.50 | 1.32 |
| 3. I predict my own answer after listening and then look at the options. | 3.63 | 1.71 | 3.95 | 1.75 | 4.27 | 1.72 | 3.82 | 1.65 | 3.32 | 1.42 | 3.25 | 1.37 |
| 4. I make a guess based on vocabulary used in the questions and options. | 4.26 | 1.45 | 4.43 | 1.47 | 4.50 | 1.60 | 4.45 | 1.63 | 4.26 | 1.41 | 4.40 | 1.10 |
| 5. I eliminate options that appear to be overlapping. | 4.21 | 1.36 | 3.76 | 1.48 | 3.27 | 1.58 | 3.55 | 1.44 | 4.11 | 1.63 | 4.05 | 1.36 |
| 6. I listen for the words that appear in the questions and options. | 5.00 | 1.20 | 5.10 | 1.09 | 5.23 | 1.07 | 5.09 | 1.23 | 5.16 | 0.90 | 5.45 | 0.83 |
| 7. I pay extra attention to spelling. | 3.63 | 1.38 | 3.90 | 1.45 | 3.77 | 1.60 | 3.86 | 1.78 | 3.58 | 1.71 | 4.00 | 1.49 |
| 8. I pay extra attention to singular and plural forms. | 3.26 | 1.66 | 3.86 | 1.46 | 2.68 | 1.84 | 3.32 | 1.96 | 3.42 | 1.22 | 3.25 | 1.25 |
| 9. I pay extra attention to measurement units. | 3.32 | 1.42 | 3.86 | 1.46 | 3.73 | 1.58 | 3.95 | 1.56 | 3.53 | 1.50 | 3.85 | 1.42 |
| 10. While listening, I don’t mark on the answer sheet. | 4.00 | 1.89 | 3.05 | 1.94 | 3.55 | 2.22 | 2.50 | 1.57 | 2.16 | 1.42 | 2.20 | 1.77 |
| 11. I pay extra attention to numbers. | 4.37 | 1.38 | 5.14 | 0.96 | 4.50 | 1.41 | 4.32 | 1.62 | 4.63 | 1.26 | 4.75 | 1.16 |
| 12. I only listen for relevant information to answer the questions. | 4.11 | 1.24 | 4.29 | 1.45 | 4.32 | 1.46 | 4.14 | 1.17 | 4.37 | 1.38 | 4.70 | 1.26 |
| 13. I fill in the answer sheet anyway, though I’m not sure. | 3.68 | 1.49 | 4.57 | 1.57 | 3.91 | 1.63 | 4.55 | 1.22 | 4.21 | 1.65 | 4.50 | 1.54 |
| 14. I pay extra attention to the beginning part of the listening passage. | 4.26 | 1.52 | 4.48 | 1.29 | 4.50 | 1.30 | 3.86 | 1.61 | 4.63 | 1.07 | 4.30 | 1.59 |
| 15. I predict the topic in the listening passage by looking the questions and options. | 4.95 | 0.85 | 4.95 | 1.36 | 4.64 | 1.47 | 4.41 | 1.37 | 4.74 | 1.19 | 4.70 | 0.98 |
| 16. I double check my answer to see if it is not awkward in context. | 4.16 | 1.54 | 4.29 | 1.31 | 3.77 | 1.72 | 4.23 | 1.54 | 4.16 | 1.64 | 4.05 | 1.82 |
| Total | 4.09 | 1.44 | 4.32 | 1.41 | 4.04 | 1.61 | 4.10 | 1.49 | 4.06 | 1.41 | 4.21 | 1.34 |
| TEST-TAKING ANXIETY QUESTIONNAIRE | Explicit pre-treatment M | Explicit pre-treatment SD | Explicit post-treatment M | Explicit post-treatment SD | Implicit pre-treatment M | Implicit pre-treatment SD | Implicit post-treatment M | Implicit post-treatment SD | Control pre-treatment M | Control pre-treatment SD | Control post-treatment M | Control post-treatment SD |
|---|---|---|---|---|---|---|---|---|---|---|---|---|
| 1. Before taking a test, I feel confident and relaxed.* | 3.35 | 1.35 | 2.90 | 1.73 | 3.18 | 1.62 | 2.73 | 1.39 | 3.11 | 1.41 | 2.80 | 1.47 |
| 2. I am less nervous about tests than the average college students.* | 3.20 | 1.58 | 3.10 | 1.55 | 3.23 | 1.57 | 3.32 | 1.62 | 3.63 | 1.64 | 3.05 | 1.36 |
| 3. During tests, I find myself thinking of the consequences of failing. | 2.85 | 1.60 | 2.48 | 1.44 | 3.68 | 1.67 | 2.95 | 1.36 | 3.05 | 1.68 | 2.90 | 1.48 |
| 4. During a course examination, I get so nervous that I forget facts I really know. | 3.20 | 1.85 | 3.14 | 1.71 | 3.18 | 1.71 | 3.14 | 1.49 | 2.95 | 1.68 | 3.15 | 1.73 |
| 5. After taking a test, I feel I could have done better than I actually did. | 4.25 | 1.41 | 4.14 | 1.39 | 4.41 | 1.79 | 4.27 | 1.49 | 3.42 | 1.61 | 3.60 | 1.57 |
| 6. I am a poor test taker in the sense that my performance on a test does not show how much I really know about a topic. | 3.70 | 1.45 | 3.19 | 1.44 | 4.18 | 1.44 | 3.64 | 1.65 | 3.32 | 1.42 | 3.50 | 1.50 |
| 7. When I first get my copy of a test, it takes me a while to calm down to the point where I can begin to think straight. | 4.20 | 1.36 | 3.62 | 1.60 | 4.00 | 1.63 | 3.23 | 1.57 | 2.95 | 1.35 | 3.05 | 1.47 |
| 8. I feel under a lot of pressure to get good grades on tests. | 3.75 | 1.52 | 3.10 | 1.67 | 4.05 | 1.59 | 3.68 | 1.62 | 3.11 | 1.49 | 3.10 | 1.37 |
| 9. When I take a test, my nervousness causes me to make careless errors. | 3.40 | 1.50 | 3.29 | 1.49 | 3.68 | 1.70 | 3.41 | 1.14 | 3.53 | 1.54 | 3.45 | 1.50 |
| 10. While taking an important examination, I find myself wondering whether the other students are doing better than I am. | 3.10 | 1.83 | 3.10 | 1.84 | 3.27 | 1.72 | 3.05 | 1.86 | 2.74 | 1.69 | 2.60 | 1.39 |
| 11. Were you nervous in this test? | 2.95 | 1.18 | 2.62 | 1.40 | 3.29 | 1.59 | 2.86 | 1.49 | 2.95 | 1.47 | 2.50 | 1.40 |
| Total | 3.45 | 1.51 | 3.15 | 1.57 | 3.65 | 1.64 | 3.30 | 1.52 | 3.16 | 1.54 | 3.06 | 1.48 |
*The numbers in this table for statements one and two of the test-taking anxiety are the reversed numbers. That is, we inverted the original responses from the participants to statements one and two because these two statements were worded in the opposite direction from the others in the questionnaire. For example, an original response of a 5 on statement 1 was changed to a 2.
Appendix B: Participant Descriptors: Background Variables And Scores Across Individuals And By Group (Explicit, Implicit, Control)
| Group | ID | Age | Sex | LoR | L1 | Pretest Total Score | Posttest Total Score | Overall Gain Score on Test | Gain Listening Strategies | Gain Test-taking Strategies | Gain Test-taking Anxiety | Gain % Gap Fill | Gain % MC |
|---|---|---|---|---|---|---|---|---|---|---|---|---|---|
| Explicit | 2 | 19 | F | 2 | Chinese | 16.00 | 26.00 | 10.00 | -11.00 | -3.00 | 0.00 | .52 | .13 |
| Explicit | 3 | 18 | F | 2 | Chinese | 29.00 | 32.00 | 3.00 | 10.00 | 4.00 | -1.00 | .17 | .08 |
| Explicit | 6 | 19 | M | 2 | Chinese | 11.00 | 22.00 | 11.00 | 3.00 | 9.00 | -1.00 | .69 | .06 |
| Explicit | 13 | 40 | F | 2 | Chinese | 18.00 | 23.00 | 5.00 | -2.00 | 2.00 | -4.00 | .30 | .05 |
| Explicit | 19 | 44 | M | 9 | Chinese | 8.00 | 10.00 | 2.00 | 1.00 | 3.00 | -3.00 | .15 | -.02 |
| Explicit | 24 | 19 | F | 2 | Chinese | 23.00 | 22.00 | -1.00 | -19.00 | 8.00 | -9.00 | -.13 | .10 |
| Explicit | 25 | 34 | M | 74 | Chinese | 17.00 | 26.00 | 9.00 | 15.00 | 4.00 | -6.00 | .65 | .01 |
| Explicit | 26 | 32 | F | 4 | Chinese | 11.00 | 17.00 | 6.00 | -10.00 | 3.00 | -18.00 | .28 | .10 |
| Explicit | 32 | 39 | F | 2 | Chinese | 4.00 | 6.00 | 2.00 | 19.00 | 17.00 | -8.00 | .14 | -.01 |
| Explicit | 36 | 32 | M | 10 | Chinese | 21.00 | 24.00 | 3.00 | 1.00 | -3.00 | -4.00 | .18 | .05 |
| Explicit | 41 | 24 | F | 6 | Arabic | 11.00 | 18.00 | 7.00 | -1.00 | -4.00 | -15.00 | .27 | .14 |
| Explicit | 42 | 19 | M | 6 | Korean | 19.00 | 20.00 | 1.00 | 13.00 | 34.00 | -11.00 | .25 | -.06 |
| Explicit | 44 | 26 | F | 7 | Arabic | 10.00 | 14.00 | 4.00 | -5.00 | -7.00 | 5.00 | .13 | .11 |
| Explicit | 45 | 47 | M | 93 | Chinese | 10.00 | 18.00 | 8.00 | 2.00 | 0.00 | -3.00 | .38 | .09 |
| Explicit | 47 | 18 | F | 3 | Chinese | 20.00 | 25.00 | 5.00 | 23.00 | 17.00 | -9.00 | .20 | .13 |
| Explicit | 48 | 35 | F | 26 | Chinese | 20.00 | 26.00 | 6.00 | 2.00 | 9.00 | 1.00 | .25 | .13 |
| Explicit | 49 | 20 | ? | 3 | Chinese | 21.00 | 21.00 | 0.00 | -6.00 | -22.00 | 21.00 | -.11 | .09 |
| Explicit | 50 | 20 | M | 3 | Chinese | 16.00 | 28.00 | 12.00 | -5.00 | -10.00 | -8.00 | .71 | .09 |
| Explicit | 52 | 19 | F | 40 | Chinese | 25.00 | 34.00 | 9.00 | -4.00 | -3.00 | 2.00 | .37 | .21 |
| Explicit | 53 | 31 | M | 2 | Chinese | 28.00 | 29.00 | 1.00 | 8.00 | 19.00 | -2.00 | .28 | -.08 |
| Explicit | 54 | 41 | F | 14 | Chinese | 20.00 | 20.00 | 0.00 | 15.00 | 26.00 | -2.00 | .10 | -.03 |
| Average | 28.4 | 15 | 17.05 | 21.95 | 4.90 | 2.33 | 4.90 | -3.57 | 0.28 | 0.06 | |||
| SD | 9.8 | 25 | 6.66 | 6.79 | 3.88 | 10.65 | 12.69 | 7.93 | 0.22 | 0.07 |
Notes: LoR = length of residency in the United States. Participant 49 did not record his or her gender.
| Group | ID | Age | Sex | LoR | L1 | Pretest Total Score | Posttest Total Score | Overall Gain on Test | Gain Listening Strategies | Gain Test-taking Strategies | Gain Test-taking Anxiety | Gain % Gap Fill | Gain % MC |
|---|---|---|---|---|---|---|---|---|---|---|---|---|---|
| Implicit | 1 | 49 | F | 14 | Arabic | 8.00 | 14.00 | 6.00 | 2.00 | 3.00 | 6.00 | .23 | .10 |
| Implicit | 5 | 30 | F | 2 | Arabic | 16.00 | 24.00 | 8.00 | 3.00 | 1.00 | 3.00 | .18 | .26 |
| Implicit | 8 | 19 | F | 2 | Japanese | 25.00 | 33.00 | 8.00 | 3.00 | 27.00 | 6.00 | .44 | .13 |
| Implicit | 10 | 24 | F | 5 | Arabic | 6.00 | 11.00 | 5.00 | 17.00 | -2.00 | -6.00 | .10 | .14 |
| Implicit | 11 | 18 | M | 2 | Chinese | 16.00 | 21.00 | 5.00 | -9.00 | -9.00 | -7.00 | .37 | .02 |
| Implicit | 12 | 19 | F | 3 | Chinese | 23.00 | 24.00 | 1.00 | 18.00 | 4.00 | 9.00 | .26 | -.07 |
| Implicit | 14 | 19 | F | 2 | Chinese | 17.00 | 12.00 | -5.00 | 1.00 | 13.00 | -11.00 | -.21 | -.06 |
| Implicit | 16 | 18 | M | 3 | Chinese | 14.00 | 23.00 | 9.00 | 3.00 | 9.00 | 6.00 | .37 | .18 |
| Implicit | 17 | 20 | F | 2 | Japanese | 18.00 | 23.00 | 5.00 | -6.00 | -22.00 | -16.00 | .30 | .05 |
| Implicit | 20 | 18 | M | 2 | Chinese | 12.00 | 15.00 | 3.00 | -5.00 | -6.00 | -9.00 | .20 | .02 |
| Implicit | 23 | 29 | F | 10 | Chinese | 21.00 | 22.00 | 1.00 | -8.00 | -5.00 | -5.00 | .17 | -.03 |
| Implicit | 27 | 26 | M | 12 | Arabic | 6.00 | 4.00 | -2.00 | 4.00 | 3.00 | 6.00 | .07 | -.13 |
| Implicit | 29 | 31 | F | 5 | Thai | 6.00 | 12.00 | 6.00 | -3.00 | 3.00 | -4.00 | .03 | .22 |
| Implicit | 30 | 49 | F | 2 | Korean | 12.00 | 21.00 | 9.00 | 0.00 | -7.00 | -12.00 | .35 | .18 |
| Implicit | 31 | 50 | M | 2 | Korean | 19.00 | 10.00 | -9.00 | 0.00 | 21.00 | 6.00 | -.13 | -.26 |
| Implicit | 33 | 31 | M | 2 | Chinese | 12.00 | 16.00 | 4.00 | 14.00 | 11.00 | -6.00 | .34 | -.02 |
| Implicit | 34 | 19 | F | 3 | Chinese | 10.00 | 14.00 | 4.00 | 15.00 | 9.00 | -1.00 | .04 | .14 |
| Implicit | 35 | 21 | F | 2.5 | Chinese | 33.00 | 32.00 | -1.00 | 0.00 | -1.00 | -1.00 | .12 | -.04 |
| Implicit | 37 | 25 | F | 6 | Arabic | 26.00 | 24.00 | -2.00 | -7.00 | -2.00 | -3.00 | -.01 | -.04 |
| Implicit | 38 | 22 | F | 3 | Chinese | 27.00 | 29.00 | 2.00 | -4.00 | 2.00 | -4.00 | .17 | .05 |
| Implicit | 39 | 40 | F | 2 | Chinese | 11.00 | 15.00 | 4.00 | 2.00 | -16.00 | -12.00 | .25 | .02 |
| Implicit | 43 | 29 | F | 10 | Chinese | 22.00 | 28.00 | 6.00 | 3.00 | 7.00 | -27.00 | .34 | .09 |
| Average | 27.5 | 4.4 | 16.36 | 19.41 | 3.05 | 1.95 | 1.95 | -3.73 | 0.18 | 0.04 | |||
| SD | 10.5 | 3.7 | 7.52 | 7.64 | 4.61 | 7.84 | 11.07 | 8.81 | 0.17 | 0.12 |
Notes: LoR = length of residency in the United States. Participant 8 lived in the US with her family from ages 5 to 10. This residency is not reflected in her LoR.
| Group | ID | Age | Sex | LoR | L1 | Pretest Total Score | Posttest Total Score | Overall Gain Score on Test | Gain Listening Strategies | Gain Test-taking Strategies | Gain Test-taking Anxiety | Gain % Gap Fill | Gain % MC |
|---|---|---|---|---|---|---|---|---|---|---|---|---|---|
| Control | 101 | 30 | M | 24 | Chinese | 21.00 | 20.00 | -1.00 | 2.00 | -12.00 | -7.00 | .24 | -.15 |
| Control | 102 | 18 | M | 1 | Arabic | 10.00 | 20.00 | 10.00 | 1.00 | -3.00 | 7.00 | .27 | .26 |
| Control | 103 | 26 | M | 12 | Chinese | 25.00 | 32.00 | 7.00 | 10.00 | 5.00 | -2.00 | .30 | .17 |
| Control | 104 | 29 | F | 30 | Chinese | 23.00 | 26.00 | 3.00 | -25.00 | 4.00 | -7.00 | .28 | .01 |
| Control | 105 | 24 | F | 6 | Korean | 8.00 | 11.00 | 3.00 | -10.00 | -12.00 | -2.00 | -.04 | .14 |
| Control | 106 | 19 | M | 8 | Chinese | 6.00 | 13.00 | 7.00 | 3.00 | -13.00 | -5.00 | .09 | .22 |
| Control | 107 | 19 | F | 5 | Chinese | 11.00 | 14.00 | 3.00 | -13.00 | -1.00 | 0.00 | .12 | .06 |
| Control | 108 | 25 | F | 7 | Chinese | 17.00 | 21.00 | 4.00 | 11.00 | 4.00 | -10.00 | .09 | .13 |
| Control | 109 | 33 | M | 17 | Arabic | 13.00 | 10.00 | -3.00 | 9.00 | -10.00 | -1.00 | .03 | -.15 |
| Control | 110 | 19 | F | 2.5 | Chinese | 28.00 | 36.00 | 8.00 | -2.00 | 9.00 | 3.00 | .46 | .13 |
| Control | 111 | 25 | F | 8 | Chinese | 17.00 | 24.00 | 7.00 | -4.00 | 7.00 | 10.00 | .52 | .02 |
| Control | 112 | 19 | F | 2 | Thai | 12.00 | 22.00 | 10.00 | 6.00 | 8.00 | 1.00 | .42 | .18 |
| Control | 113 | 19 | F | 2 | Thai | 12.00 | 23.00 | 11.00 | 13.00 | 8.00 | -8.00 | .55 | .13 |
| Control | 114 | 22 | M | 6 | Korean | 12.00 | 16.00 | 4.00 | -4.00 | 9.00 | -2.00 | .07 | .14 |
| Control | 115 | 25 | M | 6 | Chinese | 22.00 | 33.00 | 11.00 | 1.00 | 6.00 | 2.00 | .70 | .09 |
| Control | 116 | 27 | F | 6 | Chinese | 24.00 | 31.00 | 7.00 | 5.00 | 5.00 | -6.00 | .54 | .00 |
| Control | 117 | 19 | F | 7 | Chinese | 12.00 | 12.00 | 0.00 | 9.00 | 16.00 | 4.00 | .22 | -.06 |
| Control | 118 | 24 | F | 8 | Arabic | 16.00 | 18.00 | 2.00 | 2.00 | 3.00 | -3.00 | .15 | .02 |
| Control | 119 | 19 | M | 12 | Chinese | 15.00 | 23.00 | 8.00 | 7.00 | 2.00 | 2.00 | .29 | .17 |
| Control | 120 | 21 | F | 2 | Korean | 12.00 | 22.00 | 10.00 | 4.00 | 8.00 | -13.00 | .28 | .25 |
| Average | 23.1 | 8.6 | 15.80 | 21.35 | 5.55 | 1.25 | 2.15 | -1.85 | 0.28 | 0.09 | |||
| SD | 4.4 | 7.5 | 6.14 | 7.55 | 4.12 | 9.16 | 8.16 | 5.75 | 0.20 | 0.12 | |||
| Overall average (all 3 groups) | 26.4 | 9.2 | 16.41 | 20.87 | 4.46 | 1.86 | 3.00 | -3.08 | 0.24 | 0.06 | |||
| Overall SD | 8.4 | 15.4 | 6.62 | 7.22 | 4.18 | 8.98 | 10.56 | 7.46 | 0.20 | 0.10 |
Note: LoR = length of residency in the United States.