
The contribution of interlanguage phonology accommodation to inter-examiner variation in the rating of pronunciation in oral proficiency interviews
Official IELTS research report on Examiners and Scoring - Speaking, published in 2009.
Abstract
This study investigates factors that could affect inter-examiner reliability in the pronunciation assessment component of speaking tests. We hypothesise that the rating of pronunciation is susceptible to variation in assessment due to the type and amount of exposure examiners have to non-native English accents.
In this study we conducted an inter-rater variability analysis on the English pronunciation ratings of three representative test candidate interlanguages: Chinese, Korean and Indian English. Pronunciation was rated by 99 examiners across five geographically dispersed test centres where examiners variously reported either prolonged exposure, or no prolonged exposure to the interlanguage of the candidates. The examiners rated the three speaking test candidates with a significant level of inter-rater variation. Pronunciation was rated significantly higher when the candidate’s interlanguage phonology was familiar, and lower when it was unfamiliar. Moreover, a strong association between familiarity and the pronunciation rating was found.
We attribute this to psychoacoustic processes, namely, the perceptual magnet effect, and the resulting sociolinguistic phenomenon at the level of communicative interaction. This phenomenon we have termed interlanguage phonology accommodation. We found that interlanguage phonology accommodation is associated with inter-rater variation and should therefore be a major consideration in the design of speaking tests and rater training.
1 INTRODUCTION
The idea that familiar non-native English (L2) accents are easier to comprehend than unfamiliar accents is well-supported in linguistics and cognitive science literature (Brown 1968; Wilcox 1978; Eisenstein and Berkowitz 1981; Ekong 1982; Richards 1983; Anderson-Hsieh & Koehler 1988; Bilbow 1989; Flowerdew 1994; Major et al 2002; ‘accent’ being used here throughout to refer to the pronunciation of non-native English speakers). As examiners invigilating oral proficiency interviews (OPI) cannot have an equal degree of familiarity with different accents, it is likely that their ability to comprehend accented speech varies in proportion to their linguistic experience. This is because the perceptual weighting that listeners attribute to certain features of pronunciation changes with linguistic experience (Nittrouer et al 1993; Zhang et al 2005).
The question of how linguistic experience shapes perception has been an active area of investigation for speech science researchers over the past thirty years. Various models have been proposed which assist to explain how the linguistic experience of OPI examiners could shape their impression of the examinee’s performance. The first of these models explained how listeners store prototypes of speech sounds that they refer to when perceptually decoding the speech signal. Through a process of exposure to a language, or interlanguages, adults become language-specific perceivers who are perceptually oriented to best instances of phonetic categories, or ‘phonetic prototypes’.
Every individual has a first language-specific underlying organisation of phonetic categories, which are revealed when listeners are tested with a perceptual discrimination task using phonetic prototypes. Early studies revealed that adult listeners could identify phonetic prototypes in their own language (Grieser & Kuhl 1989; Kuhl 1991; Miller 1994). The findings of these studies demonstrated that phonetic prototypes functioned in a particular way in speech perception. When listeners heard a synthetically generated prototype of a phonetic category and were asked to compare it to other synthetically generated (non-prototypical) speech sounds that surrounded it in acoustic space, the prototype perceptually pulled the other members of the category towards itself. This effect has been termed ‘the perceptual magnet effect’ (Kuhl 1991).
Functional magnetic resonance imaging studies support the perceptual magnet effect theory by demonstrating that the brain shifts neural resources away from regions of acoustic space near the centre of a sound category toward regions where accurate discrimination is required (Guenther & Boland 2002; Guenther et al 2004). The brain scans of native English subjects listening to synthetic vowel sounds showed that less auditory cortical activation was present when the subjects were listening to prototypes of vowels than when listening to non-prototypical examples in surrounding acoustic space.
The perceptual magnet effect model proposes exposure to a particular native language (L1) results in a distortion of the perceived distances between stimuli; in a sense, language experience ‘warps’ the acoustic space underlying phonetic perception (Kuhl & Iverson 1995). Research provides strong experimental evidence that simply listening to the ambient language alters phonetic perception over time. Experiments substantiating the perceptual magnet effect theory have been applied to how native children acquire their L1 phonology (Grieser & Kuhl 1989; Kuhl 1991; Guenther & Boland 2002), and to how L2 learners perceive a foreign phonology (Flege 1987; Bohn 1995; Rochet 1995). These studies supported the perceptual magnet effect proposal that language experience alters the mechanisms underlying speech perception.
Another influential model of perception, the Perceptual Assimilation Model (PAM) (Best 1995) outlines how, in perception, non-native speech sounds are variously assimilated: 1) assimilated to a native category, 2) assimilated as an uncategorisable speech sound, and 3) not assimilated (non-speech sound). If the L2 phonetic segment is totally different from anything in the L1, Best argues that there may not be a problem in perception for the learner. Whenever two contrasting phonetic segments in the L1 and L2 are similar, but not the same, problems in both production and perception will occur for the learner. These similar, but different contrasts are also the ones which the examiner may find incomprehensible, unless the examiner has been exposed to them for an adequate period.
In addition to familiarity differences, attitude might also contribute to examiners’ judgements. Speaking proficiency test raters are not devoid of prejudices regarding acceptability of accents. Many papers examine the issues of attitude and stereotype toward perceived accent (Brennan & Brennan 1981; Nesdale & Rooney 1996; Cargile 1997; Rubin & Smith 1990; Mackey and Finn 1997). Research on native speaker perceptions of non-native English accents shows that accent is a stereotyped marker of social class (Brennan & Brennan 1981; Nesdale & Rooney 1996) and it prompts perceptions of personality such as ‘friendliness’ and ‘pleasantness’ (Lindemann 2005). Does this mean that objectivity in pronunciation rating is compromised by attitude and familiarity?
2 THE PRESENT STUDY
In this inter-rater variability study, we put forward the hypothesis that the pronunciation component of the OPI is susceptible to variation in assessment due to the influence of familiarity. This hypothesis is based theoretically on the perceptual magnet effect. It may also, in the case of individual raters, be informed by attitudinal bias. We propose that the examiner’s impression of the examinee’s performance can be positively or negatively influenced according to the examiner’s amount and type of exposure to the candidate’s accent. This phenomenon we have termed interlanguage phonology accommodation.
In OPIs, what may be perceptually incomprehensible to one rater, may be acceptable to another due to the difference in their phonetic prototypes. Similarly, in communities outside the test situation, certain features of interlanguage pronunciation may be accepted by one community, but may deviate from expectations in another. The OPI examiner is expected to make a judgement on the acceptability of the L2 English speaker’s pronunciation, based on a criterion-referenced scale of proficiency. This judgement is made by the trained examiner with reference to the assessment criteria, but this judgement may be influenced by the extent of their exposure to various L2 accents and the norms of their English speech community. Despite the examiner’s intentions to judge the candidate purely on the wording of the assessment criteria descriptors, the examiner’s type and degree of L2 exposure could compete with the objectivity of the rating.
The question addressed by this research is this: do examiners converge perceptually with interlanguage phonology that is familiar to the examiners, and do they perceptually diverge from that which is unfamiliar? For example, is Indian English rated the same in New Delhi (where varieties of Indian English are prevalent) as it is in Sydney (where it is not)? Is Korean English rated the same in Sydney (where Koreans are a large proportion of the international student clientele) as it is in Hong Kong (where Chinese speakers are the majority)? Would a Korean candidate taking the test in Seoul be advantaged due to perceptual accommodation because the examiners live amongst a Korean English speaking community? Do candidates score higher on pronunciation when the interlanguage phonology is familiar to the examiner and do they score lower on pronunciation when it is unfamiliar?
3 METHOD
3.1 Data Collection
Speaking test data were collected from IELTS OPIs conducted in Korea, Hong Kong and India. Each location provided 20 recordings of Korean, (Cantonese) Chinese and Indian candidates respectively. The recordings were recorded with solid state digital ‘dictaphone-type’ recording devices (Sony model ICD-P17) and supplied as 8 kHz or 12 kHz mono WAV sound files. IELTS Australia supplied the vocabulary, grammar, fluency and pronunciation scores for each candidate. Three speakers from the 60 recordings were selected to be used in the rating experiment. The selection was based on the following criteria:
-
The speakers had received a subscore average that would be affected critically if their pronunciation score varied between 4.0 and 6.0 for the OPI section of IELTS. [When this research was conducted in 2005, the pronunciation subscale of the IELTS OPI consisted of four criterion referenced bands of 2.0, 4.0, 6.0 and 8.0. The subscales of ‘Fluency and Coherence’, ‘Lexical Resource’ and Grammatical Range and Accuracy’ were rated on a more discrete nine band scale. Our research report recommendations submitted to IELTS have since contributed to the pronunciation subscale being revised to a nine-band scale]
-
The interview was conducted according to the guidelines set out in the IELTS training literature, Instructions to IELTS Examiners
-
The digital recording of the session was of sufficient signal quality for the re-rating exercise not to be affected by a high signal to noise ratio
The speaking test recordings provided by IELTS were live tests recorded under the constraints of a face-to-face interview in an acoustically untreated environment. Therefore, the audio recordings captured on digital dictophones had high signal to noise ratios, or background noise was at an unacceptable level. For this reason, the choice of speakers was narrowed to preclude speakers that had been poorly recorded. Only one of the Indian speakers met the criteria listed above and was recorded at a signal to noise level that was acceptable after noise-reduction filtering was conducted using Gold Wave speech signal processing software.
If all background noise is removed, artefacts are created that may affect the quality of the speech and distract the listener. To prevent this, the following procedure was used to reduce the noise level discretely without affecting the speaker’s speech quality:
-
A one-minute period of silence, which occurred before section 2 of the test, was selected and copied. Parts of the segment that had loud high frequency noise artefacts, i.e. slamming doors and car horns were edited out
-
The intensity of the remaining noisy segment was reduced by 9 dB and saved to the clipboard
-
The full speaking test file was then selected and a noise reduction filter was applied based on the spectrum of the file on the clipboard. This subtracted the average noise (reduced in intensity by 9 dB) of this noisy segment, containing no speech, from the entire file. The process removed most of the noise but still left a modest amount of noise in the background.
-
The three selected speakers’ audio files were then converted to 44.1kHz stereo format and renormalised to the same RMS level (0.045 maximum) before being burnt at 2X speed to CD
-
The three candidates’ speaking tests were played over the sound system used for IELTS Listening tests to the examiners in each test centre en-masse. This was the stimulus, or independent variable of L2 speaker type. The examiners listened once to the three candidates’ speaking tests while rating their speaking. This rating was the dependent variable. The examiners listened one more time while filling out questions about each candidate’s performance in the questionnaire. The questionnaire was filled out immediately after the ratings were made because the raters would not be able to reflect on their decisions accurately if time passed between rating and filling out the questionnaire.
A rating response form was used to record the examiner’s ratings of the four OPI subscales of “Fluency and Coherence”, “Lexical Resource”, “Grammatical Range and Accuracy” and “Pronunciation”. A questionnaire was used to elicit the examiners’ demographic details and their level of familiarity with the interlanguages of the three candidates (appendix 1). This information was used to determine the ordinal variable of “familiarity” where 1 = unfamiliar (no prolonged exposure to the interlanguage), 2 = familiar (prolonged exposure to the interlanguage). The dichotomous scale was used because while there are degrees of familiarity (but not unfamiliarity), it would be difficult to accurately determine the degree of exposure on a Likert scale, regardless of whether the raters self-assigned or were judged on the basis of the questionnaire responses.
3.2 Analysis
A crosstab and chi-square analysis was performed on the raters’ speaking test band scores and their responses to the questionnaire. The crosstabs showed that two of the cells in the table (25%), relating to the awarding of 2.0 or 8.0 for pronunciation, had expected counts of less than five, which is below the minimum expected count. Therefore, the four pronunciation score categories of 2.0, 4.0, 6.0, 8.0 were collapsed to two categories of 4.0 and 6.0. Considering the pronunciation score of 2.0 or 8.0 was unlikely for these candidates, we set out to determine if an association existed between a score of 4.0 (or less) or 6.0 (or more) and dependent variables of “familiarity” and “test centre location” described below.
The variables of interest were the following:
-
The “pronunciation scores” awarded by the cohort of raters (N=99), located in India (n=20), Hong Kong (n=20), Australia (n=19), New Zealand (n=21), and Korea (n=19).
-
The L1-influenced accent of each OPI test candidate:
- Chinese accented English
- Korean accented English and
- Indian accented English.
-
The “familiarity” of the rater with the type of accented English; either unfamiliar (no prolonged exposure to the interlanguage), or familiar (prolonged exposure to the interlanguage).
-
The “test centre location” was also investigated to determine if the country where the candidates sit the test affects their score and if this bears any relationship to the rater’s familiarity.
Our research objective was to determine if examiners perceptually accommodate to the interlanguage phonology of candidates on the basis of exposure to the interlanguage. The null hypotheses were the following:
-
There is no difference between the pronunciation profile scores of candidates whose interlanguage phonology is familiar or unfamiliar to the examiner.
-
There is no difference between the pronunciation profile scores of candidates who sit the test in their country of origin or other countries.
4 RESULTS
The 99 IELTS examiners that volunteered to participate in the rating experiment were asked to provide information about the age group they belonged to, their nationality, their first language, how many languages they spoke, their parents’ first language and how many years they had taught English. The majority of raters were aged between 31 and 60 years old (91%). The Indian test centre consisted of all Indian born raters. The other centres had a mixture of predominantly British, Australian and New Zealander raters. A small number of North American raters were working in Hong Kong. The remainder of the raters were born in European countries.
The Korean location consisted of all native-English speaking raters (100%) and the majority of raters were native English speakers in the Hong Kong (95%), Australia (95%) and New Zealand (91%) test centres. The majority of Indian raters (90%) classified themselves as L2 speakers of English. Bilingualism was common for raters in all test centres, with trilingualism featuring in 10% of Indian raters and 5% of raters in New Zealand. The majority of Indian raters’ parents did not speak English (95%) and all of the raters in Korea, whose L1 was also English (100%) all had native English parents. A high proportion of raters in the other three test centres also had native English speaking parents: Hong Kong (90%), Australia (90%) and New Zealand (76%). The raters were experienced teachers with a mean time of 15.8 years spent teaching English. The mean time spent teaching English for the raters at each of the test centres was the following: India = 18.7 years; Hong Kong = 16.2 years; Australia = 16.5 years; New Zealand = 18.1 years; Korea = 9.3 years. The 99 raters of the three speaking candidates (N=297 scores), awarded the following distribution of pronunciation scores in Table 1.
| Pronunciation score | 2.0 | 4.0 | 6.0 | 8.0 |
|---|---|---|---|---|
| Percentage of ratings (N=297 scores) | 3% | 35% | 58% | 4% |
Table 1: Distribution of pronunciation scores
In the actual face-to-face IELTS OPI, the three sample speakers were all rated at the same level for their pronunciation (6.0) and global speaking score (6.0). At the time this study was conducted, IELTS determined the global speaking score by averaging the four OPI subscales of ‘Fluency and Coherence’, ‘Lexical Resource’, ‘Grammatical Range and Accuracy’ and ‘Pronunciation’ and then rounded up or down to a whole number.
To determine if there was a difference between the candidates’ scores for the recorded version of the test, we also examined the 99 examiners’ ratings of the three sample speakers (Table 2). A pair-wise comparison of ordinal data, the Mann-Whitney U, was conducted to determine the level of significance of the difference between the speaker’s results. The finding was that the Korean speaker, with the higher total mean score of 5.56 for pronunciation and 6.09 for the global speaking score, was rated significantly higher (p<0.05) than the Chinese and Indian speakers. There was no significant difference between the Chinese and Indian speakers’ total mean pronunciation and speaking scores.
| Speaker | India pronunciation score mean (SD) | Hong Kong pronunciation score mean (SD) | Australia pronunciation score mean (SD) | New Zealand pronunciation score mean (SD) | Korea pronunciation score mean (SD) | Total pronunciation mean (SD) | Total global speaking mean (SD) |
|---|---|---|---|---|---|---|---|
| Chinese | 5.10 (1.02) | 5.90 (0.79) | 5.16 (1.01) | 4.76 (1.00) | 4.74 (1.19) | 5.13 (1.07) | 5.87 (0.50) |
| Korean | 6.00 (1.59) | 4.70 (1.17) | 5.79 (0.63) | 5.24 (1.00) | 6.11 (0.46) | 5.56 (1.16) | 6.09 (0.71) |
| Indian | 6.10 (0.79) | 4.90 (1.21) | 5.37 (1.34) | 4.38 (1.75) | 4.63 (0.96) | 5.07 (1.37) | 5.66 (0.73) |
Table 2: Mean pronunciation and global speaking score by test centre and speaker
The IELTS examiners’ previous exposure to the three test candidates’ English interlanguage pronunciation was determined by part of the questionnaire (Appendix 1). The number of raters who were identified as being familiar, or unfamiliar with the speakers’ accents are presented in Table 3. As might be expected, high counts of familiarity were identified between the speakers and test centre locations where the speaker’s first language is the major language (i.e. Cantonese in Hong Kong, Korean in Korea and Indian in India). Moreover, high counts of familiarity were identified between the speakers and test centre locations where the speaker’s interlanguage is most commonly experienced based on international student enrolment patterns. Chinese and Korean speaking students are the number one and two largest language groups (respectively) studying in New Zealand (New Zealand Ministry of Education, 2008) and Australia (Linacre, 2005).
| Test centre | Chinese speaker unfamiliar (n) | Chinese speaker familiar (n) | Korean speaker unfamiliar (n) | Korean speaker familiar (n) | Indian speaker unfamiliar (n) | Indian speaker familiar (n) |
|---|---|---|---|---|---|---|
| India | 19 | 1 | 18 | 2 | 0 | 20 |
| Hong Kong | 0 | 20 | 14 | 6 | 17 | 3 |
| Australia | 2 | 17 | 1 | 19 | 13 | 6 |
| New Zealand | 2 | 19 | 7 | 14 | 16 | 5 |
| Korea | 15 | 4 | 1 | 19 | 18 | 1 |
| Total | 38 | 61 | 39 | 60 | 64 | 35 |
Table 3: Rater familiarity with each speaker’s accent by test centre location
4.1 The association of pronunciation score with familiarity
The association of pronunciation score (4.0 and 6.0) with familiarity is presented in Table 4.
Familiarity
| Rating category | Band score | Statistic | Unfamiliar | Familiar |
|---|---|---|---|---|
| Pronunciation | 4.0 | Count | 75 | 39 |
| Pronunciation | 4.0 | Expected Count | 54.1 | 59.9 |
| Pronunciation | 4.0 | % within Pronunciation score | 65.8% | 34.2% |
| Pronunciation | 6.0 | Count | 66 | 117 |
| Pronunciation | 6.0 | Expected Count | 86.9 | 96.1 |
| Pronunciation | 6.0 | % within Pronunciation score | 36.1% | 63.9% |
Table 4: Association of pronunciation score with familiarity
The chi-square test of association between the dependent variables of rater familiarity with pronunciation score yielded a significant result . The strength of the association indicated by Phi was . Therefore, null-hypothesis one, there is no difference between the pronunciation profile scores of candidates whose interlanguage phonology is familiar or unfamiliar to the examiner, can be rejected for the analysis of the three speakers’ combined ratings. Figure 1 depicts the overall association of rater familiarity with accent contributing to a score of 4.0 (or less), or 6.0 (or greater) for the three speakers by 99 raters. The graph shows that a pronunciation score of 6.0 was more likely to be awarded when the examiner was familiar with the speaker’s variety of English accent. A score of 4.0 was more likely to be awarded when the accent was unfamiliar to the examiner.

Fig.1: Association of pronunciation score with familiarity for all three speakers
Next, to investigate both null-hypotheses one and two for each of the speakers’ accents, we examined the association between the following variables:
Null-hypothesis 1: The familiarity of raters with each of the speakers’ accents and the pronunciation score awarded (section 4.2 - 4.4).
Null-hypothesis 2: The location of the test centre with each of the speakers’ accents and the pronunciation score awarded (section 4.3 - 4.7).
To do this we applied a crosstab and 2 level chi-squared test to each of the candidates: Chinese English speaker, Korean English speaker and Indian English speaker.
4.2. Association of pronunciation score with familiarity for the Chinese speaker’s accent
The association between the variables of pronunciation score awarded and rater familiarity with the Chinese speaker’s accent are presented in Table 5.
Familiarity
| Rating category | Band score | Statistic | unfamiliar | familiar |
|---|---|---|---|---|
| Pronunciation | 4.0 | Count | 22 | 21 |
| Pronunciation | 4.0 | Expected Count | 16.5 | 26.5 |
| Pronunciation | 4.0 | % within familiarity | 57.9% | 34.4% |
| Pronunciation | 6.0 | Count | 16 | 40 |
| Pronunciation | 6.0 | Expected Count | 21.5 | 34.5 |
| Pronunciation | 6.0 | % within familiarity | 42.1% | 65.6% |
Table 5: Association of pronunciation score and familiarity with the Chinese speaker’s accent
The chi-square test of association between the dependent variables of rater familiarity with pronunciation score for the Chinese speaker yielded a significant result . The strength of the association indicated by Phi was . Therefore, the null-hypothesis could be rejected for the analysis of the Chinese candidate’s scores.
Figure 2 depicts the association of rater familiarity with the Chinese speaker’s accent contributing to a score of 4.0 (or less), or 6.0 (or greater). The graph shows that a pronunciation score of 6.0 was more likely to be awarded when the examiner was familiar with the Chinese speaker’s English accent. A score of 4.0 was more likely to be awarded when the accent was unfamiliar to the examiner.
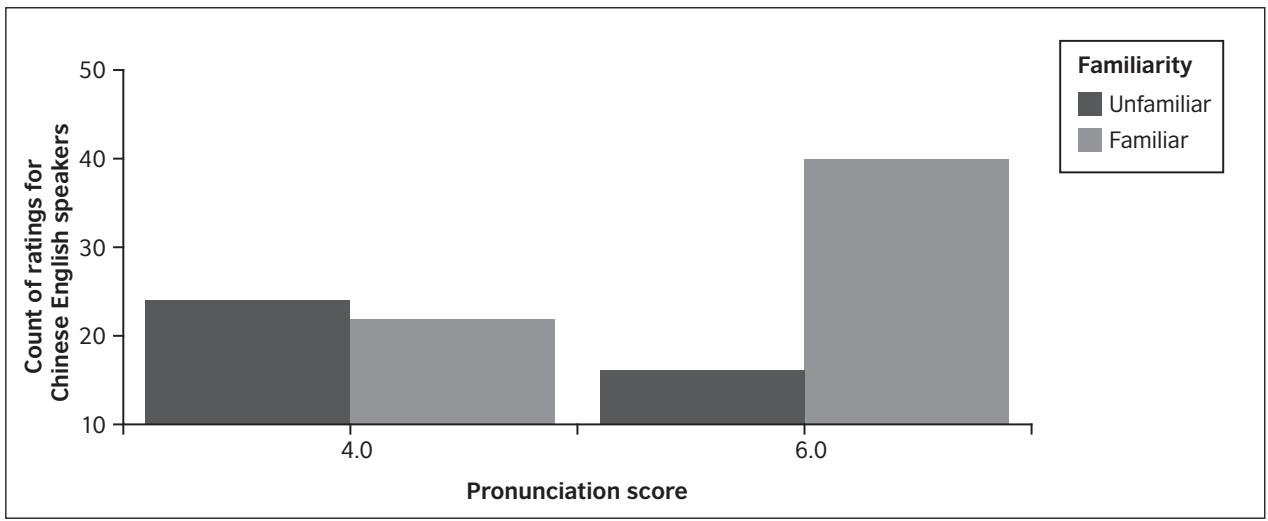
Fig.2: Association of pronunciation score and familiarity with the Chinese speaker’s accent
4.3. Association of pronunciation score with familiarity for the Korean speaker’s accent
The association between the variables of rater familiarity with the Korean speaker’s accent and the pronunciation score awarded is presented in Table 6.
Familiarity
| Rating category | Band score | Statistic | unfamiliar | familiar |
|---|---|---|---|---|
| Pronunciation | 4.0 | Count | 16 | 10 |
| Pronunciation | 4.0 | Expected Count | 10.2 | 15.8 |
| Pronunciation | 4.0 | % within familiarity | 41.0% | 16.7% |
| Pronunciation | 6.0 | Count | 23 | 50 |
| Pronunciation | 6.0 | Expected Count | 28.8 | 44.2 |
| Pronunciation | 6.0 | % within familiarity | 59.0% | 83.3% |
| Pronunciation | 6.0 | % within familiarity | 42.1% | 65.6% |
Table 6: Association of pronunciation score and familiarity with the Korean speaker’s accent
The chi-square test of association between the dependent variables of rater familiarity with pronunciation score for the Korean speaker yielded a significant result . The strength of the association indicated by Phi was . Therefore, the null-hypothesis could be rejected for the analysis of the Korean candidate’s scores.
Figure 3 depicts the association of rater familiarity with the Korean speaker’s accent contributing to a score of 4.0 (or less), or 6.0 (or greater). The graph shows that a pronunciation score of 6.0 was more likely to be awarded when the examiner was familiar with the Korean speaker’s English accent. A score of 4.0 was more likely to be awarded when the accent was unfamiliar to the examiner.

Fig.3: Association of pronunciation score and familiarity with the Korean speaker’s accent
4.4. Association of pronunciation score with familiarity for the Indian speaker’s accent
The association between the variables of rater familiarity with the Indian speaker’s accent and the pronunciation score awarded is presented in Table 7.
Familiarity
| Rating category | Band score | Statistic | unfamiliar | familiar |
|---|---|---|---|---|
| Pronunciation | 4.0 | Count | 37 | 8 |
| Pronunciation | 4.0 | Expected Count | 29.1 | 15.9 |
| Pronunciation | 4.0 | % within familiarity | 57.8% | 22.9% |
| Pronunciation | 6.0 | Count | 27 | 27 |
| Pronunciation | 6.0 | Expected Count | 34.9 | 19.1 |
| Pronunciation | 6.0 | % within familiarity | 42.2% | 77.1% |
Table 7: Association of pronunciation score and familiarity with the Indian speaker’s accent
The chi-square test of association between the dependent variables of rater familiarity with pronunciation score for the Indian speaker yielded a significant result . The strength of the association indicated by Phi was . Therefore, the null-hypothesis could be rejected for the analysis of the Indian candidate’s scores.
Figure 4 depicts the association of rater familiarity with the Indian speaker’s accent contributing to a score of 4.0 (or less), or 6.0 (or greater). A pronunciation score of 4.0 was more likely to be awarded when the accent was unfamiliar to the examiner.
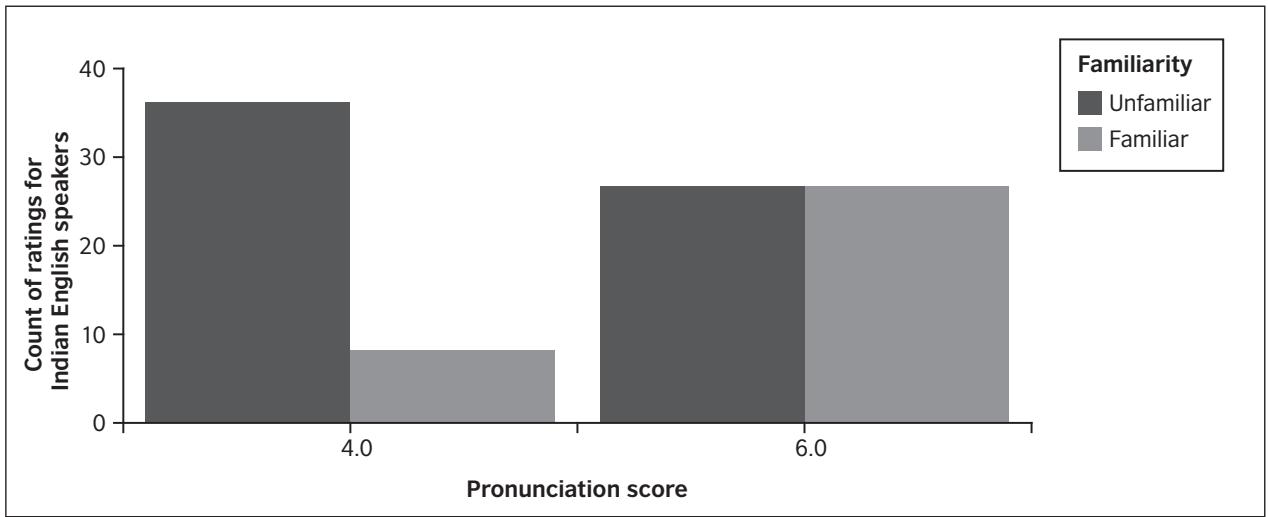
Fig.4: Association of pronunciation score and familiarity with the Indian speaker’s accent
4.5. Location of the test centre and the pronunciation score awarded for the Chinese speaker
The association between the variables of test centre location and the pronunciation score awarded for the Chinese speaker is presented in Table 8.
Test centre
| Rating category | Band score | Statistic | India | Hong Kong | Australia | New Zealand | Korea |
|---|---|---|---|---|---|---|---|
| Pronunciation | 4.0 | Count | 9 | 2 | 8 | 13 | 11 |
| Pronunciation | 4.0 | Expected Count | 8.7 | 8.7 | 8.3 | 9.1 | 8.3 |
| Pronunciation | 4.0 | % within test centre | 45.0% | 10.0% | 42.1% | 61.9% | 57.9% |
| Pronunciation | 6.0 | Count | 11 | 18 | 11 | 8 | 8 |
| Pronunciation | 6.0 | Expected Count | 11.3 | 11.3 | 10.7 | 11.9 | 10.7 |
| Pronunciation | 6.0 | % within test centre | 55.0% | 90.0% | 57.9% | 38.1% | 42.1% |
| Total | Count | 20 | 20 | 19 | 21 | 19 |
Table 8: Association of pronunciation score with test centre for the Chinese speaker
The chi-square test of association between the dependent variables of test centre location with pronunciation score for the Chinese speaker yielded a significant result . The strength of the association indicated by Cramer’s V = .372. Therefore, null-hypothesis two, there is no difference between the pronunciation profile scores of candidates who sit the test in their country of origin or other countries, could be rejected for the analysis of the Chinese candidate’s scores.
Figure 5 depicts the association of test centre location with the Chinese speaker’s accent contributing to a score of 4.0 (or less), or 6.0 (or greater). A higher incidence of a pronunciation score of 6.0 (or greater) was awarded to the Chinese candidate at the Hong Kong test centre (90%) than at the other four centres in the sample.

Fig.5: Association of pronunciation score with test centre for the Chinese English speaker
A pair-wise Mann-Whitney U test (Table 9) revealed that there was a significant difference between the Chinese English speaker’s rating at the Hong Kong test centre and the other test centres.
| Test centre comparison | Z | Asymp. Sig. |
|---|---|---|
| Hong Kong - India | -2.448 | .014 |
| Hong Kong - Australia | -2.265 | .023 |
| Hong Kong - New Zealand | -3.407 | .001 |
| Hong Kong - Korea | -3.130 | .002 |
Table 9: Mann-Whitney U statistic comparison of difference between Hong Kong and other test centres
4.6. Location of the test centre and the pronunciation score awarded for the Korean speaker
The association between the variables of test centre location and the pronunciation score awarded for the Korean speaker is presented in Table 10.
Test centre
| Rating category | Band score | Statistic | India | Hong Kong | Australia | New Zealand | Korea |
|---|---|---|---|---|---|---|---|
| Pronunciation | 4.0 | Count | 4 | 12 | 2 | 8 | 0 |
| Pronunciation | 4.0 | Expected Count | 5.3 | 5.3 | 5.0 | 5.5 | 5.0 |
| Pronunciation | 4.0 | % within test centre | 20.0% | 60.0% | 10.5% | 38.1% | 0% |
| Pronunciation | 6.0 | Count | 16 | 8 | 17 | 13 | 19 |
| Pronunciation | 6.0 | Expected Count | 14.7 | 14.7 | 14.0 | 15.5 | 14.0 |
| Pronunciation | 6.0 | % within test centre | 80.0% | 40.0% | 89.5% | 61.9% | 100.0% |
| Total | Count | 20 | 20 | 19 | 21 | 19 |
Table 10: Association of pronunciation score with test centre for the Korean speaker
The chi-square test of association between the dependent variables of test centre location with pronunciation score for the Korean speaker yielded a significant result . The strength of the association indicated by Cramer’s V = .481. Therefore, null-hypothesis two, there is no difference between the pronunciation profile scores of candidates who sit the test in their country of origin or other countries, could be rejected for the analysis of the Korean candidate’s scores.
Figure 6 depicts the association of test centre location with the Korean speaker’s accent contributing to a score of 4.0 (or less), or 6.0 (or greater). A higher incidence of a pronunciation score of 6.0 (or greater) was awarded to the Korean candidate at the Korean test centre (100%) than at the other four centres in the sample.
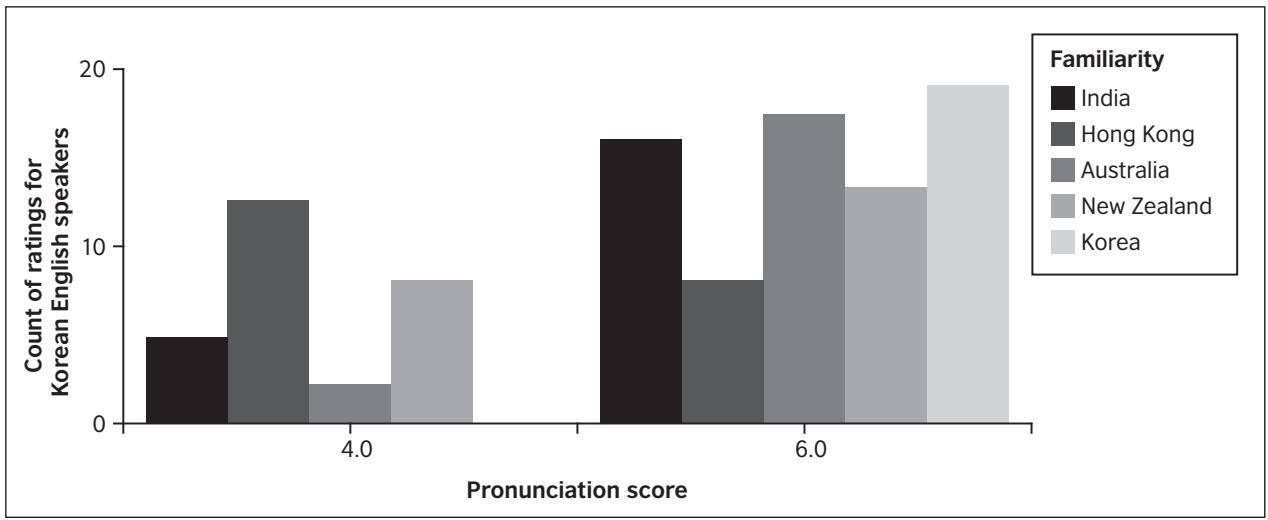
Fig.6: Association of pronunciation score with test centre for the Korean English speaker.
There was a high incidence of 6.0 (or greater) scores for the Australian raters, who are familiar with Korean accented English, but also for the unfamiliar Indian raters. However, a pair-wise Mann-Whitney U test (table 11) revealed that there was a significant difference between the Korean English speaker’s rating at the Korean test centre and the Indian test centre, and all other test centres except the Australian test centre.
| Test centre comparison | Z | Asymp. Sig. |
|---|---|---|
| Korea - India | -2.031 | .042 |
| Korea - Hong Kong | -4.006 | .000 |
| Korea-Australia | -1.434 | .152 |
| Korea-New Zealand | -2.970 | .003 |
Table 11: Mann-Whitney U statistic comparison of difference between Korean and other test centres
4.7. Location of the test centre and the pronunciation score awarded for the Indian speaker
The association between the variables of test centre location and pronunciation score awarded for the Indian speaker’s accent is presented in Table 12.
Test centre
| Rating category | Band score | Statistic | India | Hong Kong | Australia | New Zealand | Korea |
|---|---|---|---|---|---|---|---|
| Pronunciation | 4.0 | Count | 1 | 10 | 8 | 13 | 13 |
| Pronunciation | 4.0 | Expected Count | 9.1 | 9.1 | 8.6 | 9.5 | 8.6 |
| Pronunciation | 4.0 | % within test centre | 5.0% | 50.0% | 42.1% | 61.9% | 68.4% |
| Pronunciation | 6.0 | Count | 19 | 10 | 11 | 8 | 6 |
| Pronunciation | 6.0 | Expected Count | 10.9 | 10.9 | 10.4 | 11.5 | 10.4 |
| Pronunciation | 6.0 | % within test centre | 95.0% | 50.0% | 57.9% | 38.1% | 31.6% |
| Total | Count | 20 | 20 | 19 | 21 | 19 |
Table 12: Association of pronunciation score with test centre for the Indian speaker
The chi-square test of association between the dependent variables of test centre location with pronunciation score for the Indian speaker yielded a significant result . The strength of the association indicated by Cramer’s V = .447. Therefore, null-hypothesis two, there is no difference between the pronunciation profile scores of candidates who sit the test in their country of origin or other countries, could be rejected for the analysis of the Indian candidate’s scores.
Figure 7 depicts the association of test centre location with the Indian speaker’s accent contributing to a score of 4.0 (or less), or 6.0 (or greater). The graph shows that there was a higher incidence of a pronunciation score of 6.0 (or greater) being awarded to the Indian candidate at the Indian test centre (95%) than at the other four centres in the sample.

Fig.7: Association of pronunciation score with test centre for the Indian English speaker.
A pair-wise Mann-Whitney U test (Table 13) revealed that there was a significant difference between the Indian English speaker candidate’s rating at the Indian test centre and the other test centres.
| Test centre comparison | Z | Asymp. Sig. |
|---|---|---|
| India - Hong Kong | -3.147 | .002 |
| India - Australia | -2.714 | .007 |
| India - New Zealand | -3.794 | .000 |
| India - Korea | -4.074 | .000 |
Table 13: Mann-Whitney U statistic comparison of difference between Indian and other test centres
5 DISCUSSION
In this study we set out to answer the question: Do examiners converge perceptually with interlanguage phonology that is familiar to the examiners, and do they perceptually diverge from that which is unfamiliar? The aim of the study was to determine if examiners perceptually accommodate to the interlanguage phonology of candidates based on exposure to the interlanguage.
A limitation of the study’s methodology is the procedural differences between the experimental rating of the subjects and ratings conducted under “authentic” live one-to-one conditions, where visual cues may contribute to the clarity of the message. Therefore, conclusions cannot be reasonably drawn concerning the validity of the IELTS OPI because the IELTS OPI is not authentically replicated. However, the 99 raters in the experiment were all exposed to the same experimental stimulus under similar conditions. So, all else being equal, it is reasonable to assume that the procedure was suited to the task at hand: to conduct a contrastive analysis of the perceptual discrimination of groups of raters in various geographical locations with varying degrees of exposure to the three sample interlanguages.
The OPIs of the three test candidates from different L1 groups were selected from a pool of 60 candidates’ recorded interviews that were supplied by IELTS Australia. These three sample speakers were rated by 99 OPI examiners from five test centres located in different countries. The pronunciation scores were analysed to determine the level of association with rater familiarity. There was a significant (p<0.01) association between the variables of familiarity and pronunciation score which revealed that a pronunciation score of 6.0 was more likely to be awarded when the examiner was familiar with the speaker’s variety of English accent. A score of 4.0 was more likely to be awarded when the accent was unfamiliar to the examiner. Thus it can be concluded that examiners do perceptually accommodate to the interlanguage phonology of candidates based on exposure to the interlanguage.
We then investigated the variables of familiarity and pronunciation score to determine the level of association between rater familiarity and the pronunciation scores for each of the individual speakers’ accents. This analysis yielded a similar result with a significant association between the variables. A pronunciation score of 6.0 was more likely to be awarded when the examiner was familiar with the individual speaker’s variety of English accent. A score of 4.0 was more likely to be awarded when the individual speaker’s accent was unfamiliar to the examiner.
We were then interested to determine if the same association existed between the location of the test centre and the pronunciation score awarded for each of the three candidates. The results of the analysis showed a significant association existed between these variables. There was a significantly higher incidence of a pronunciation score of 6.0 (or greater) awarded to the Chinese candidate at the Hong Kong test centres (90% of Hong Kong centre ratings) than at the other four centres in the sample. There was also a significantly higher incidence of a pronunciation score of 6.0 (or greater) awarded to the Indian candidate at the Indian test centre (100% of Indian centre ratings). A higher incidence of a pronunciation score of 6.0 (or greater) was awarded to the Korean candidate at the Korean test centres (100% of Korean centre ratings). Notably, the Korean subject also received a higher incidence of a pronunciation score of 6.0 (or greater) from the Indian test centre and Australian test centre raters. However, the count of Indian and Korean test centre ratings were significantly different . Yet, the count of Australian test centre ratings was not significantly different to the count of ratings at the Korean centre. This result can be explained by two factors: the Korean speaker received a higher mean rating than the other speakers across all test centres (Table 2), and was identified as a familiar accent by 19 out of the 20 raters at the Australian test centre (Table 3).
In this study we conducted an inter-rater variability analysis on the English pronunciation ratings of three representative test candidate interlanguages: Chinese, Korean and Indian English. Pronunciation was rated by 99 examiners across five geographically dispersed test centres where examiners variously reported either prolonged exposure, or no prolonged exposure to the interlanguage of the candidates. Future studies could extend the types of interlanguages and the locations of test centres to challenge the results found in this study.
In conclusion, our finding was that examiners with varying exposure to Chinese, Korean and Indian English accents, rated the three speaking test candidates with a significant level of inter-rater variation. Pronunciation was rated significantly higher when the candidate’s interlanguage phonology was familiar and lower when it was unfamiliar. Moreover, a strong association between familiarity and the pronunciation rating was found. We attribute this to psychoacoustic processes, namely, the perceptual magnet effect, and the resulting sociolinguistic phenomenon at the level of communicative interaction. This phenomenon we have termed interlanguage phonology accommodation. The results also showed that the examiners’ pronunciation ratings are strongly associated with the location of the test centre. Candidates are more likely to be awarded a higher score for pronunciation if they take a test in their home country (e.g. Indians in India, Koreans in Korea), or at a centre where the examiners are highly exposed to their interlanguage (e.g. Cantonese speakers in Hong Kong, Koreans in Australia). It cannot be concluded simply that test centres are sympathetic to candidates from their own countries and overseas test centres rate foreign students more harshly because the “familiarity” variable spans various test centres and rater nationalities. The strong association between interlanguage familiarity and pronunciation scores suggests that perceptual accommodation contributes significantly to inter-rater variability in pronunciation scoring. Raters in centres located in countries where English is not the L1 converged perceptually with the L2 accents that are most familiar, that is, L2 accents from the communities surrounding the test centres.
ACKNOWLEDGEMENTS
This research was supported by an IELTS research grant (round 9) funded in 2004 by IELTS Australia. We thank IELTS Australia for granting permission to publish the manuscript and two reviewers, Dr Lynda Taylor and Dr Sacha DeVelle at Cambridge ESOL for their salient comments on previous versions of this paper. We would also like to acknowledge Associate Professor Geoff Brindley for his early suggestions regarding the design of the project.
References
- Anderson-Hsieh, J, & Koehler, K, 1988, ‘The effect of foreign accent and speaking rate on native speaker comprehension’, Language Learning, vol 38, pp 561-613
- Best, C, 1995, ‘A direct realist view of cross-language’, in Speech Perception and Linguistic Experience: Theoretical and Methodological Issues in Cross-language Speech Research ed W Strange, York Press, Timonium, MD
- Bilbow, G, 1989, ‘Towards an understanding of overseas students’ difficulties in lectures: A phenomenographic approach’, Journal of Further and Higher Education, vol 13, pp 85-89
- Bohn, O-S, 1995, ‘Cross-language speech perception in adults: First language transfer doesn’t tell it all’, in Speech Perception and Linguistic Experience: Theoretical and Methodological Issues in Cross-language Speech Research ed W Strange, York Press, Timonium, MD
- Brennan, E, & Brennan, J, 1981, ‘Measurements of accent and attitude toward Mexican-American speech’, Journal of Psycholinguistic Research, vol 10, pp 487-501
- Brown, K, 1968, ‘Intelligibility’, in Language testing symposium ed A Davies, pp 180-191, Oxford University Press, Oxford, pp 180-191
- Cargile, A, 1997, ‘Attitudes toward Chinese-accented speech: An investigation in two contexts’, Journal of Language and Social Psychology, vol 16, pp 434-443
- Eisentein, M, & Berkowitz, D, 1981, ‘The effect of phonological variation on adult learner comprehension’, Studies in Second Language Acquisition, vol 4, pp 75-80
- Ekong, P, 1982, ‘On the use of an indigenous model for teaching English in Nigeria’, World Language English, vol 1, pp 87-92
- Flege, J, 1987, ‘The production of “new” versus “similar” phones in a foreign language: evidence for the effect of equivalence classification’, Journal of Phonetics vol 15, pp 47-65
- Flowerdew, J, 1994, ‘Research of relevance to second language lecture comprehension-an overview’, In Academic listening ed J Flowerdew, Cambridge University Press, New York, pp 7-29
- Grieser, D, and Kuhl, P, 1989, ‘Categorization of speech by infants: Support for speech-sound prototypes’, Developmental Psychology vol 25, pp 577-588
- Guenther, F, & Bohland, J, 2002, ‘Learning sound categories: A neural model and supporting experiments’, Acoustical Science and Technology, vol 23 no 4, pp 213-221
- Guenther, F, Nieto-Castanon, A, Ghosh, S, & Tourville, J, 2004 ‘Representation of sound categories in auditory cortical maps’, Journal of Speech, Language, and Hearing Research, vol 47, no 1, pp 46-57
- Kuhl, P, 1991, ‘Human adults and human infants show a “perceptual magnet effect” for the prototypes of speech categories, monkeys do not’, Perception & Psychophysics, vol 50, pp 93-107
- Kuhl, P, & Iverson, P, 1995, ‘Age-related changes in cross-language speech perception: Standing at the crossroads’, in Speech Perception and Linguistic Experience: Theoretical and Methodological Issues in Cross-language Speech Research, ed W Strange, York Press, Timonium, MD
- Linacre, S, 2007 ‘Australian social trends 2007: International students in Australia’, Australian Bureau of Statistics, Catalogue no 4102.0, retrieved Aug 30, 2008, from http://www.ausstats.abs.gov.au
- Lindemann, S, 2005, ‘Who speaks “broken English”? US undergraduates’ perceptions of non-native English’, International Journal of Applied Linguistics, vol 15, no 2, pp 187-212
- Mackey, L, & Finn, P, 1997, ‘Effect of speech accent on speech naturalness ratings: A systematic replication of Martin, Haroldson, and Triden (1984)’, Journal of Speech, Language & Hearing Research, vol 40, pp 349-361
- Major, R, Fitzmaurice, S & Bunta, F, Balasubramania, C, 2002, ‘The effects of nonnative accents on listening comprehension: Implications for ESL assessment’, TESOL Quarterly, vol 36, pp 173-190
- Miller, J, 1994, ‘On the internal structure of phonetic categories: A progress report’, Cognition, vol 50, pp 271-285
- Nittrouer, S., Manning, C and Meyer, G, 1993, ‘The perceptual weighting of acoustic cues changes with linguistic experience’, Journal of the Acoustical Society of America, vol 94, p 1865
- Nesdale, D, & Rooney, R, 1996, ‘Evaluations and stereotyping of accented speakers by pre-adolescent children’, Journal of Language & Social Psychology, vol 15, pp 133-155
- New Zealand Ministry of Education, 2008, ‘International student enrolments in New Zealand 2001-2008’, retrieved Sep 20, 2008, from www.educationcounts.govt.nz/_data/assets/pdf_file/0015/24711/International_Student_Enrolments_in_New_Zealand_2001_-_2007.pdf
- Richards, J C, 1983, ‘Listening comprehension: Approach, design, procedure’, TESOL Quarterly, vol 17, pp 219-239
- Rochet, B L, 1995 ‘Perception and production of second-language speech sounds by adults’, in Speech Perception and Linguistic Experience: Theoretical and Methodological Issues in Cross-language Speech Research ed W Strange, York Press, Timonium, MD, pp 379-410
- Rubin, D, & Smith, K A, 1990, Effects of accent, ethnicity, and lecture topic on undergraduates’ perceptions of nonnative English-speaking teaching assistants’, International Journal of Intercultural Relations, vol 14, pp 337-353
- Wilcox, G K, 1978, ‘The effect of accent on listening comprehension: A Singapore study’, English Language Teaching Journal, vol 32, pp 118-127
- Zhang, Y, Kuhl, P K, Imada, T, Kotani, M, & Tohkurad, Y, 2005, ‘Effects of language experience: Neural commitment to language-specific auditory patterns’, NeuroImage, vol 26, pp 703-720
APPENDIX 1: EXAMINER BACKGROUND QUESTIONNAIRE
-
What is your age group?
- 20-30
- 31-40
- 41-50
- 51-60
- 60+
-
What is your nationality?
-
What is your mother’s first language?
-
What is your father’s first language?
-
What is your first language?
-
Which languages do you speak?
-
Which language do you currently use most?
-
How long have you taught English?
-
In which countries have you taught English and for how long? e.g., Korea 18 months
-
In which countries have you lived (but not taught English) and for how long? e.g., Korea 18 months
-
Have you been exposed to any other particular groups of L2 speakers of English whose accents you have become used to hearing and understanding? e.g., Korean
Author biodata
Michael D Carey
Dr Carey’s main research interests are in speech science, particularly speech acoustics, perception, interlanguage phonology and pronunciation pedagogy. His additional interests are in language testing and IELTS preparation, particularly assessment of speaking and writing. He has published two IELTS preparation course books, “IELTS in Context Book 1 and 2” and was formerly an IELTS preparation teacher and examiner. He has taught in the field of English language teaching since 1992. He currently works at the University of the Sunshine Coast in Queensland as an Academic Language Adviser and as a Research Associate for Macquarie University and the University of Queensland.
Robert H Mannell
Dr Mannell currently carries out research in the areas of phonetics and phonology, auditory processing of speech, speech perception, speech synthesis, speech acoustics and the evaluation of speech technology. He has been the recipient of numerous research grants and industrial contracts, is currently involved in the Hearing Cooperative Research Centre and currently has several PhD students working in the areas auditory processing of speech and acoustic phonetics. He is heavily involved in the Linguistics Department’s teaching program at Macquarie University and convenes the Bachelor of Speech and Hearing Sciences and several subjects in the fields of phonetics and phonology, speech acoustics, speech physiology, speech technology, auditory physiology and psychoacoustics.