
The cognitive processes of taking IELTS Academic Writing Task 1: An eye-tracking study
Official IELTS research report on IELTS Test - Writing, published in 2017.
Abstract
Yu, Rea-Dickins and Kiely (2011) used concurrent thinking-aloud as the main research instrument to examine test-takers’ cognitive processes of completing IELTS Academic Writing Task 1 (AWT1). In the current follow-up study, we employed an eye-tracking system (Tobii X2-60) with retrospective stimulated individual interviews and focus-group discussions as the major data collection tools to examine:
- the overall pattern of test-takers’ cognitive processes
- the extent to which cognitive processes differ due to the use of different AWT1 graph prompts
- the extent to which cognitive processes are related to their graph familiarity
- English writing abilities.
Twenty-seven prospective IELTS test-takers from a large Chinese university volunteered to complete three AWT1 tasks of different types of graphs which were randomly assigned to them out of four tasks. The participants’ eye movements when taking the AWT1 tasks were recorded. Immediately after the participants had completed the three AWT1 tasks, we conducted retrospective stimulated recall interviews with each individual participant, with episodes of the recorded eye movement videos replayed as stimuli for discussions. The interviews were simultaneously video recorded via Tobii Studio 3.2.1 (Enterprise version). After completing all the retrospective stimulated interviews, we conducted six student-led focus-group discussions which were audio recorded. In total, the final dataset includes 27 hours of eye movement videos, 11 hours of retrospective stimulated recall interviews, 6 hours of focus-group discussions, and 81 writings produced at eye-tracking experiments. In addition, prior to the eye-tracking experiments, we collected the baseline data on all participants’ graphicacy, computer familiarity, and English writing abilities under normal examination condition.
The quantitative eye-movement data showed that less than 10% of time was spent on reading task instructions, 20% on reading graphs and 70% focusing on writing. This is clear evidence that IELTS AWT1 is fundamentally a writing task. The qualitative analysis of the visualisations of eye-movement data demonstrated the dynamics and uniqueness of each participant’s eye-movements. Graph features were found to have exerted significant impacts on the aggregated metrics of eye-movement (total fixation duration and total visit duration), but such impacts were not noticeable in the two metrics of single fixations (first fixation duration, and fixation duration). Bar graph, line graph and pie chart were considered much easier than statistical tables due to the nature of the graphs, as well as the amount of information contained in the different types of graphs.
The cognitive naturalness and perceptual properties of graphs influenced the participants’ engagement with, preference towards and judgement about the difficulty level of different types of graphs. Graph familiarity was found to have weak and short-lived impacts on the participants’ test-taking cognitive processes. Similarly, the correlations between English writing ability and the eye-movement metrics were also weak and fuzzy. In the participants view, it was the rigid overall structure of IELTS AWT1 writing and the predictable nature of graphs and the associated cognitive conventions of graph comprehension and presentation that can make AWT1 tasks highly coachable and mouldable and consequently a weaker relationship between English writing ability and test-taking process and performance.
The findings to the four research questions present some glimpses into the complex nature of the IELTS AWT1 tasks, and the dynamic interplays between test-taker characteristics (e.g., graph familiarity, English writing ability) and task features (e.g., different types of graphs, amount of information contained in a graph, and the relationships between task instructions, graphs and the textbox as the three major components of a task). A number of suggestions are made to conduct further quantitative and qualitative analysis of the eye-movement data to explore the dynamics and the idiosyncratic nature of each participant’s eye-movements.
Authors’ biodata
Guoxing Yu
Guoxing Yu is a Reader in Language Education and Assessment, and Coordinator of Doctor of Education in the Applied Linguistics program at the University of Bristol. He earned his PhD in 2005 from Bristol; his dissertation was awarded the Jacqueline A. Ross TOEFL Dissertation Award by Educational Testing Service, USA (2008). His main research efforts straddle: language assessment, the role of language in assessment, assessment of school effectiveness and learning power. He has directed or co-directed several funded research projects and published in academic journals, including Applied Linguistics, Assessing Writing, Assessment in Education, Educational Research, Language Assessment Quarterly and Language Testing. He was guest editor for Language Assessment Quarterly of a special issue on Integrated Writing Assessment (2013). For Assessment in Education, he was guest editor with Professor Jin Yan (Shanghai Jiao Tong University) of a special issue on English Language Assessment in China: Policies, Practices and Impacts (2014). His jointly edited volume with Prof Jin Yan - Assessing Chinese Learners of English: Language Constructs, Consequences and Conundrums - was published by Palgrave Macmillan in October 2015. Guoxing is an executive editor of Assessment in Education, and serves on editorial boards of Language Testing, Language Assessment Quarterly, Assessing Writing, and Language Testing in Asia. He is Deputy Director of the Centre for Assessment and Evaluation Research at Bristol, and Co-Director of the Zhejiang-Bristol Joint Research Institute of Language Assessment.
Lianzhen He
Lianzhen He is a Professor of Applied Linguistics at Zhejiang University. Her main research interests are language testing, corpus linguistics and discourse analysis. She earned her Master’s degree from the University of Birmingham (1992) and her PhD degree in language testing from Guangdong Foreign Studies University, China (1998). She was a senior visiting scholar at the University of California, Los Angeles in 2004, Benjamin Meaker Visiting Professor at the University of Bristol in 2012, and Local Chair of the 2008 Language Testing Research Colloquium (LTRC) held at Zhejiang University. She has been a keynote speaker at several international conferences. Lianzhen is the Dean of the School of International Studies, the Director of the Research Institute of Applied Linguistics, the Co-Director of the Zhejiang- Bristol Joint Research Institute of Language Assessment, and the Deputy Director of the National Advisory Board for College Foreign Language Teaching of the Ministry of Education since 2006. Her publications include articles on language assessment research appearing in Language Testing, Language Assessment Quarterly, and major journals in China.
Talia Isaacs
Talia Isaacs is a Senior Lecturer in Applied Linguistics and TESOL at the UCL Centre for Applied Linguistics, UCL Institute of Education, University College London. With work at the interface between second language acquisition and assessment, much of Talia’s research has focused on operationalising key oral communication constructs in rating scales that capture the linguistic properties of L2 productions, often grounded in academic or specific purposes contexts. Talia is an expert member of the European Association for Language Testing and Assessment, a founding member of the Canadian Association of Language Assessment, and is currently on the editorial boards of Language Assessment Quarterly, Language Testing, and The Journal of Second Language Pronunciation. She has served as Principal Investigator on research projects funded by the British Council, the European Commission, and the Social Sciences and Research Council of Canada, Talia regularly externally evaluates grant applications and other scholarly outputs. Her work has been published in various refereed journals, including Applied Psycholinguistics, Health Communication, Language Assessment Quarterly, Studies in Second Language Acquisition and TESOL Quarterly.
1 Introduction
This research addresses the first area of interest identified by the IELTS Joint Research Committee - “test development and validation issues” in relation to “the cognitive processes of IELTS test-takers”. In our previous study funded by the IELTS Partners (Yu, Rea-Dickins & Kiely, 2011), concurrent thinking-aloud was used as the main instrument to collect test-takers’ cognitive processes when completing IELTS AWT1 tasks of different graph prompts at two time points (before and after test preparation training). Although we did not find the use of think-aloud too intrusive, it was almost inevitable that this data collection method was quite demanding as it added some extra processing load for some participants (see also Bowles, 2010). We considered this as a major limitation of the study - “although sufficient training for think-aloud was provided to the participants…the effects of think-aloud on test performance may never be removed completely” (Yu et al. 2011, p.409). At the annual conference of British Association for Applied Linguistics in September 2011, we received several constructive suggestions from the audience, including one from Professor Cyril Weir recommending using eye-tracking systems instead of concurrent thinking-aloud, to investigate test-takers’ cognitive processes.
The continuous development in eye-tracking research (Liversedge, Gilchrist & Everling, 2011; Rayner, 1978, 1998) provides language testing professionals with opportunities to look into the cognitive processes of test taking (see for example Bax, 2013; Bax & Weir, 2012; Brunfaut & McCray, 2015; Cubilo & Winke, 2013; Suvorov, 2015; Winke, 2013). However, eye-tracking can still be quite distracting if the system itself constrains too much head movement and, therefore, distorts the normal examination condition. Furthermore, not all eye movements can mirror exactly the thinking processes as Anderson, Bothell and Douglass (2004) rightly pointed out the limits of the eye-mind hypothesis.
As a follow-up study of Yu et al. (2011), this current study has the same research aims, but using different main data collection tools, to investigate:
- the patterns of cognitive processes involved in the AWT1 tasks
- the extent to which test-takers’ cognitive processes differ due to the use of different AWT1 graph prompts
- the extent to which test-takers’ cognitive processes are related to their “graphicacy” (Weiner, 1992, p.16)
- English writing abilities.
In order to better capture and understand test-takers’ cognitive processes, we used a screen-based, highly portable eye-tracking system Tobii X2-60 (www.tobii.com), supplemented by retrospective stimulated recall interviews where the recorded eye movement videos were replayed as stimuli to further explore the relationships between test-takers’ cognitive processes and eye movements from the test-takers perspectives. After the retrospective stimulated interviews, we conducted six focus-group discussions with all participants. In total, the final dataset includes 27 hours of eye movement videos, 11 hours of retrospective stimulated interviews, 6 hours of focus-group discussions, and 81 writings produced at eye-tracking experiments. Prior to the eye-tracking experiments, baseline data on all participants’ graphicacy, computer familiarity, and English writing abilities (IELTS Academic Writing Tasks 1 and 2) under normal examination conditions were also collected.
The findings of the study have the potential to contribute to the ongoing validation and development of AWT1 tasks from the perspectives of test-takers’ cognitive processes. Language testing researchers, prospective IELTS test-takers, English language professionals and teachers are also likely to benefit from the findings of the study to develop a greater understanding of the AWT1 tasks, as well as other tasks which use similar graphs as prompts in listening, speaking (e.g., Pearson Test of English Academic) and writing assessments (e.g., General English Proficiency Test, Taiwan).
The findings will also contribute to the development of theories and practices in second language academic writing, in relation to the roles that non-language knowledge and skills (i.e., graphicacy in this case, defined as “proficiency in understanding quantitative phenomena that are presented in a graphical way” (Wainer 1992, p.16)) can play in academic writing performance. As the reviewer of the final report of our previous study (Yu et al. 2011) pointed out, our working model of cognitive processes “could well become a standard point of reference for future research in this field, since many of the aspects of the processes will be applicable to other types of writing tasks”.
In the present study, we will use the working model (see Appendix 1, reproduced in this report) to guide our data analysis. Methodologically, by examining test-takers’ eye-movements and the eye-mind relationships, this study presents a new perspective in understanding the complex nature of the test-taking process, for the purpose of test validation. Furthermore, this screen-based eye-tracking research also provides important findings for future computer-based IELTS tests.
2 Literature review
According to the IELTS Handbook (2006, p.8), the AWT1 tasks require test-takers to “describe some information (graph/chart/table/diagram), and to present the description in their own words”. It is recommended that test-takers should spend 20 minutes on this and write at least 150 words. Test-takers are assessed on their ability to organise, present and possibly compare data, describe the stages of a process or procedure, describe an object or event or sequence of events, or explain how something works. In AWT1 tasks, test-takers need not only to comprehend the graph input, but also to re-present in written English the information accessible to them (see Appendix 1). We use “graph” as the umbrella term in this research to represent all the three other terms, i.e., chart/table/diagram (see Yu et al. 2011 for the rationale for this). Graph comprehension is, in theory, a sine qua non for successful performance of this type of integrated writing tasks (but see Knoch & Sitajalabhorn, 2013 and Yu, 2013 for their different views on what constitutes an integrated writing task). The variability in the features of graphs and test-takers’ ability in comprehending the graphs may pose a threat to the validity and fairness of AWT1 as a measure of writing abilities.
Yu et al. (2011) conducted an extensive review of the literature on graph comprehension in the fields of cognitive and educational psychology and mathematics education (e.g., Carpenter & Shah, 1998; Freedman & Shah, 2002; Guthrie, Weber & Kimmerly, 1993; Hollands & Spence, 1998, 2001; Körner, 2004; Lohse, 1993; Peebles & Cheng, 2002, 2003; Pinker, 1990; Schnotz, Picard, & Hron, 1993; Shah, Freedman, & Vekiri, 2005). We also reviewed the very few studies that investigated the use of graphs in assessing writing (Golub-Smith, Reese & Steinhaus, 1993 on TWE of TOEFL Program; Mickan, Slater & Gibson, 2000; O’Loughlin & Wigglesworth, 2003 on IELTS AWT1), listening (e.g., Ginther, 2002) 1, and speaking (e.g., Katz, Xi, Kim & Cheng, 2004; Xi, 2005).
-
Unlike the graphs used in speaking and writing tasks, graphs or similar visual clues in a listening test (e.g., Ginther 2002) tend to play a facilitative, rather than indispensable, role.
-
Given that Xi (2010) has a similar research focus as Katz et al. (2004) and Xi (2005), it is important that we include the key findings of Katz et al. (2004) and Xi (2005) in this report in order to better understand the findings of Xi (2010).
Below we review more recent publications on the use of graphs in language tests (Xi, 2010; Yu et al. 2011; Yang, 2012; Yu & Lin, 2014). Xi and colleagues (e.g., Katz, et al., 2004; Xi, 2005, 2010) examined the impacts of the different features of graphs, among other assessment conditions such as planning time and scoring methods, on test-takers’ speaking performances2. Katz et al. (2004) manipulated the number of visual chunks in bar graphs in a speaking test to examine their impacts on the quality of test-takers’ oral responses to the tasks. They found that test-takers produced more sophisticated language in global comparisons and trend descriptions based on bar graphs where the key points or information were packed in relatively fewer visual chunks (see also O’Loughlin & Wigglesworth, 2003). Xi (2005) investigated the relationships between the holistic scores of test-takers’ oral descriptions of two types of graphs (line and bar graphs) and their graph familiarity, features of graphs (in terms of the number of visual chunks in graphs), and the task conditions (in terms of the amount of planning time provided). Under the planning conditions, the test-takers received higher holistic scores on both bar and line graph tasks.
Furthermore, when the line graphs have fewer chunks, test-takers’ performance was improved. Overall, test-takers’ graph familiarity was found to have a significant positive influence on their performance on both bar and line graph tasks, but with stronger influence on bar graph tasks. Xi (2010) re-investigated the relationships aforementioned, by using analytic scoring method this time. She found that test-takers who were less familiar with line graphs described the graphs in a less organised manner and that their oral descriptions were also weaker in content. However, when test-takers were provided with planning time and the graphical displays were less complex, the oral descriptions of the graphs were improved, in terms of fluency, organisation and content,. Therefore, the influence of graph familiarity, which she considered as a source of construct-irrelevant variance in the speaking tasks, was mitigated.
Yu et al. (2011) used think-aloud as the main instrument to collect data on test-takers cognitive process when completing IELTS AWT1 tasks. In this research, we found that test-takers’ cognitive processes were affected, to varying degrees, by features of graphs, test-takers’ graph familiarity and English writing ability, as well as their interpretation and expectation of task requirements.
- Features of graphs affected how test-takers processed the graphic information and how they followed the graphic conventions to re-produce their graph comprehension in written discourse in English. Such effects of different graph prompts on the cognitive processes were clearly evidenced in the mean scores of the writings, in their use of vocabulary, and in whether and how they would make comparisons or trend assessments, following the graph conventions in presentation, interpretation and re-production.
- Although graph familiarity, as measured via the graphicacy questionnaire, did not seem to affect task performance in terms of the marks of the writings, test-takers clearly expressed some potential psychological impact of their graph familiarity on task performance. The more familiar they were with a certain type of graph, the more confident they would become in the whole process of writing.
- There was a strong correlation between the test-takers’ performance in the AWT1 integrated writings and their writing performance as measured via topic-based argumentative essays (i.e. IELTS Academic Writing Task 2, AWT2). This is clear evidence that AWT1 measures largely test-takers’ writing ability rather than anything else.
- The test-takers reported that they had a natural and strong tendency to try to make interpretations, predictions and comments by linking the graph information with their domain knowledge about the graphs, although they were not asked to do so explicitly according to the task instructions.
Using questionnaire as the main data collection tool, Yang (2012) asked Taiwanese medical students to self-report retrospectively their use of test-taking strategies when completing the graph-based writing task of the General English Proficiency Test (GEPT). She found that test-takers were engaged in graph comprehension, graph interpretation and graph translation strategies during the task3. In addition, the test-takers’ performance was generally positively affected by their engagement with the three abovementioned activities (i.e., comprehension, interpretation and translation), as well as by test-takers’ graph familiarity, topic knowledge and test-wiseness, which she considered as sources of construct-irrelevant variances.
Following Yu et al. (2011), Yu and Lin (2014) also investigated the extent to which test-takers’ performance and cognitive processes were affected by their graphicacy, English writing ability, and features of graph prompts. We compared test-takers’ cognitive processes when completing GEPT-Advanced Writing Task 2 (GEPT AWT2) and IELTS AWT1, which used the same graph prompts in the research, but differed in the amount of information provided in the task instructions. In addition, GEPT tasks require personal interpretations of the phenomenon depicted in the graphs, while such personal interpretations are not allowed in IELTS tasks. Thirty-two students completed four writing tasks each (two IELTS AWT1 and two GEPT AWT2) in randomised order, while thinking-aloud their writing processes. After the tests, all participants were interviewed. The data showed that graphicacy and types of graphs had only negligible impacts on the participants’ test scores. Furthermore, their test scores in GEPT AWT2 and IELTS AWT1 tasks were highly correlated. However, differences in cognitive processes were clearly evidenced, in particular, towards the second part of the GEPT AWT2 tasks, which required test-takers to make personal interpretations of the data presented in the graphs. Both the think-aloud and interview data provide ample and clear evidence of the differential impacts of graph prompts, test-takers’ graphicacy and writing ability on test-takers’ cognitive processes.
In summary, the studies reviewed above and in Yu et al. (2011) which used different data elicitation methods (e.g., concurrent think-aloud, retrospective self-report questionnaire) and unit of analysis (product vs. process) contribute collectively to better understanding the complex nature of graph-based test tasks. They identify a number of factors, including features of graphs (e.g., types of graphs, quantity and quality of information contained in the graphs), characteristics of test-takers (e.g., their graphicacy, language proficiency, test-taking strategies and other skills), requirements of the tasks (e.g., purpose of the tasks, descriptive or interpretative account of source information), which could affect, in varying degrees and directions, the test-taker’s performance in graph-based writing tasks. Such effects are context and task specific; in other words, they are dependent on the requirements of the writing tasks. What seems to be essential for successful completion of one task might not be that important for successful completion of another task.
- Unlike IELTS AWT1, the GEPT writing task requires test-takers to make interpretations, comments and suggestions based on the data presented in the graphs. See also Yu & Lin 2014, which compared the differences in test-takers’ cognitive processes when they complete the GEPT writing tasks and IELTS AWT1 tasks.
3 Methods
3.1 Research aims and questions
The primary focus of this study is the same as Yu et al. (2011) to examine the cognitive processes of IELTS test-takers when completing AWT1 tasks. However, unlike Yu et al. (2011), which used think-aloud as the main data collection instrument, this study used Tobii X2-60 to record test-takers’ eye-movements as a window to understand their test-taking cognitive processes. To be specific, the research questions are as follows.
RQ1: What are the cognitive processes involved in taking IELTS AWT1 tasks?
RQ2: To what extent are there differences in test-takers’ cognitive processes due to different features of AWT1 graph prompts?
RQ3: To what extent are test-takers’ cognitive processes affected by their graphicacy?
RQ4: To what extent are test-takers’ cognitive processes related to their English writing abilities?
3.2 Research site and participants
In order to make meaningful comparisons between this and our previous research (Yu et al. 2011), we collected data from the same institution - Zhejiang University (www.zju.edu.cn). It is one of the largest and most prestigious universities in China; a large number of its undergraduate and postgraduate students take the IELTS Academic module each year.
The call for participation (Appendix 2) was circulated on the university’s websites. There was enormous interest among the students; nearly 800 students signed up within a couple of days to register their interest via www.survey.bris.ac.uk by providing some personal information such as their name, mobile phone number, email address, gender, department, IELTS test experience and results, and IELTS test plan. Due to the nature of collecting eye-movement data, we selected 5% of them initially as our potential participants. They were selected according to a number of criteria, including first of all that they were intending to take the official IELTS test within the next six to nine months or had had IELTS test experience in order to ensure that they were sufficiently familiar with IELTS AWT1 and also committed to their participation in this project. To achieve a balanced sample, the participants gender, subject (science, social sciences, or arts) and academic status (i.e., undergraduate or postgraduate) were also considered. We also operated a waiting list to replace those students who had to withdraw or be withdrawn due to failure in eye calibrations (see below). The students who completed all the tasks received a small honorarium (£20) as a token of our appreciation for their participation.
In total, 34 students participated at various points (i.e., completed at least one of the tasks in the project, they were identified as Participant #1, Participant #2, … Participant #34). To further ensure anonymity, every participant was reported as “he”. Our final dataset included 27 students4 whose eye-movements were successfully recorded and who completed all the writing tasks, interviews and focus-group discussions. All the subsequent analyses are based on the data collected from these 27 students. Nine of them took an official IELTS test recently. Some basic information about these participants is reported in Table 1.
- These 27 students were coded as Participant #1, 2, 5, 6, 7, 8, 9, 10, 13, 14, 16, 17, 18, 19, 20, 21, 22, 24, 25, 26, 27, 28, 29, 30, 31, 32 and 33. When we report the qualitative data in Sections 4.6.2, 4.7.2, 4.8.2 and 4.8.3, we use these codes.
Table 1: Characteristics of 27 participants who completed every data collection
| Status | Faculty | ||||||
|---|---|---|---|---|---|---|---|
| Status | Arts and Humanities | Engineering | Medicine | Science | Social science | Total | |
| Master | Female | 1 | 1 | 2 | 1 | 5 | |
| Master | Male | 1 | 2 | 1 | 1 | 5 | |
| Master | Sub-total | 2 | 3 | 3 | 2 | 10 | |
| PhD or other doctoral study | Female | 0 | 0 | 1 | 1 | 2 | |
| PhD or other doctoral study | Male | 1 | 1 | 0 | 1 | 3 | |
| PhD or other doctoral study | Sub-total | 1 | 1 | 1 | 2 | 5 | |
| Undergraduate | Female | 2 | 0 | 1 | 5 | 8 | |
| Undergraduate | Male | 0 | 3 | 1 | 0 | 4 | |
| Undergraduate | Sub-total | 2 | 3 | 2 | 5 | 12 | |
| Total | Female | 3 | 1 | 0 | 4 | 7 | 15 |
| Total | Male | 1 | 6 | 1 | 2 | 2 | 12 |
| Total | Total | 4 | 7 | 1 | 6 | 9 | 27 |
There were 15 female and 12 male students in the sample. Twelve students were studying in undergraduate programs, 10 in master programs and 5 in doctoral programs. A third of them (9) were studying in social science, 7 from engineering, 6 from science, 4 from arts and humanities, and 1 from medicine.
3.3 Data collection procedure
The research collected qualitative and quantitative data at three stages using different instruments, as summarised below.
At the first stage, we collected some baseline data in one session. The purpose and procedure of the project was explained to the students before they signed the consent form (Appendix 3). First, we administered IELTS Academic Writing Tasks 1 and 2 (Appendices 4 and 5) to measure the students’ writing abilities under normal IELTS test condition. The students’ hand-written scripts were word processed5 (in Calibri, font size 11) as they were, i.e., no grammatical errors or typos were corrected, before being marked by IELTS certificated raters. A few scripts were double-marked. Second, we administered the graphicacy questionnaire to understand the participants knowledge, familiarity and experience of using different types of graphs (Appendix 6). Finally, we administered the questionnaire on computer familiarity and word processing (Appendix 7), as a measure of the students’ knowledge, familiarity and experience of using computers, especially word processing software, because the Tobii eye-tracking system we used is screen-based and interactive (in the sense that the students need to type their written response). We are confident that these participants are highly computer literate, therefore, this was just a cautious step. The results of the questionnaire confirmed our prediction (see Section 4).
At the second stage, each participant was randomly assigned to three out of four AWT1 tasks of different graph prompts (Appendices 8 to 11); and the order that the participants completed their three tasks was also randomised.
Eye-tracking Task 1 (E1 hereafter) has two graphs (one line, the other horizontal bar) about credit card debt. Eye-tracking Task 2 (E2 hereafter) has one vertical bar and the other pie chart about the carbon dioxide emissions (1990-2008) and the sources for producing electricity (2008) in China. Eye-tracking Task 3 (E3 hereafter) has one line graph about the global fossil carbon emissions from 1880 to 2000.
- As the participants typed their responses in the eye-tracking tasks, we decided to word process the other two writings which they originally wrote on paper to reduce the potential effects of handwriting quality on raters’ behaviours. However, it is important to note that IELTS raters typically read handwritten scripts.
Eye-tracking Task 4 (E4 hereafter) has two statistical tables about IELTS and TOEFL iBT test-taker performance by geographic regions in Asia in 2011 and 2012 respectively.
The four tasks were completed by a similar number of participants (E1=22 participants, E2=20, E3=19, and E4=20). The design of these tasks followed the same procedure as in Yu et al. (2011). Each task was allocated 20 minutes, plus a five-minute break between the two tasks to ensure that the participants remained attentive. The participants were reminded verbally of the time remaining at 10, 5, 3, 2 and 1 minute(s).
The tasks were presented on the screen (15 inch diagonal, 10 inch height, 1920x1080 resolution) of Hewlett-Packard Elitebook 8570 laptop (Windows 7 Professional, Core i7, 8GB RAM), as a “screen recording” element in Tobii Studio (Enterprise version 3.2.1). The tasks were presented on the left half of the screen, and the participants were asked to type their writings into the right half of the screen, with spelling and grammar check functions disabled. The task prompt and the writing column were originally designed as two separate A4-size pages as an Adobe fillable form, but they were presented during the test on a two-page view (see Appendix 12), i.e., on one screen, and non-scrollable. Firstly, this was to make sure that all the participants were working on exactly the same screen presentation, which helps reduce the margins of errors when defining Areas of Interest (AOI) for the analysis of eye-movement data. Secondly, this design mirrors real-life paper-based test situation where test-takers can read the test prompt on the left side and write their responses on the right side simultaneously. Although the presentation of two pages on one screen made the words and graphs look smaller, our pilot study with students of normal eye-sight indicated that the words and graphs were big enough and readable. It should also be noted that the focus of this research is not on any single word, therefore, the font size of any single lexical item in this research is of less concern than Spinner, Gass and Behney’s (2013) study on “articles” in a reading passage. However, we do agree with them that screen layout is critical in any eye-tracking research.
The participants’ eye-movements were captured using Tobii X2-60 eye-tracker which has a sampling rate at 60 Hz. This eye-tracker does not require chin rests. It has an operating distance (i.e., eye tracker to participant) between 45-90cm, and freedom or tolerance of head movement at 70cm as 50x36cm (width x height). The eye-tracker was attached to the mounting bracket which was placed in the centre of the bottom frame of the laptop’s screen to minimise any distractions to participants. Each participant’s eye fixations and saccades were carefully calibrated to ensure the accuracy of subsequent eye-tracking. Before starting to track the participants’ eye-movement, the procedure of doing the eye-tracking experiment was clearly explained to the participants verbally and then as on-screen instructions in Tobii Studio (Appendix 13).
The calibration type was set as “regular” with “red” as foreground colour and “medium” calibration speed and nine calibration points. There were a few cases of failure in calibrations due to various reasons (mostly because of the participants wearing some strange coloured or shaped glasses or contact lenses) and the concerned participants had to be withdrawn from the project. The “screen capture” was set at 10 frame rate, with user camera and audio (HP laptop integrated) turned on so that the participants’ head movements and any background audio were recorded simultaneously. The recorded head movements and audio (e.g., the sound of typing) provide supplemental background information for interpretation of each individual participant’s eye-movement data. I-VT filter was selected as the fixation filter in Tobii Studio, with the following settings:
| Gap fill-in (interpolation) | Enabled, with max gap length 75 ms |
|---|---|
| Eye selection | Average of left and right |
| I-VT classifier | Velocity threshold: 30 degrees/second |
| Merge adjacent fixations | Enabled, with max time between fixations 75 ms, and max angle between fixations 0.5 degrees |
| Discard short fixations | Enabled, with minimum fixation duration of 60 ms |
Immediately after finishing the three eye-tracking tasks, the participants were interviewed individually, with their recorded eye-movement videos replayed as stimuli for further discussions to explore the cognitive processes involved and the ways in which their cognitive processes may be affected by the different graph prompts, their graphicacy and writing abilities. The interviews were conducted in Chinese. Initially we had planned to replay every single recorded eye-movement video full-length as the stimuli during the interviews, and we did that with the first few participants. However, we found that this became unrealistic and an unnecessary burden on our participants because some of them were already very tired after working intensively and staring at the computer screen for over one hour. To achieve the best and most active contribution of the participants, we decided to re-play only randomly selected episodes as stimuli for discussion (see Appendix 14). The length of the interviews ranged from a few minutes to half an hour for each task. In total, we conducted about 11 hours of retrospective stimulated interviews; with just less than half an hour, on average, with each participant.
After we finished the stimulated recall interviews, we conducted six focus-group discussions in Chinese. The focus-group discussions used the same guiding questions (see Appendix 14) as in the individual retrospective stimulated interviews. However, unlike the individual interviews, the group discussions were led by the students, with the researcher as a facilitator only if needed, in order to minimise the researcher’s influence on how the students would respond to the questions and on how they would interact with each other. Although the stimulated recall interviews were not conducted in full length as originally planned, together with the focus-group discussions they provide abundant supplemental information to facilitate interpretation of the participants’ eye-movement data.
In summary, this research comprised three distinct stages (see Table 2). The data includes the participants’ performance in two writing tasks (graph-based and topicbased) in normal examination condition, their graphicacy and computer familiarity (Stage 1). Stage 2 collected data on participants’ cognitive processes when completing three different AWT1 tasks, through eye-tracking and retrospective stimulated interviews. In Stage 3, six student-led focus-group discussions were conducted. Throughout the data collection, field notes were taken, which provide useful additional information about the participants and their test-taking processes.
Table 2: Summary of data collection stages, sources and size
| Data collection stage | Instrument/data | Data size |
|---|---|---|
| Stage 1 (normal test condition) | IELTS AWT1 | 27 scripts |
| Stage 1 (normal test condition) | IELTS AWT2 (topic-based) | 27 scripts |
| Stage 1 (normal test condition) | Graphicacy questionnaire | 27 participants |
| Stage 1 (normal test condition) | Familiarity: computer and word processing | 27 participants |
| Stage 2 (eye-tracking experiments) | Eye-movements videos | 27 hours |
| Stage 2 (eye-tracking experiments) | Stimulated retrospective interviews videos | 11 hours |
| Stage 2 (eye-tracking experiments) | IELTS AWT1 (three tasks) | 81 scripts |
| Stage 3 (focus group) | Student-led focus-group discussions | 6 hours |
3.4 Methods of data analysis
A mixed approach in data analysis was adopted to explore the multiple sources of data in order to understand the complexity of test-takers’ cognitive processes. The participants’ written scripts produced in normal examination condition (Stage 1) were word-processed as they were (i.e., no grammatical errors or typos were corrected). Their writings in the eye-tracking experiments were extracted from Tobii Studio. These scripts were anonymised and marked by certificated IELTS raters according to IELTS rating criteria and practice. A few scripts were double-marked to check rating consistency. Together with the participants’ computer familiarity and graphicacy data, the participants’ writing performance data were used to model the relationship between graphicacy, computer familiarity and test performance.
The qualitative interviews and focus-group discussions were transcribed, coded and categorised in Nvivo 10 to understand test-taking cognitive processes, from the participants’ perspectives (i.e., based on what they said). The eye-tracking data provide us with the main source of quantitative and qualitative evidence (i.e., based on how they did) of the test-taking cognitive processes.
As the first step of analysing any qualitative data, we watched the visualisations of the recorded eye-movements to get an overview and general impression of the eye movement data. To be specific, we viewed, through “replay” and then “visualisations” functions in Tobii Studio, each single recording individually. At the “visualisations” stage, the eye-movement data were viewed in two modes - “sliding window” and then “accumulate” - in sequence, in both “gazeplot” and “heatmap” outputs.
After all the recordings have been viewed individually, the accumulated gazeplot and heatmap of each recording/participant of each AWT1 task was compared to get a sense of the differences, visually, in eye fixations and saccades between different participants and between different AWT1 tasks (see Appendices 15 and 16 for examples. Note: We used the same three participants’ eye-movement data in Task 1 to generate the gazeplots and heatmaps). After we had compared all the visualisations of the eye-movements at individuals’ level, we then looked at the visualisations of all recordings at task and group levels, at different time-segments. To be specific, we examined the differences and similarities in “visualisations” by the type of graphs (table, line graph, pie chart, horizontal bar graph, vertical bar graph, see Appendices 8 to 11), participants’ English writing ability, graphicacy level, as well as computer familiarity.
To do further statistical analysis of the eye movement data, we created areas of interest (AOI) of the recorded media. In the left half of the screen, we defined two to three AOIs, depending on the number of graphs used in the task prompt. The standard task instructions were defined as one AOI. Each graph was defined as one AOI. If there were two graphs used in a task, then there would be three AOIs in the left half of the screen. In the right half of the screen, we defined only one AOI, approximately the top 50% of the main textbox where the participants entered their responses. The eye fixations on different AOIs and the saccades between different AOIs, especially the saccades between the AOIs in the left half and those in the right half of the screen provide the essential evidence into test-takers’ cognitive processes.
4 Results
Before we focus on the eye-movement data to address the four research questions, it is important to provide an overview of the characteristics of the participants, in terms of their computer familiarity, graphicacy, and English writing proficiency.
4.1 Participants’ familiarity with using computers and word processing
As a cautious step, we measured the participants’ familiarity in using computers and word processing. Responses to Question 2 (see Appendix 7) can be exclusive to each other; in other words, students who use computers more often in the dormitory may be less likely to use computers in university labs as often, and vice versa. Therefore, we decided to choose the biggest score of Question 2a, 2b, 2c, as the representative score for Question 2. The questionnaire used a scale from 1 to 4, with a larger number indicating a higher computer familiarity. In total, the maximum possible score of the questionnaire is 72 (i.e., 18 questions x 4 points). As shown in Figure 1, the mean score was nearly 63 (i.e., 87.5% of the maximum possible score), which confirmed our prediction that these participants are highly familiar with using computer and Word processing (minimum=53, maximum=71, std. deviation=4.85). The difference between male and female students, with female students about 3 points higher, was not statistically significant (note the small sample).

Figure 1: Participants’ familiarity with using computers and word processing
However, it should be noted that these students were probably much more familiar with using Chinese than English word processing (see Table 3), although they were highly familiar with both (mean of English word processing=3.26, std. deviation=1.02; mean of Chinese word processing=4.00, std. deviation=0; mean of sending English emails =2.81, std. deviation=0.83; mean of sending Chinese emails=3.89, std. deviation=0.42).
Table 3: Participants’ familiarity with word processing in English and Chinese Paired Samples Test
| Pair | Comparison | Paired diff Mean | Paired diff Std. deviation | Paired diff Std. error mean | 95% CI Lower | 95% CI Upper | t | df | Sig. (2 tailed) |
|---|---|---|---|---|---|---|---|---|---|
| Pair 1 | Word processing (English) - Word processing (Chinese) | -.741 | 1.023 | .197 | -1.145 | -.336 | -3.764 | 26 | .001 |
| Pair 2 | Sending English emails - Sending Chinese emails | -1.074 | .781 | .150 | -1.383 | -.765 | -7.148 | 26 | .000 |
4.2 Participants’ graphicacy
The graphicacy questionnaire used a scale of 1 to 6, with a larger number indicating a higher graphicacy level for all the questions but No. 12, 13, 33 and 34-37. For Questions 12, 13 and 33, a larger number indicated a lower graphicacy level, because the statements were phrased negatively; therefore, the participants’ responses to these three questions were recoded (e.g., 1 to 6, and 6 to 1) to be consistent with the other questions. Questions 34-37 asked for the participants’ views on the relationships between their graphicacy and IELTS AWT1 performance, in other words, these questions did not measure directly the participants’ graphicacy level. Data from these four questions were analysed separately. In total, there were 31 items in the questionnaire to measure the participants’ graphicacy level, with the maximum of 186 (31x6) points and minimum of 31 (31 x1) and Cronbach’s Alpha=0.915.
As shown in Figure 2, the mean of the participants’ graphicacy was 138.2 (minimum=90, maximum=176, std. deviation=19.3), i.e., around 74.2% of the maximum possible score. Overall, they had the similar graphicacy profile as the participants in Yu et al. (2011). There was no statistically significant difference between male and female students, with male students having about 7.5 points higher.

Figure 2: Participants’ graphicacy level
Table 4: Participants’ familiarity with different types of graphs (N=27)
| graphQ14(bar graph) | graphQ15(line graph) | graphQ16(pie) | graphQ17(diagram) | graphQ18(statistical table) | |
|---|---|---|---|---|---|
| Mean | 4.56 | 4.70 | 4.89 | 4.41 | 4.22 |
| Std. deviation | 1.281 | .993 | 1.050 | 1.185 | 1.368 |
| Minimum | 2 | 3 | 2 | 2 | 1 |
| Maximum | 6 | 6 | 6 | 6 | 6 |
Questions 14, 15, 16, 17 and 18 measured the participants’ familiarity with particular types of graphs (bar, line, pie, diagram and statistical table respectively). The data (see Table 4) indicated that the participants were more familiar with pie chart than any other types of graphs and that they were least familiar with statistical tables, however, none of the differences were statistically significant.
Four additional questions asked for the participants’ views on the relationships between their graphicacy and IELTS AWT1 task performance. The participants responses to Question 34 (I am concerned that I cannot fully demonstrate my writing ability in IELTS Academic Writing Task 1 because I am not good at describing graphs) spread across the six categories and the differences among them were not significant according to the chi-square test statistics (chi-square=3.89, df=5, n.s.). In other words, they did not think that their skills in describing graphs would be the determining factor in their IELTS AWT1 writing performance. However, the overwhelming majority of the participants (24 out 27, chi-square=10.59, df=4, p<.05) chose 4 to 6 (i.e., on the strongly agree side) in their response to Question 35 (I may do better in IELTS Academic Writing Task 1 using familiar graphs than unfamiliar ones). In other words, they believed, perhaps vaguely, that their familiarity with certain types of graphs would be helpful for them to achieve a higher score. However, they were not so clear as to which type of graph they would wish to see in the test, as their responses to Question 36 (I would prefer one type of graph to be used in IELTS Academic Writing Task 1) clearly showed (chi-square=6.1, df=5, n.s.). Their trust on the value of some special training on how to describe graphs (Question 37: Special training on how to describe graphs would be helpful for me to get a higher score in IELTS Academic Writing Task 1) was unanimous - 26 participants chose 5 or 6 and the remaining one chose 4 (chi-square=12.67, df=2, p<.005). The questionnaire data indicated that there existed some complicated relationships between graphicacy and IELTS AWT1 test performance, from the test-takers’ perspectives. Further qualitative data from the retrospective stimulated interviews and focus-group discussions, and the eye-movement data (see Section 4.5) will be useful to understand such complicated relationships.
4.3 Participants’ writing performance
Twenty-seven students completed all the tests. The scripts were marked by two IELTS certificated raters according to the official IELTS rating scales and practice. A few scripts were double-marked to check the consistency in marking. Each script was awarded four scores on Task Achievement (TA), Coherence and Cohesion (CC), Lexical Resources (LR), and Grammatical Range and Accuracy (GRA). We added the four scores and divided it by 4 to get the band score. The figures after decimal point were rounded in this way: anything below 0.25 was ignored, above 0.25 (e.g., 0.40) was rounded up to 0.5, above 0.5 (e.g., 0.75) was rounded up to 1. The mean band scores awarded to these university students (see Table 5) were below the national average (5.3) of test-takers from China (see IELTS Test-takers’ Performance 2013). They were about 0.5 to 1.0 band lower than the first author of this report expected after reading all the scripts.
Table 5: Participants’ performance in the six writing tasks (unadjusted band scores)
| E1 | E2 | E3 | E4 | T1 | T2 | |
|---|---|---|---|---|---|---|
| N | 22 | 20 | 19 | 20 | 27 | 26 |
| Mean | 5.09 | 5.18 | 5.08 | 5.25 | 5.15 | 5.98 |
| Std. deviation | .7813 | .6544 | .6925 | .7164 | .7572 | .8183 |
| Minimum | 3.00 | 4.00 | 4.00 | 4.00 | 4.00 | 4.50 |
| Maximum | 6.50 | 6.00 | 6.50 | 6.50 | 7.00 | 8.00 |
Notes: E1= eye-tracking Task 1; E2= eye-tracking Task 2; E3= eye-tracking Task 3; E4 = eye-tracking Task 4; T1= academic writing task 1 without eye-tracking; T2= academic writing task 2 without eye-tracking
In our sample, nine students who had taken IELTS before our data collection achieved a mean band score of 6.67 in Total (mini.=6.0, max.=7.5, std. deviation=0.50) and 6.0 in Writing (mini.=5.5, max.=7, std. deviation=0.56), higher than the scores reported in Table 5. There could be a number of reasons for this lower-than expected mean scores of the participants’ performances in this research. Firstly, the scripts were presented to the raters on computer screen, therefore, any spelling or grammatical errors were perhaps more noticeable than if the scripts were handwritten and on paper. Secondly, the two raters might be harsher than average and there might also be some inconsistency between the two raters. Fifteen scripts of E1 task, and 10 of T2 task were double-marked. On average, Rater 1 was about 0.7 band score more generous in Task Achievement than Rater 2 in the 15 double-marked E1 scripts. In the 10 double-marked scripts of T2 task, Rater 1 was again more generous than Rater 2. Rater 1 was 1.2 band score more generous in Task Achievement, 0.7 band score more generous in both Coherence and Cohesion and Lexical Resources. All these differences were statistically significant. Rater 2 seemed to be harsher in this respect. All E3 and E4 scripts and 12 of E2 scripts were marked by Rater 2 only. Rater 2 also marked all E1 scripts, with a proportion of E1 scripts double-marked by Rater 1.
This has been particularly puzzling. The first author then presented some scripts, which he would have given a higher score, to three experienced IELTS writing teachers to mark independently, without disclosing the scores already assigned by the certificated IELTS raters. These teachers also gave higher scores than the certificated raters. After very careful consideration of the situation, especially the fact that Rater 2 might be harsher in marking and marked the majority of the scripts produced in the four eye-tracking tasks, the author decided it was necessary to adjust the scores by adding 0.5 to the average of the four sub-scores (TA, CC, LR and GRA), and then rounded the scores as explained in the first paragraph of this section. We could have asked other IELTS certificated raters to blind mark the scripts again if we had resources to do so. As a result of the adjustment, some scores remained the same as the unadjusted, the majority were 0.5 higher, and the rest were 1.0 higher (see Table 6). On average, it was about 0.5 higher (see Table 7).
Table 6: Adjustment of scores
| E1 | E2 | E3 | E4 | T1 | T2 | |
|---|---|---|---|---|---|---|
| N | 22 | 20 | 19 | 20 | 27 | 26 |
| Same | 5 | 3 | 3 | 7 | 11 | 7 |
| 0.5 higher | 12 | 14 | 9 | 10 | 11 | 16 |
| 1.0 higher | 5 | 3 | 7 | 3 | 5 | 3 |
Table 7 reports the participants’ performances in the six writing tasks after adjustment. The mean scores are slightly above the national average of 5.3, although still lower than the mean scores achieved by the nine students who had taken IELTS before our data collection. The adjusted band scores were used in the subsequent analysis in this report.
Table 8 reports the correlations in students’ performances between the six writing tasks. The majority of the correlations in test scores between the tasks were statistically significant and reasonably strong. However, it should be noted that E1 and E2 did not have significant correlations with T1 or T2; and E2 and E3 did not have significant correlation either.
Table 7: Participants’ performance in the six writing tasks (adjusted band scores)
| E1 | E2 | E3 | E4 | T1 | T2 | |
|---|---|---|---|---|---|---|
| N | 22 | 20 | 19 | 20 | 27 | 26 |
| Mean | 5.59 | 5.68 | 5.68 | 5.65 | 5.54 | 6.40 |
| Std. deviation | .7659 | .6340 | .7676 | .6902 | .7712 | .8002 |
| Minimum | 4.00 | 4.50 | 4.50 | 4.50 | 4.00 | 5.00 |
| Maximum | 7.00 | 7.00 | 7.00 | 7.00 | 7.00 | 8.50 |
Table 8: Correlations between the six writing tasks
| E2 | E3 | E4 | T1 | T2 | ||
|---|---|---|---|---|---|---|
| E1 | Pearson correlation | .652** | .562* | .655** | .300 | .168 |
| E1 | Sig. (2-tailed) | .008 | .037 | .008 | .174 | .466 |
| E1 | N | 15 | 14 | 15 | 22 | 21 |
| E2 | Pearson correlation | .428 | .717** | .293 | .364 | |
| E2 | Sig. (2-tailed) | .165 | .006 | .211 | .126 | |
| E2 | N | 12 | 13 | 20 | 19 | |
| E3 | Pearson correlation | .888** | .596** | .547* | ||
| E3 | Sig. (2-tailed) | .000 | .007 | .015 | ||
| E3 | N | 12 | 19 | 19 | ||
| E4 | Pearson correlation | .520* | .622** | |||
| E4 | Sig. (2-tailed) | .019 | .004 | |||
| E4 | N | 20 | 19 | |||
| T1 | Pearson Correlation | .651** | ||||
| T1 | Sig. (2-tailed) | .000 | ||||
| T1 | N | 26# |
**. Correlation is significant at the 0.01 level (2-tailed). *. Correlation is significant at the 0.05 level (2-tailed). Note #: One T2 script went missing, so N=26 for T2
4.4 Correlations between computer familiarity, graphicacy and writing performance
In this section, we briefly report the correlations between the participants’ computer familiarity, graphicacy and their performance on the eye-tracking writing tasks. Although the participants’ computer familiarity did not have significant correlations with their overall/averaged performance in the three writing tasks they completed (r=0.353, N=27, n.s.), the correlations between computer familiarity and E1 and E3, at the individual task level, were statistically significant (see Table 9).
Table 9: Correlations between computer familiarity and performance on the eye-tracking writing tasks
| E1 | E2 | E3 | E4 | ||
|---|---|---|---|---|---|
| Computer familiarity and word processing | Pearson correlation | .438* | .075 | .478* | .207 |
| Computer familiarity and word processing | Sig. (2-tailed) | .041 | .754 | .039 | .381 |
| Computer familiarity and word processing | N | 22 | 20 | 19 | 20 |
*. Correlation is significant at the 0.05 level (2-tailed).
There was no significant correlation between the participants’ graphicacy score and their overall performance in the three eye-tracking writing tasks they completed (r=0.293, N=27, n.s.). At the individual task level, no significant correlation was observed either (see Table 10).
Table 10: Correlations between graphicacy and performance on four eye-tracking writing tasks
| E1 | E2 | E3 | E4 | ||
|---|---|---|---|---|---|
| Graphicacy | Pearson correlation | .389 | .142 | .012 | .375 |
| Graphicacy | Sig. (2-tailed) | .073 | .549 | .961 | .104 |
| Graphicacy | N | 22 | 20 | 19 | 20 |
No significant correlation was noted, either, between the participants’ familiarity with a specific type of graph and their performance in a task that used the type of graph concerned. However, it is worth pointing out that the correlation between the participants’ familiarity with line graph (Q15) and their performance in E3 which used a complex line graph was close to statistical significance (r=0.444, p<0.0575). We speculated that test-takers’ knowledge and familiarity with a certain type of graph could become essential for their successful task performance when the comprehension of the graph requires more than basic familiarity with the graph. See further analysis and discussion in Section 4.7 (Research Question 3).
In Sections 4.1 to 4.4, we presented an overview of the participants’ familiarity with using computers and word processing (typing speed), their graphicacy, and writing performance in the eye-tracking experiments and under normal examination conditions, as well as the correlations between computer familiarity, graphicacy and writing performance. In the next sections (Sections 4.5 to 4.8), we address the four research questions, focusing on test-takers’ cognitive process as evidenced in their eye-movement.
RQ1: What are the cognitive processes involved in taking IELTS AWT1 tasks?
RQ1 is an overarching question to understand test-takers’ overall cognitive processes when they complete the graph-based writing tasks. Research questions 2-4 aim to explore further in detail the effects on test-takers’ cognitive processes of different features of graphs, test-takers’ graphicacy and writing abilities. There are four sources of data: test-takers’ performance, recorded eye-movement, stimulated recall interviews and focus-group discussions. Unlike our previous study which used think-aloud protocols as the major source of data to examine test-takers’ cognitive processes (Yu et al. 2011), this present study used the recorded eye-movement data as the major source of data to understand test-takers’ cognitive processes, supplemented by data of test performance and interviews/discussions.
Three main areas of interest were identified: instructions, graph(s) and the textbox for entering responses to the tasks. When a task used two graphs, each graph was defined as one area of interest; hence there were four AOIs in E1, E2 and E4 and three AOIs in E3.
The eight key metrics of eye-movement, defined below, are reported for each AOI, task by task.
- Time to first fixation: the time from the start of the stimulus display until the participant fixates on the AOI or AOI group for the first time (seconds)
- First fixation duration: duration of the first fixation on an AOI or an AOI group (seconds)
- Fixation duration: duration of each individual fixations within an AOI or within all AOIs belonging to an AOI group (seconds)
- Total fixation duration: duration of all fixations within an AOI or within all AOIs belonging to an AOI group (seconds)
- Fixation count: number of times the participant fixates on an AOI or an AOI group (count)
- Visit duration: duration of each individual visit within an AOI or an AOI group (seconds); an individual visit is defined as the time interval between the first fixation on the active AOI and the end of the last fixation within the same active AOI where there have been no fixations outside the AOI
- Total visit duration: duration of all visits within an AOI or an AOI group (seconds)
- Visit count: number of visits within an AOI or an AOI group (count)
4.5.1 Time to first fixation
In Task 1, as shown in Table 11, on average, the participants paid their attention first to the task instructions. The lowest standard deviation (6.11) and lowest maximum value of E1-instructions showed that there was also a high level of uniformity in the participants’ attention to task instructions. The next AOI that the participants read was the line graph, followed by the main textbox. It is interesting to observe that the mean values of the line graph and the main textbox were very close, 12.50 and 14.54 respectively; however, the standard deviation of the main textbox was bigger, which indicated a much larger variation among the participants in their first attention to the main textbox. This was probably caused by the fact that some participants dived straight in (i.e., started to write) immediately after they had viewed the line graph and some started to write only after they had read both the line graph and the bar graph, attempting to gain an overview of the task (see Appendix 8 for the task layout). This pattern was also evidenced by the largest mean (45.10), standard deviation (56.29) and maximum (260.52) of the bar graph.
Overall, the data on time to first fixation on the four AOIs of Task 1 demonstrated that test-takers were not necessarily following a linear approach from top to bottom. The participants started to write their responses at the point when they felt they could write down anything, not waiting until they had finished reading all graphs. The normal distribution tests using one-sample Kolmogorov-Smirnov showed that only the last AOI (bar graph) was of normal distribution (Z=1.128, n.s.), which provided further evidence of the large variation among the participants in their first attention to the other three AOIs.
| E1 instructions | E1 linegraph | E1 writingmaintext | E1 bargraph | |
|---|---|---|---|---|
| Mean | 4.9136 | 12.5032 | 14.5418 | 45.0950 |
| Std. error of mean | 1.30357 | 3.50745 | 6.16557 | 12.00207 |
| Median | 1.2200 | .9500 | 3.1900 | 40.0450 |
| Std. deviation | 6.11427 | 16.45139 | 28.91910 | 56.29471 |
| Skewness | 1.353 | .976 | 2.771 | 2.849 |
| Kurtosis | .755 | -.511 | 7.660 | 10.348 |
| Minimum | .00 | .00 | .12 | .15 |
| Maximum | 20.56 | 49.72 | 117.38 | 260.52 |
| Kolmogorov-Smirnov Z | 1.460 | 1.426 | 1.821 | 1.128 |
| Asymp. Sig. (2-tailed) | .028 | .034 | .003 | .157 |
In Task 2, a similar pattern was observed (see Table 12), with some interesting differences between Task 1 and Task 2. As in Task 1, the participants also read the task instructions first. It took almost the same length of time for the participants to pay attention to the first graph (bar) and the main textbox, which was about 2-4 seconds shorter than in Task 1. The smaller standard deviation (10.63) and maximum values (30.90) of the bar graph compared to those for main textbox (18.78 and 83.22) indicated that there was a larger variation among the participants in their first attention to the main textbox than the bar graph. The larger variation in the main textbox than the first graph is also observed in Task 1. Again, as in Task 1, it took the longest time for the participants to pay attention to the second graph in the task (mean=15.10), in this case, the pie chart (see Appendix 9 for the task layout). However, it took much longer in Task 1 (45 seconds, see Table 11) than in Task 2 (15 seconds, see Table 12).
| E2 instructions | E2 writingmaintext | E2 bargraph | E2 piechart | |
|---|---|---|---|---|
| Mean | 4.7865 | 10.0310 | 10.1410 | 15.0985 |
| Std. error of mean | 1.42611 | 4.20042 | 2.37737 | 3.30891 |
| Median | 1.1450 | 3.2350 | 8.8800 | 10.3450 |
| Std. deviation | 6.37778 | 18.78486 | 10.63191 | 14.79789 |
| Skewness | 1.669 | 3.487 | .526 | .511 |
| Kurtosis | 2.577 | 13.248 | -1.182 | -1.259 |
| Minimum | .12 | .00 | .00 | .38 |
| Maximum | 23.56 | 83.22 | 30.90 | 43.35 |
| Kolmogorov-Smirnov Z | 1.357 | 1.496 | 1.181 | .933 |
| Asymp. Sig. (2-tailed) | .050 | .023 | .123 | .349 |
In Task 3, as shown in Table 13, the participants also paid attention to the task instructions first, followed by the line graph and the main textbox. The main textbox had the biggest standard deviation and maximum values in time to first fixation.
| E3 instructions | E3 linegraph | E3 writingmaintext | |
|---|---|---|---|
| Mean | 3.2016 | 6.7242 | 15.5000 |
| Std. error of mean | 1.02180 | 2.72161 | 6.87377 |
| Median | 1.3600 | .7100 | 2.5300 |
| Std. deviation | 4.45391 | 11.86324 | 29.96209 |
| Skewness | 1.819 | 1.964 | 2.382 |
| Kurtosis | 1.925 | 3.377 | 4.999 |
| Minimum | .13 | .00 | .00 |
| Maximum | 14.45 | 41.71 | 107.33 |
| Kolmogorov-Smirnov Z | 1.808 | 1.755 | 1.590 |
| Asymp. Sig. (2-tailed) | .003 | .004 | .013 |
| E4 Instructions | E4 Writingmaintext | E4 table1 | E4 table2 | |
|---|---|---|---|---|
| Mean | 3.7640 | 13.5080 | 22.7160 | 117.3310 |
| Std. error of mean | 1.21935 | 6.30715 | 4.83655 | 48.87619 |
| Median | 1.1500 | 2.6100 | 24.2100 | 57.9850 |
| Std. deviation | 5.45308 | 28.20644 | 21.62973 | 218.58099 |
| Skewness | 2.127 | 2.981 | .276 | 3.622 |
| Kurtosis | 4.717 | 9.340 | -1.503 | 13.883 |
| Minimum | .15 | .00 | .03 | .20 |
| Maximum | 21.31 | 115.63 | 60.94 | 975.96 |
| Kolmogorov-Smirnov Z | 1.635 | 1.817 | 1.076 | 1.753 |
| Asymp. Sig. (2-tailed) | .010 | .003 | .198 | .004 |
In Task 4 (see Appendix 11 for the task layout), we also found that the participants paid attention to the task instructions first, before moving on to the main textbox (see Table 14). However, it is interesting to note that it took significantly longer for the participants to have their first fixation on the two tables; and this is particularly notable for the second table, with a mean of 117.33 and maximum of 975.96.
In summary, it took about 3.2 to 4.9 seconds for participants to fixate on the first AOI - the task instructions (see Figure 3). The participants would not necessarily have already viewed all the graphs before noticing the main textbox or attempting to write in the textbox, as Participant #30 commented during focus-group discussions:
“I would like to spend around one minute finding out the overall information of the graphs, start to write straightaway, then write and read graphs in turn; in other words, I would not spend a lot of time reading graphs in the first instance”
(然后我个人感觉读表方面我更喜欢就是花一分钟左右时间看一下比如说各个图表的趋势信息, 然后就会立开始写, 边写然后会边结合图表来表达, 而不是一开始花很长时间读图)6.
Furthermore, it is noted that the gap between the second and the third AOI was very small in both Tasks 1 and 2; however, the gap was larger in Tasks 3 and 4. The gap between the third and the fourth/last AOI (or between the second and the third/last in Task 3) varied enormously across the tasks, from 4.96 seconds in Task 2, 8.78 in Task 3, 30.56 in Task 1, to 94.61 in Task 4. The biggest gap was noted in Task 4 between the two tables (see Figure 3), which suggests that the participants had spent a much longer period of time on the first table before moving on to look at the second table. This is clear evidence of impacts of graph features on the test-taking process.
- The English scripts are not necessarily word-forword translations of the Chinese scripts as they were spontaneous discussions and the sentences were sometimes not well organised. For the sake of transparency, we include both English translation and the original Chinese scripts.

Figure 3: Time to first fixation of all AOIs in the four tasks
4.5.2 First fixation duration
As anticipated, there was not much variation in the first fixation duration between the AOIs within a task, as shown in Tables 15 to 18.
| E1 linegraph | E1 writingmaintext | E1 bargraph | E1 instructions | |
|---|---|---|---|---|
| Mean | .1100 | .1291 | .1350 | .1377 |
| Std. error of mean | .01510 | .01520 | .01830 | .01679 |
| Median | .0800 | .1000 | .1000 | .1100 |
| Std. deviation | .07085 | .07131 | .08584 | .07874 |
| Skewness | 2.545 | 1.330 | 2.228 | 1.373 |
| Kurtosis | 8.358 | 1.097 | 6.047 | 2.056 |
| Minimum | .03 | .07 | .07 | .07 |
| Maximum | .37 | .32 | .43 | .37 |
| Kolmogorov-Smirnov Z | .983 | 1.169 | 1.053 | .914 |
| Asymp. Sig. (2-tailed) | .289 | .130 | .218 | .374 |
| E2 bargraph | E2 writingmaintext | E2 piechart | E2 instructions | |
|---|---|---|---|---|
| Mean | .1165 | .1280 | .1305 | .1315 |
| Std. error of mean | .01407 | .01329 | .02328 | .01232 |
| Median | .1100 | .1150 | .0900 | .1300 |
| Std. deviation | .06293 | .05944 | .10410 | .05509 |
| Skewness | 2.250 | .913 | 2.790 | 1.270 |
| Kurtosis | 6.656 | -.231 | 8.518 | 1.637 |
| Minimum | .04 | .07 | .07 | .07 |
| Maximum | .33 | .25 | .50 | .28 |
| Kolmogorov-Smirnov Z | 1.185 | .834 | 1.350 | .754 |
| Asymp. Sig. (2-tailed) | .120 | .489 | .052 | .621 |
| E3 linegraph | E3 writingmaintext | E3 instructions | |
|---|---|---|---|
| Mean | .1026 | .1226 | .1421 |
| Std. error of mean | .01216 | .01760 | .02150 |
| Median | .0800 | .0900 | .1000 |
| Std. deviation | .05300 | .07673 | .09372 |
| Skewness | .979 | 2.291 | 1.333 |
| Kurtosis | .188 | 5.591 | .857 |
| Minimum | .02 | .07 | .07 |
| Maximum | .22 | .37 | .37 |
| Kolmogorov-Smirnov Z | 1.294 | 1.095 | .963 |
| Asymp. Sig. (2-tailed) | .070 | .182 | .312 |
| E4 table1 | E4 table2 | E4 Writingmaintext | E4 Instructions | |
|---|---|---|---|---|
| Mean | .1055 | .1095 | .1190 | .1755 |
| Std. error of mean | .01146 | .01160 | .01140 | .03474 |
| Median | .0800 | .0800 | .1000 | .1350 |
| Std. deviation | .05125 | .05186 | .05098 | .15538 |
| Skewness | 2.196 | 1.660 | 1.823 | 3.401 |
| Kurtosis | 5.135 | 2.172 | 4.216 | 13.134 |
| Minimum | .07 | .07 | .07 | .07 |
| Maximum | .27 | .25 | .28 | .78 |
| Kolmogorov-Smirnov Z | 1.092 | 1.186 | .873 | 1.285 |
| Asymp. Sig. (2-tailed) | .184 | .120 | .430 | .074 |
As shown in Kolmogorov-Smirnov Z statistics in Tables 15 to 18, the data were of normal distribution (Note: E2 pie chart was at borderline of significance, see Table 16). The paired samples t-tests between any two AOIs within each task confirmed that there was no statistically significant difference in first fixation duration. Although not statistically significant, task instructions had the longest first fixation duration among all the AOIs across the four tasks consistently (0.138, 0.132, 0.142, and 0.176 for Task 1, 2, 3 and 4 respectively, see Figure 4).

Figure 4: First fixation duration of all AOIs in the four tasks
4.5.3 Fixation duration
Fixation duration refers to the average of durations of individual fixations within an AOI, and it is measured in seconds. Below, we report the descriptive statistics and one-sample Kolmogorov-Smirnov tests of fixation duration of each AOI, task by task. Appendices 17 to 20 provide further information such as maximum, minimum, median and standard deviation of fixation duration of each AOI within a task.
| E1 bargraph_Mean | E1 linegraph_Mean | E1 Writingmaintext_Mean | E1 instructions_Mean | |
|---|---|---|---|---|
| Mean | .1127 | .1218 | .1345 | .1445 |
| Std. error of mean | .00343 | .00495 | .00714 | .00920 |
| Median | .1100 | .1200 | .1300 | .1300 |
| Std. deviation | .01609 | .02322 | .03348 | .04317 |
| Skewness | 1.321 | .812 | 1.380 | 1.189 |
| Kurtosis | 2.545 | .438 | 2.055 | .792 |
| Minimum | .09 | .09 | .10 | .10 |
| Maximum | .16 | .18 | .23 | .25 |
| Kolmogorov-Smirnov Z | 1.382 | .786 | .872 | 1.045 |
| Asymp. Sig. (2-tailed) | .044 | .567 | .433 | .225 |
As shown in Table 19, the average fixation duration within the two graph AOIs (line and bar) was lower than the average fixation duration within the instructions and textbox AOIs in Task 1. The majority of the paired-sample t-tests on the AOIs showed statistically significant difference, to be specific, bar graph vs. instructions (t=-3.598, p<0.0025), bar graph vs. textbox (t=-2.970, p<0.0075), line graph vs. instructions (t=- 4.183, p<0.0005), and line graph vs. textbox (-2.944, p<0.0085). However, the difference between bar and line graph (t=-1.715, n.s.) was not significant; and the difference between instructions and textbox is at borderline of statistical significance (t=2.013, p<0.0575). In other words, the difference between the two graph AOIs was not statistically significant, neither was the difference between the two non-graph AOIs (i.e., textbox and task instructions); however, the differences between a graph AOI and a non-graph AOI were all statistically significant.
In Task 2, the graph AOIs (bar and pie chart) also had lower fixation durations than the AOIs of textbox and instructions (see Table 20). Paired-samples t-tests (df=19) indicated that the differences between the graph AOIs and instructions and textbox AOIs were statistically significant, to be specific, bar graph vs. instructions (t=-3.213, p<0.0055), bar graph vs. textbox (t=-5.107, p<0.0005), pie chart vs. instructions (t=-2.699, p<0.0145), and pie chart vs. textbox (t=-4.112, p<0.0015). The difference between the two non-graph AOIs, i.e., instructions and textbox (t=-1.365, n.s.) was not statistically significant, neither was the difference between the two graph AOIs, i.e., bar graph and pie chart (t=1.254, n.s.). This finding is the same as for Task 1 data.
| E2 piechart_Mean | E2 bargraph_Mean | E2 instructions_Mean | E2 writingmaintext_Mean | |
|---|---|---|---|---|
| Mean | .1220 | .1265 | .1395 | .1445 |
| Std. error of mean | .00395 | .00466 | .00694 | .00705 |
| Median | .1150 | .1200 | .1400 | .1400 |
| Std. deviation | .01765 | .02084 | .03103 | .03154 |
| Skewness | .812 | .171 | .345 | .254 |
| Kurtosis | -.438 | -1.147 | -.314 | -1.168 |
| Minimum | .10 | .09 | .09 | .10 |
| Maximum | .16 | .16 | .20 | .20 |
| Kolmogorov-Smirnov Z | 1.126 | .830 | .577 | .588 |
| Asymp. Sig. (2-tailed) | .159 | .495 | .893 | .880 |
Like Task 1 and Task 2 data, the graph AOI in Task 3 also had the lowest fixation duration (see Table 21). Paired-samples t-tests (df=18) indicated that the difference between the line graph and the textbox was statistically significant (t=-3.031, p<0.0075), the difference between the line graph and the instructions was at borderline of significance (t=-2.042, p<0.0565), but the difference between the instructions and the textbox was not statistically significant (t=-1.340, n.s.).
| E3 linegraph_Mean | E3 instructions_Mean | E3 writingmaintext_Mean | |
|---|---|---|---|
| Mean | .1237 | .1337 | .1389 |
| Std. error of mean | .00598 | .00681 | .00904 |
| Median | .1100 | .1300 | .1300 |
| Std. deviation | .02608 | .02967 | .03943 |
| Skewness | 1.480 | .739 | 1.005 |
| Kurtosis | 2.913 | .207 | .665 |
| Minimum | .09 | .09 | .09 |
| Maximum | .20 | .20 | .23 |
| Kolmogorov-Smirnov Z | .987 | .560 | .735 |
| Asymp. Sig. (2-tailed) | .284 | .913 | .652 |
In Task 4, the graph AOIs (the two tables) also had lower fixation duration than the AOIs of the textbox and the instructions (see Table 22). Paired-samples t-tests indicated significant differences between table 1 and the instructions (t=-2.728, p<0.0135), between table 1 and the textbox (t=-4.985, p<0.0005), and between table 2 and the textbox (t=-2.894, p<0.0095). However, the differences between table 2 and the instructions (t=-1.530, n.s.), between table 2 and table 1 (t=-.330, n.s.), between the instructions and textbox (t=-1.352, n.s.) were not statistically significant
| E4 table2_Mean | E4 table1_Mean | E4 Instructions_Mean | E4 Writingmaintext_Mean | |
|---|---|---|---|---|
| Mean | .1235 | .1255 | .1365 | .1425 |
| Std. error of mean | .00862 | .00626 | .00670 | .00876 |
| Median | .1100 | .1200 | .1350 | .1400 |
| Std. deviation | .03856 | .02800 | .02996 | .03919 |
| Skewness | 2.072 | .996 | .493 | .742 |
| Kurtosis | 5.439 | .547 | -.318 | -.088 |
| Minimum | .08 | .09 | .09 | .09 |
| Maximum | .25 | .19 | .20 | .23 |
| Kolmogorov-Smirnov Z | 1.056 | .833 | .711 | .571 |
| Asymp. Sig. (2-tailed) | .215 | .492 | .692 | .901 |
In summary, the two AOIs (instructions and textbox) had significantly higher fixation duration than the graph AOI(s) across the four tasks (see Figure 5), except for the difference between table 2 and the task instructions in Task 4. The significant differences indicated that the participants, on average, fixated longer on the non-graph AOIs than the graph AOIs. The difference in fixation duration between the graph AOIs was not statistically significant, neither was the difference between the non-graph AOIs.

Figure 5: Fixation duration of all AOIs in the four tasks
4.5.4 Total fixation duration
Total fixation duration refers to the duration of all fixations of an individual participant on an AOI. It is an important indicator of how much time a participant spends on the AOI. In Task 1, the total fixation duration on the textbox was 14 times that of the shortest AOI (i.e., E1-bargraph) and 4.6 times that of the second longest (i.e., E1- instructions), see Table 23.
In Task 2, a similar pattern was observed. The total fixation duration on the textbox was the longest of all AOIs; it was about 10 times that of the shortest AOI (i.e., E2- piechart) and 6.4 times that of the second longest (i.e., E2-bargraph), see Table 24.
In Task 3, the textbox AOI also had the longest total fixation duration; it was about 8 times that of the shortest AOI (i.e., E3-instructions) and close to 3 times that of the second longest AOI (i.e., E3-linegraph), see Table 25.
| E3 instructions | E3 linegraph | E3 writingmaintext | |
|---|---|---|---|
| Mean | 18.4337 | 54.2679 | 150.2205 |
| Std. error of mean | 3.18927 | 8.75517 | 26.64337 |
| Median | 18.4500 | 42.9000 | 130.2000 |
| Std. deviation | 13.90172 | 38.16292 | 116.13577 |
| Skewness | 1.173 | .880 | 1.218 |
| Kurtosis | 1.120 | -.057 | 1.313 |
| Minimum | 3.23 | 6.99 | 15.10 |
| Maximum | 51.37 | 137.83 | 446.44 |
| Kolmogorov-Smirnov Z | .597 | .805 | .608 |
| Asymp. Sig. (2-tailed) | .868 | .536 | .853 |
In Task 4, like the other three tasks, the textbox AOI also had the longest total fixation duration; it was about 8 times that of the shortest AOI (i.e., E4-table2) and 4.4 times that of the second longest AOI (i.e., E4-table1), see Table 26.
| E4 table2 | E4 Instructions | E4 table1 | E4 Writingmaintext | |
|---|---|---|---|---|
| Mean | 17.8145 | 26.8735 | 32.2125 | 141.2270 |
| Std. error of mean | 4.33740 | 4.57694 | 5.57225 | 22.57250 |
| Median | 10.3700 | 22.7150 | 26.1400 | 130.8350 |
| Std. deviation | 19.39745 | 20.46870 | 24.91987 | 100.94728 |
| Skewness | 1.761 | 1.112 | .977 | .605 |
| Kurtosis | 2.578 | 1.165 | .845 | -.439 |
| Minimum | .85 | 3.50 | 4.04 | 9.22 |
| Maximum | 72.50 | 80.89 | 97.28 | 334.41 |
| Kolmogorov-Smirnov Z | 1.146 | .567 | .640 | .563 |
| Asymp. Sig. (2-tailed) | .145 | .905 | .807 | .910 |
Figure 6 below shows the striking difference between the times spent on textbox and the other AOIs in the four tasks. Given that the total fixation duration varies across the four tasks, we converted the raw data of total fixation duration (in seconds) to percentages within each task to make like with like comparisons. As shown in Figure 7, the participants spent over 63-68% of their time, in terms of total fixation duration, on the main textbox, about 9-15% of their time on reading the task instructions, and about 18-26% on reading graphs. This finding is broadly in line with the working model of cognitive process (see Appendix 1), which was developed empirically from think aloud protocols in Yu et al. (2011).

Figure 6: Total fixation duration of all AOIs in the four tasks - raw data

Figure 7: Total fixation duration of all AOIs in the four tasks - percentage
In summary, as shown in Tables 23 to 26 and Figures 6 and 7, in all the four tasks, the textbox AOI had overwhelmingly higher total fixation duration than the other AOIs, which indicated that concentrating on writing in the textbox was the main cognitive process involved in the tasks. The participants had the shortest total fixation duration on the task instructions.
4.5.5 Fixation count
Fixation count refers to the number of times a participant fixates on an AOI. As shown in Tables 27 to 30 and Figure 8, the textbox had the largest number of fixations in any of the four tasks. However, it varied as to which AOI received the second largest number of fixations. In Task 1, it was the instructions (mean=170.91, see Table 27); in Task 2, the bar graph (mean=204.65, see Table 28); in Task 3, the line graph (mean=404.84, see Table 29); and in Task 4, table 1 (mean=237.20, see Table 30).
| E1 bargraph | E1 linegraph | E1 instructions | E1 writingmaintext | |
|---|---|---|---|---|
| Mean | 79.82 | 137.55 | 170.91 | 913.09 |
| Std. error of mean | 9.433 | 23.470 | 26.050 | 102.290 |
| Median | 68.50 | 110.00 | 146.50 | 927.00 |
| Std. deviation | 44.242 | 110.083 | 122.185 | 479.782 |
| Skewness | .648 | 1.694 | 1.331 | -.302 |
| Kurtosis | .095 | 2.733 | 2.135 | -.960 |
| Minimum | 3 | 26 | 25 | 40 |
| Maximum | 185 | 448 | 527 | 1590 |
| Kolmogorov-Smirnov Z | .734 | 1.024 | .629 | .580 |
| Asymp. Sig. (2-tailed) | .655 | .245 | .823 | .890 |
| E2 piechart | E2 instructions | E2 bargraph | E2 writingmaintext | |
|---|---|---|---|---|
| Mean | 131.75 | 170.35 | 204.65 | 1089.50 |
| Std. error of mean | 16.194 | 20.550 | 24.404 | 119.133 |
| Median | 116.00 | 140.00 | 155.50 | 1086.00 |
| Std. deviation | 72.420 | 91.902 | 109.136 | 532.779 |
| Skewness | .832 | .617 | .492 | .295 |
| Kurtosis | .378 | -.394 | -.893 | -.849 |
| Minimum | 37 | 33 | 43 | 252 |
| Maximum | 310 | 372 | 411 | 2096 |
| Kolmogorov-Smirnov Z | .551 | .706 | 1.020 | .466 |
| Asymp. Sig. (2-tailed) | .921 | .702 | .249 | .981 |
| E3 instructions | E3 linegraph | E3 writingmaintext | |
|---|---|---|---|
| Mean | 125.26 | 404.84 | 972.11 |
| Std. error of mean | 16.054 | 51.477 | 124.748 |
| Median | 117.00 | 377.00 | 889.00 |
| Std. deviation | 69.976 | 224.385 | 543.764 |
| Skewness | .385 | .531 | .532 |
| Kurtosis | -.626 | -.244 | -.444 |
| Minimum | 31 | 74 | 175 |
| Maximum | 258 | 894 | 2059 |
| Kolmogorov-Smirnov Z | .498 | .833 | .379 |
| Asymp. Sig. (2-tailed) | .965 | .492 | .999 |
| E4 table2 | E4 Instructions | E4 table1 | E4 Writingmaintext | |
|---|---|---|---|---|
| Mean | 124.40 | 183.75 | 237.20 | 895.80 |
| Std. error of mean | 22.825 | 27.065 | 34.282 | 111.990 |
| Median | 98.00 | 173.50 | 230.00 | 929.00 |
| Std. deviation | 102.079 | 121.040 | 153.313 | 500.835 |
| Skewness | 1.254 | 1.083 | .582 | .054 |
| Kurtosis | 1.043 | 1.582 | -.439 | -.810 |
| Minimum | 9 | 35 | 42 | 101 |
| Maximum | 390 | 518 | 559 | 1868 |
| Kolmogorov-Smirnov Z | .887 | .536 | .536 | .447 |
| Asymp. Sig. (2-tailed) | .411 | .937 | .936 | .988 |
As shown in Figure 8, the textbox AOI received overwhelmingly the largest number of fixations. Within a task (see Figure 9), around 61-67% of total number of fixations was on the textbox, 19-28% on the graphs, and 9-14% on the task instructions, which is broadly the same trend as total fixation duration (see Section 4.5.4).
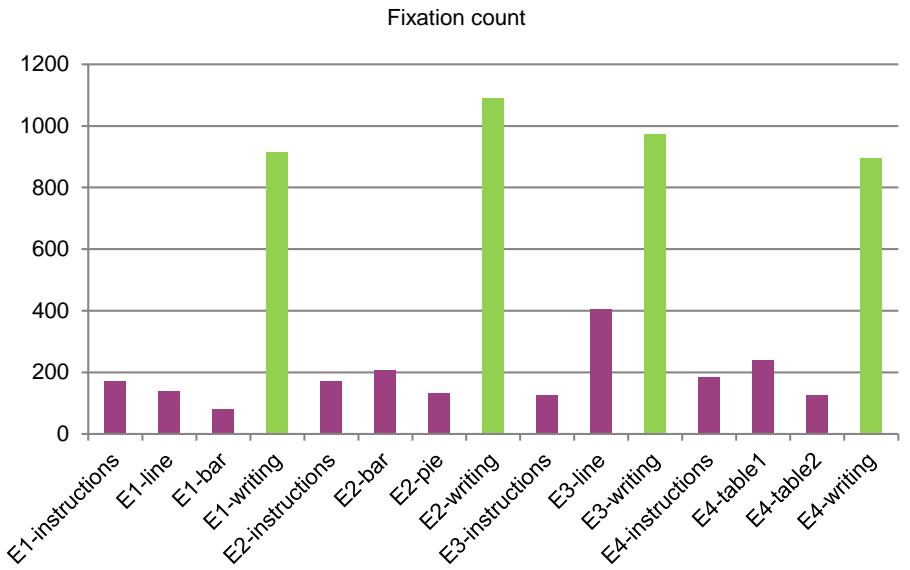
Figure 8: Fixation count of all AOIs in the four tasks - raw data

Figure 9: Fixation count of all AOIs in the four tasks - percentage
4.5.6 Visit duration
An individual visit is defined as the time interval between the first fixation on the active AOI and the end of the last fixation within the same active AOI. In other words, during a visit to an AOI, there could be one or more consecutive fixations. The visit ends when the participant has a fixation on another AOI. The data on visit duration includes the duration of fixations, plus the time to move between fixations during the visit. Visit duration refers to the mean of visit durations of a participant on a given AOI. Tables 31 to 34 report the mean of visit duration of each AOI of the four tasks. Appendices 21 to 24 provide further details on the maximum, minimum, median and standard deviation of the mean visit durations.
As shown in Tables 31 to 34, across the four tasks, the textbox had the longest visit duration. In Task 1, it was about 4 times that of the shortest AOI (i.e., E1-linegraph) and twice that of the second longest (i.e., E1-instructions), see Table 31. Pairedsamples t-tests (df=21) indicated a statistically significant difference between the bar graph and the textbox (t=-3.331, p<0.0035), the instructions and the line graph (t=4.546, p<0.0005), the instructions and the textbox (t=-3.521, p<0.0025), and the line graph and the textbox (t=-4.425, p<0.0005). The differences between the bar graph and the instructions (t=-1.301), and between bar graph and line graph (t=.820) were not statistically significant.
In Task 2, the textbox also had the longest visit duration; it was about 4 times that of the shortest AOI (i.e., E2-piechart) and twice that of the second longest AOI (i.e., E2-instructions), see Table 32. Paired-samples t-tests (df=19) indicated that the differences in visit duration between the AOIs were all statistically significant: bar vs. instructions (t=-2.978, p<0.0085), bar vs. pie (t=3.340, p<0.0035), bar vs. textbox (t=-5.733, p<0.0005), instructions vs. pie (t=8.317, p<0.0005), instructions vs. textbox (t=-4.727, p<0.0005), and pie vs. textbox (t=-6.551, p<0.0005).
| E1 linegraph_Mean | E1 bargraph_Mean | E1 instructions_Mean | E1 writingmaintext_Mean | |
|---|---|---|---|---|
| Mean | 1.3464 | 1.8027 | 2.5841 | 5.5209 |
| Std. error of mean | .22085 | .73995 | .28935 | .92611 |
| Median | 1.0050 | .9850 | 2.1600 | 4.9800 |
| Std. deviation | 1.03586 | 3.47066 | 1.35717 | 4.34385 |
| Skewness | 2.937 | 4.489 | 2.200 | 2.931 |
| Kurtosis | 10.170 | 20.648 | 4.588 | 11.125 |
| Minimum | .44 | .11 | 1.22 | 1.28 |
| Maximum | 5.29 | 17.13 | 6.62 | 22.38 |
| Kolmogorov-Smirnov Z | 1.294 | 1.845 | 1.347 | 1.040 |
| Asymp. Sig. (2-tailed) | .070 | .002 | .053 | .229 |
| E2 piechart_Mean | E2 bargraph_Mean | E2 instructions_Mean | E2 writingmaintext_Mean | |
|---|---|---|---|---|
| Mean | 1.0135 | 1.4460 | 1.8340 | 4.1460 |
| Std. error of mean | .09121 | .12225 | .08211 | .49462 |
| Median | .9700 | 1.4550 | 1.7700 | 3.5450 |
| Std. deviation | .40793 | .54670 | .36723 | 2.21199 |
| Skewness | .687 | .901 | .067 | .433 |
| Kurtosis | .872 | 1.886 | -.997 | -.920 |
| Minimum | .43 | .59 | 1.13 | 1.16 |
| Maximum | 2.06 | 2.98 | 2.47 | 8.61 |
| Kolmogorov-Smirnov Z | .532 | .615 | .686 | .691 |
| Asymp. Sig. (2-tailed) | .940 | .844 | .734 | .727 |
In Task 3, although a slightly different pattern was observed, it was still the textbox that had the longest visit duration. It was about 2.5 times that of the shortest AOI (i.e., E3-instructions) and twice that of the second longest AOI (i.e., E3-linegraph), see Table 33. Paired-samples t-tests (df=18) on visit duration indicated that the difference between the textbox and the instructions (t=4.704, p<0.0005) and between the textbox and the line graph (t=3.513, p<0.0025) were both statistically significant, but the difference between the instructions and the line graph was not significant.
In Task 4, the textbox also received the longest visit duration, which was 2.5 times that of the shortest AOI (i.e., E4-table1) and 2.3 times that of the second longest AOI (i.e., E4-instructions), see Table 34. Paired-samples t-tests (df=19) indicated that the textbox had statistically significantly longer visit duration than table1 (t=4.647, p<0.0005), table 2 (t=3.813, p<0.0015), and the instructions (t=4.186, p<0.0005), but the differences between the instructions and table 1 (t=0.751), between the instructions and table 2 (t=0.137), and between table1 and table2 (t=-0.707) were not statistically significant.
In summary, across the four tasks, the textbox had the longest visit duration: about 2 to 4 times that of the shortest AOI and twice that of the second longest (Figure 10). In all tasks but Task 3, the instructions had the second longest visit duration. The two graph AOIs in Task 1 and Task 4 were not significantly different in their visit duration. In Task 2, however, the bar graph had significantly longer visit duration than the pie chart, which could be due to the fact that the bar graph was more information dense and larger in size than the pie chart.
| E3 instructions_Mean | E3 linegraph_Mean | E3 writingmaintext_Mean | |
|---|---|---|---|
| Mean | 1.7268 | 2.1132 | 4.1732 |
| Std. error of mean | .21863 | .20873 | .69762 |
| Median | 1.3800 | 1.9300 | 3.5300 |
| Std. deviation | .95300 | .90984 | 3.04087 |
| Skewness | 1.832 | 2.648 | 1.449 |
| Kurtosis | 4.208 | 9.104 | 2.417 |
| Minimum | .72 | 1.20 | 1.11 |
| Maximum | 4.68 | 5.35 | 12.87 |
| Kolmogorov-Smirnov Z | .754 | .840 | .741 |
| Asymp. Sig. (2-tailed) | .620 | .480 | .642 |
| E4 table1_Mean | E4 table2_Mean | E4 Instructions_Mean | E4 Writingmaintext_Mean | |
|---|---|---|---|---|
| Mean | 1.8600 | 2.0010 | 2.0305 | 4.7445 |
| Std. error of mean | .20271 | .20588 | .21030 | .66426 |
| Median | 1.6850 | 1.9700 | 1.8300 | 4.4800 |
| Std. deviation | .90656 | .92071 | .94051 | 2.97066 |
| Skewness | 2.425 | .812 | .996 | 1.922 |
| Kurtosis | 7.807 | .408 | 1.472 | 5.102 |
| Minimum | .76 | .81 | .50 | 1.34 |
| Maximum | 5.04 | 4.21 | 4.38 | 14.42 |
| Kolmogorov-Smirnov Z | .869 | .576 | .575 | .911 |
| Asymp. Sig. (2-tailed) | .436 | .894 | .896 | .378 |
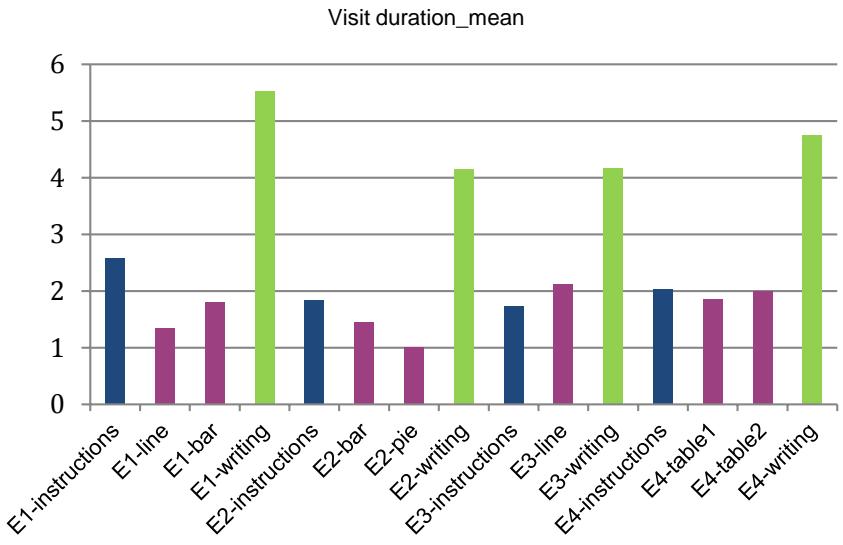
Figure 10: Visit duration of all AOIs in the four tasks
4.5.7 Total visit duration
Total visit duration refers to the duration of all visits within an AOI (in seconds). In theory, they are longer than total fixation duration, and are closer to the total time that a participant spends on an AOI. Tables 35 to 38 below report the total visit duration of each AOI within a task. As shown in Table 35, the textbox had the longest total visit duration in Task 1, followed by the instructions, which had only 12% of the total visit duration of textbox. The graph AOIs (bar and line) had the lowest total visit duration. Paired-samples t-tests (df=21) indicated that only the differences between the textbox and the other AOIs were statistically significant, to be specific, the textbox vs. bar (t=11.143, p<0.0005), the textbox vs. line graph (t=11.986, p<0.0005), and the textbox vs. instructions (t=13.139, p<0.0005). However, none of the differences between the bar graph and the line graph (t=-0.791), between the instructions and the bar graph (t=1.369), and between the instructions and the line graph (t=0.985) was statistically significant.
| E1 bargraph | E1 linegraph | E1 instructions | E1 writingmaintext | |
|---|---|---|---|---|
| Mean | 45.1577 | 54.6673 | 65.1450 | 547.4650 |
| Std. error of mean | 10.88368 | 7.65831 | 7.46911 | 38.12393 |
| Median | 30.3200 | 43.2850 | 62.2800 | 588.0600 |
| Std. deviation | 51.04901 | 35.92066 | 35.03325 | 178.81710 |
| Skewness | 3.671 | 1.214 | 1.275 | -.506 |
| Kurtosis | 15.363 | 1.809 | 2.054 | -.661 |
| Minimum | .32 | 6.20 | 15.49 | 152.85 |
| Maximum | 256.88 | 156.99 | 165.23 | 824.19 |
| Kolmogorov-Smirnov Z | 1.166 | .847 | .742 | .792 |
| Asymp. Sig. (2-tailed) | .132 | .470 | .641 | .557 |
| E2 piechart | E2 instructions | E2 bargraph | E2 writingmaintext | |
|---|---|---|---|---|
| Mean | 49.3875 | 62.1340 | 81.9760 | 550.7940 |
| Std. error of mean | 5.92583 | 6.60524 | 8.40173 | 41.92949 |
| Median | 44.6300 | 55.2200 | 84.8350 | 525.8050 |
| Std. deviation | 26.50112 | 29.53953 | 37.57366 | 187.51437 |
| Skewness | .445 | .925 | .203 | .221 |
| Kurtosis | -.339 | .135 | -.732 | -1.414 |
| Minimum | 8.55 | 27.56 | 20.80 | 299.16 |
| Maximum | 106.80 | 130.96 | 157.87 | 844.35 |
| Kolmogorov-Smirnov Z | .569 | .623 | .555 | .711 |
| Asymp. Sig. (2-tailed) | .903 | .832 | .917 | .694 |
In Task 2, the textbox also had the longest total visit duration, and the pie chart had the shortest (see Table 36). Paired-samples t-tests (df=19) indicated that the differences between any pair of the four AOIs, except the pair of instructions and pie chart (t=1.655, n.s.), were statistically significant, to be specific, textbox vs. bar graph (t=10.592, p<0.0005), textbox vs. pie chart (t=11.606, p<0.0005), textbox vs. instructions (t=11.128, p<0.0005), bar graph vs. instructions (t=2.206, p<0.0405), and bar graph vs. pie chart (t=4.536, p<0.0005).
In Task 3, the textbox also had the longest total visit duration; it was about 2.7 times that of the total visit duration of the line graph and 11 times that of the instructions (see Table 37). The difference between any pair of the three AOIs was statistically significant, to be specific, textbox vs. instructions (t=13.228, p<0.0005), textbox vs. line graph (t=8.182, p<0.0005), and instructions vs. line graph (t=-8.524, p<0.0005).
| E3 instructions | E3 linegraph | E3 writingmaintext | |
|---|---|---|---|
| Mean | 44.7958 | 182.0021 | 497.2979 |
| Std. error of mean | 4.53089 | 14.63744 | 35.75883 |
| Median | 49.6300 | 181.8300 | 497.4300 |
| Std. deviation | 19.74970 | 63.80312 | 155.86911 |
| Skewness | .605 | .521 | .419 |
| Kurtosis | -.071 | .127 | -.347 |
| Minimum | 18.44 | 93.55 | 240.39 |
| Maximum | 89.94 | 333.88 | 799.21 |
| Kolmogorov-Smirnov Z | .623 | .504 | .606 |
| Asymp. Sig. (2-tailed) | .832 | .961 | .857 |
In Task 4, the textbox again had the longest total visit duration; it was about 9 times that of the shortest total visit duration (E4-table 2), and 5 times that of the second longest total visit duration (E4-table 1), see Table 38. Paired-samples t-tests (df=19) indicated that the differences between the textbox and table 1 (t=10.891, p<0.0005), the textbox and table 2 (t=11.660, p<0.0005), the textbox and the instructions (t=12.172, p<0.0005), table 1 and table 2 (t=5.148, p<0.0005), and table 1 and the instructions (t=2.383, p<0.0285) were all statistically significant. Only the difference between the instructions and table 2 (t=1.500) was not significant.
| E4 table2 | E4 Instructions | E4 table1 | E4 Writingmaintext | |
|---|---|---|---|---|
| Mean | 54.9285 | 68.4990 | 95.1920 | 500.6870 |
| Std. error of mean | 7.96708 | 8.95484 | 9.71665 | 35.82922 |
| Median | 40.9750 | 67.5600 | 79.6900 | 464.7450 |
| Std. deviation | 35.62987 | 40.04728 | 43.45420 | 160.23312 |
| Skewness | 1.067 | 1.120 | .906 | .260 |
| Kurtosis | .351 | 1.765 | .764 | -.930 |
| Minimum | 10.59 | 19.58 | 23.54 | 222.86 |
| Maximum | 137.29 | 178.42 | 205.82 | 754.05 |
| Kolmogorov-Smirnov Z | 1.003 | .662 | .748 | .653 |
| Asymp. Sig. (2-tailed) | .267 | .774 | .631 | .787 |
In summary, the textbox had substantially longer total visit duration than the other AOIs across the four tasks (see Figures 11 and 12); and the difference between the textbox and any other AOI in a task was statistically significant. In Task 3, the difference between any two AOIs was statistically significant. In Task 2 and Task 4, only one pair of AOIs (i.e., the instructions vs. pie chart in Task 2; the instructions vs. table 2 in Task 4) did not differ significantly. In Task 1, the three pairs concerning the textbox (i.e., textbox vs. bar, textbox vs. line graph, and textbox vs. instructions) were significantly different, but the other three pairs (i.e., the instructions vs. bar, instructions vs. line graph, bar vs. line graph) were not. In total, 6-9% of total visit duration was on the instructions, about 68-75% on the textbox, and about 16-26% on the graphs.

Figure 11: Total visit duration of all AOIs in the four tasks - raw data
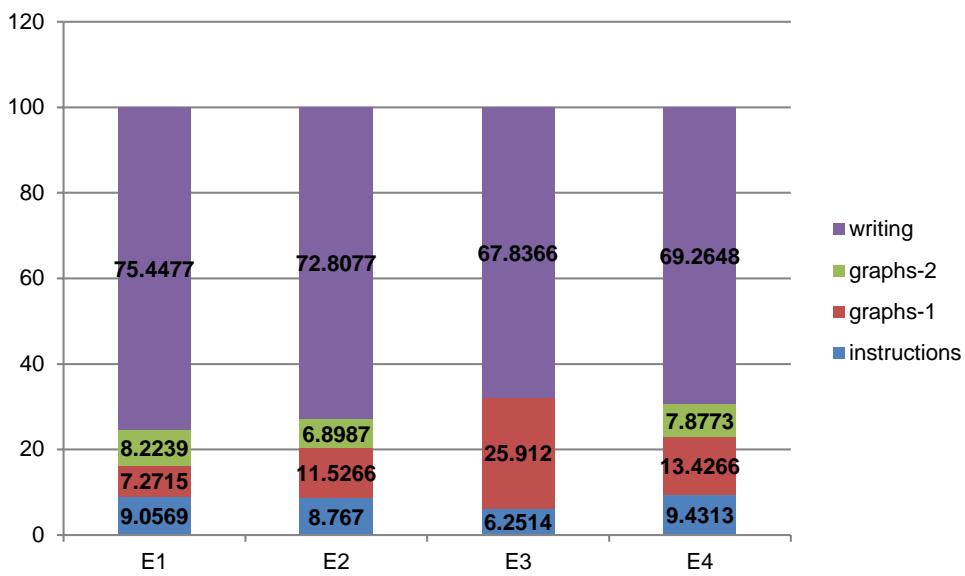
Figure 12: Total visit duration of all AOIs in the four tasks - percentage
4.5.8 Visit count
Visit count refers to the number of visits to an AOI. Tables 39 to 42 report the number of times that participants visited each AOI. As shown in Table 39, the textbox in Task 1 received the largest number of visits, which was about 3 times that of the second largest (i.e., E1-linegraph), 4 times that of the bar graph and 4.4 times that of the instructions. Paired-samples t-tests (df=21) indicated that the differences between all the pairs, but the bar and the instructions (t=0.632, n.s.), were statistically significant, to be specific, the textbox vs. instructions (t=8.584, p<0.0005), textbox vs. bar graph (t=8.522, p<0.0005), textbox vs. line graph (t=8.878, p<0.0005), line graph vs. bar graph (t=2.884, p<0.0095), line graph vs. instructions (t=3.274, p<0.0045).
| E1 instructions | E1 bargraph | E1 linegraph | E1 writingmaintext | |
|---|---|---|---|---|
| Mean | 30.05 | 32.77 | 44.18 | 132.91 |
| Std. error of mean | 4.596 | 3.426 | 5.169 | 13.597 |
| Median | 26.00 | 32.00 | 42.00 | 123.50 |
| Std. deviation | 21.555 | 16.068 | 24.246 | 63.778 |
| Skewness | 2.181 | .239 | 1.230 | .411 |
| Kurtosis | 6.801 | -.430 | 2.342 | .227 |
| Minimum | 6 | 3 | 14 | 17 |
| Maximum | 106 | 68 | 115 | 272 |
| Kolmogorov-Smirnov Z | .944 | .658 | .790 | .713 |
| Asymp. Sig. (2-tailed) | .336 | .780 | .561 | .689 |
In both Task 2 (Table 40) and Task 3 (Table 41), the textbox also had the largest number of visits, and the instructions had the smallest number of visits. In Task 2, the difference in visit count between any pair of AOIs was statistically significant, to be specific, the textbox vs. instructions (t=9.823, p<0.0005), textbox vs. bar graph (t=8.443, p<0.0005), textbox vs. pie chart (t=8.362, p<0.0005), instructions vs. bar graph (t=-7.091, p<0.0005), instructions vs. pie chart (t=-3.778, p<0.0015), and bar graph vs. pie chart (t=2.816, p<0.0115).
| E2 instructions | E2 piechart | E2 bargraph | E2 writingmaintext | |
|---|---|---|---|---|
| Mean | 34.40 | 48.05 | 58.00 | 157.75 |
| Std. error of mean | 3.495 | 4.071 | 5.429 | 14.234 |
| Median | 33.00 | 47.50 | 53.00 | 141.00 |
| Std. deviation | 15.629 | 18.208 | 24.279 | 63.655 |
| Skewness | .954 | .060 | 1.642 | .872 |
| Kurtosis | 1.169 | -1.186 | 4.578 | .147 |
| Minimum | 14 | 20 | 20 | 64 |
| Maximum | 76 | 76 | 135 | 302 |
| Kolmogorov-Smirnov Z | .600 | .499 | .825 | 1.027 |
| Asymp. Sig. (2-tailed) | .864 | .965 | .503 | .242 |
In Task 3, the differences between the textbox and the instructions (t=8.590, p<0.0005, df=18), between the textbox and the line graph (t=5.637, p<0.0005), and between the line graph and the instructions (t=8.195, p<0.0005) were all statistically significant.
| E3 instructions | E3 linegraph | E3 writingmaintext | |
|---|---|---|---|
| Mean | 31.16 | 94.89 | 163.05 |
| Std. error of mean | 3.947 | 9.282 | 17.576 |
| Median | 29.00 | 99.00 | 145.00 |
| Std. deviation | 17.206 | 40.461 | 76.614 |
| Skewness | .851 | .443 | .216 |
| Kurtosis | .967 | -.258 | -.805 |
| Minimum | 6 | 36 | 48 |
| Maximum | 75 | 182 | 308 |
| Kolmogorov-Smirnov Z | .461 | .616 | .521 |
| Asymp. Sig. (2-tailed) | .984 | .843 | .949 |
In Task 4, the textbox also received the largest number of visits. The differences between any two AOIs, except for the difference between the instructions and table 2 (t=1.571, n.s.), were all statistically significant, to be specific, the textbox vs. table 2 (t=9.220, p<0.0005), textbox vs. instructions (t=8.777, p<0.0005), textbox vs. table 1 (t=7.702, p<0.0005), table 1 vs. table 2 (t=7.042, p<0.0005), and table 1 vs. instructions (t=3.479, p<0.0035).
| E4 table2 | E4 Instructions | E4 table1 | E4 Writingmaintext | |
|---|---|---|---|---|
| Mean | 29.15 | 36.60 | 57.15 | 129.55 |
| Std. error of mean | 3.626 | 4.174 | 6.164 | 11.847 |
| Median | 25.00 | 30.00 | 51.50 | 120.50 |
| Std. deviation | 16.217 | 18.667 | 27.567 | 52.983 |
| Skewness | 1.192 | .308 | .316 | .025 |
| Kurtosis | 2.353 | -1.315 | -.982 | -.636 |
| Minimum | 4 | 11 | 15 | 29 |
| Maximum | 76 | 68 | 108 | 219 |
| Kolmogorov-Smirnov Z | .568 | .751 | .491 | .419 |
| Asymp. Sig. (2-tailed) | .904 | .626 | .969 | .995 |
In summary, the textbox received the largest number of visits across the four tasks; and the task instructions received the lowest in all tasks, apart from Task 4 where table 2 had the lowest number of visits. Visit count should be interpreted alongside visit duration (see Section 4.5.6) and total visit duration (see Section 4.5.7). Take Task 1 as an example, the task instructions received a smaller number of visits than the bar and line graphs (see Table 39), but the task instructions had a longer visit duration (see Table 31) and total visit duration (see Table 35) than the bar and line graphs.
Figures 13 and 14 present visually the visit count of all AOIs in the tasks. The task instructions received around 11-15% of visits, the textbox around 51-55%, and the graphs around 33-36%. Compared to the distributions of total fixation duration, fixation count, and total visit duration, the distributions of visit count in the three main AOIs (instructions, graphs and writing textbox) were more similar in the four tasks.

Figure 13: Visit count of all AOIs in the four tasks - raw data
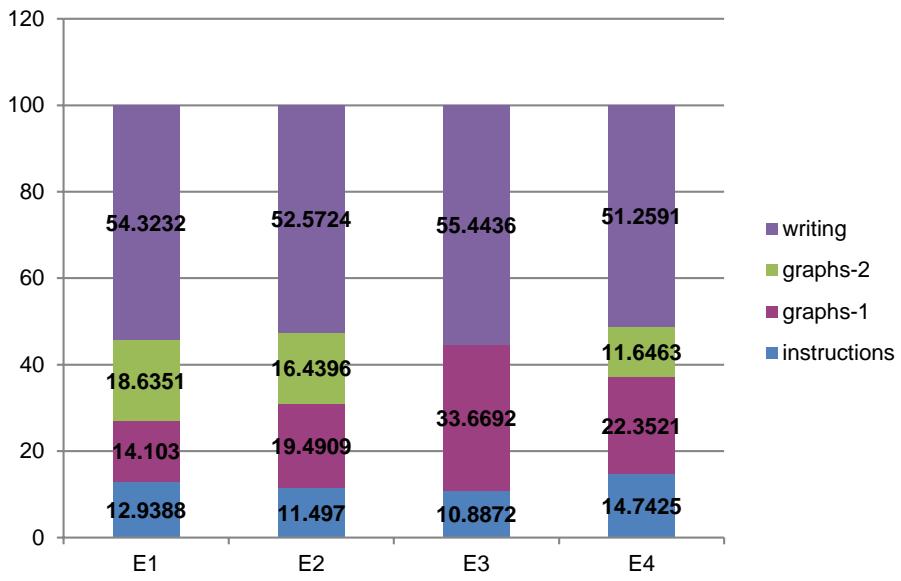
Figure 14: Visit count of all AOIs in the four tasks - percentage
4.5.9 Summary of eye-movement metrics
The eight key eye-movement metrics (namely, time to first fixation, first fixation duration, fixation duration, total fixation duration, fixation count, visit duration, total visit duration and visit count) of each AOI present some glimpses into test-takers complex cognitive processes when completing the graph-based writing tasks. Table 43 summarises the mean and standard deviation of each AOI. In Section 4.5, we have presented within-task comparisons on the AOIs. In Section 4.6, we will report between-task comparisons of eye-movements on the graph AOIs (Research Question 2).
Data on time to first fixation clearly demonstrated the participants’ reading process, at the beginning of the task, from focusing on the task instructions to the main textbox and then moving on to the graphs in Tasks 1, 2 and 4 which had two graphs as prompt. However, in Task 3, which had only one graph as a prompt, the second AOI that the participants focused on was the line graph itself, followed by the textbox for writing. It is particularly worth noting that the biggest gap in time to first fixation was between table 1 and table 2 (Task 4), which indicated that the participants had spent a longer period of time on table 1 before moving on to table 2. This finding is congruent with our finding in Yu et al. (2011) that statistics tables can present much bigger challenges than other types of graphs due to the high density and amount of information contained in the tables. It was also probably attributable to the fact that the participants were less familiar with statistical tables than any other type of graphs (see Section 4.2).
As anticipated, no statistically significant difference in first fixation duration between AOIs was observed, although the task instructions had consistently the longest first fixation duration across the four tasks. According to the data on fixation duration, the participants fixated significantly longer on the non-graph AOIs (i.e., the task instructions and the textbox for writing) than the graph AOIs. Furthermore, it was observed that the difference in fixation duration between the graph AOIs within a task was not statistically significant, neither was the difference between the non-graph AOIs. In terms of total fixation duration, it was evident that the textbox had substantially longer total fixation duration than any other AOI in a task. The participants spent over 63-68% of their time, in terms of total fixation duration, on the main textbox, about 9-15% of their time on reading the task instructions, and about 18-26% on reading the graphs. In terms of fixation count, the textbox also received the highest number of fixations, which was true across the four tasks.
Around 61-67% of total number of fixations was on the textbox, 19-28% on the graphs, and 9-14% on the task instructions, which is broadly the same trend as total fixation duration. These findings are broadly in line with the working model of cognitive process (see Appendix 1), which was developed empirically from thinkaloud protocols in Yu et al. (2011). However, there is a good range of variations in terms of which AOI had the next largest and which had the smallest total fixation duration or fixation count, across the four tasks.
The next set of metrics looked at the data of visit to an AOI - visit duration, total visit duration and visit count. The data on visit duration demonstrated that the textbox had statistically significantly longer visit duration than any other AOI in a task. It was about 2 to 4 times that of the shortest AOI and twice that of the second longest AOI, which was the task instructions in all tasks but Task 3 (line graph). In Tasks 1, 2 and 4, it was a graph that had the shortest visit duration. Furthermore, there was no significant difference in visit duration between the two graphs in Task 1 and Task 4. However, the two graphs in Task 2 were significantly different, with the bar graph having longer visit duration than the pie chart.
Data also demonstrated that the textbox had substantially longer total visit duration than any other AOI in a task. In total, 6-9% of total visit duration was on the instructions, about 16-26% on the graphs, and about 68-75% on the textbox. The textbox also received the largest number of visits (around 51-55%), with the task instructions receiving around 11-15% of total visits and the graphs around 33-36%. Across the tasks, the textbox was significantly higher than any other AOI in visit duration, total visit duration and visit count. Furthermore, the majority of the comparisons between two AOIs of a task indicated some statistically significant differences, but the magnitude of differences varied by AOIs, as well as by tasks.
The analysis of the quantitative eye-movement data presented a complex picture of the cognitive process of test-taking and the intricate relationships between the areas of interest (task instructions, graphs and textbox for writing) of a task. The eye-movement metrics, in particular, total fixation duration, fixation count, total visit duration and visit count, provided strong evidence that the main cognitive process involved in completing the IELTS AWT1 tasks was predominantly “writing” rather than comprehending task instructions or deciphering graphs. The data on first fixation duration, fixation duration, and visit duration indicated an even more complex picture of how test-takers constantly moved their attention between reading task instructions and graphs and key-boarding their writing in the textbox. To some extent, the data on first fixation duration, fixation duration and visit duration also demonstrated the span of test-takers’ attention, and the difficulty and challenges that test-takers might have faced when dealing with a particular AOI. The differences in test-takers’ eye-movement between AOIs of a task demonstrated that test-takers’ cognitive processes might have varied due to a number of factors, such as the number of graphs in a task, the relative importance and position of a graph in a task, and the relationship between a graph and task instructions.
| Time to first fixation | First fixation duration | Fixation duration_mean | Total fixation duration | Fixation count | Visit duration_ mean | Total visit duration | Visit count | ||
|---|---|---|---|---|---|---|---|---|---|
| E1-instruct | Mean | 4.9136 | .1377 | .1445 | 28.5377 | 170.91 | 2.5841 | 65.1450 | 30.05 |
| E1-instruct | Std. dev. | 6.11427 | .07874 | .04317 | 28.22023 | 122.185 | 1.35717 | 35.03325 | 21.555 |
| E1-line | Mean | 12.5032 | .1100 | .1218 | 18.3227 | 137.55 | 1.3464 | 54.6673 | 44.18 |
| E1-line | Std. dev. | 16.45139 | .07085 | .02322 | 17.89748 | 110.083 | 1.03586 | 35.92066 | 24.246 |
| E1-bar | Mean | 45.0950 | .1350 | .1127 | 9.0309 | 79.82 | 1.8027 | 45.1577 | 32.77 |
| E1-bar | Std. dev. | 56.29471 | .08584 | .01609 | 5.16576 | 44.242 | 3.47066 | 51.04901 | 16.068 |
| E1-writing | Mean | 14.5418 | .1291 | .1345 | 130.0873 | 913.09 | 5.5209 | 547.4650 | 132.91 |
| E1-writing | Std. dev. | 28.91910 | .07131 | .03348 | 79.34547 | 479.782 | 4.34385 | 178.81710 | 63.778 |
| E2-instruct | Mean | 4.7865 | .1315 | .1395 | 25.0980 | 170.35 | 1.8340 | 62.1340 | 34.40 |
| E2-instruct | Std. dev. | 6.37778 | .05509 | .03103 | 16.27490 | 91.902 | .36723 | 29.53953 | 15.629 |
| E2-bar | Mean | 10.1410 | .1165 | .1265 | 26.7270 | 204.65 | 1.4460 | 81.9760 | 58.00 |
| E2-bar | Std. dev. | 10.63191 | .06293 | .02084 | 16.07973 | 109.136 | .54670 | 37.57366 | 24.279 |
| E2-pie | Mean | 15.0985 | .1305 | .1220 | 16.6185 | 131.75 | 1.0135 | 49.3875 | 48.05 |
| E2-pie | Std. dev. | 14.79789 | .10410 | .01765 | 10.50060 | 72.420 | .40793 | 26.50112 | 18.208 |
| E2-writing | Mean | 10.0310 | .1280 | .1445 | 167.5285 | 1089.50 | 4.1460 | 550.7940 | 157.75 |
| E2-writing | Std. dev. | 18.78486 | .05944 | .03154 | 104.02610 | 532.779 | 2.21199 | 187.51437 | 63.655 |
| E3-instruct | Mean | 3.2016 | .1421 | .1337 | 18.4337 | 125.26 | 1.7268 | 44.7958 | 31.16 |
| E3-instruct | Std. dev. | 4.45391 | .09372 | .02967 | 13.90172 | 69.976 | .95300 | 19.74970 | 17.206 |
| E3-line | Mean | 6.7242 | .1026 | .1237 | 54.2679 | 404.84 | 2.1132 | 182.0021 | 94.89 |
| E3-line | Std. dev. | 11.86324 | .05300 | .02608 | 38.16292 | 224.385 | .90984 | 63.80312 | 40.461 |
| E3-writing | Mean | 15.5000 | .1226 | .1389 | 150.2205 | 972.11 | 4.1732 | 497.2979 | 163.05 |
| E3-writing | Std. dev. | 29.96209 | .07673 | .03943 | 116.13577 | 543.764 | 3.04087 | 155.86911 | 76.614 |
| E4-instruct | Mean | 3.7640 | .1755 | .1365 | 26.8735 | 183.75 | 2.0305 | 68.4990 | 36.60 |
| E4-instruct | Std. dev. | 5.45308 | .15538 | .02996 | 20.46870 | 121.040 | .94051 | 40.04728 | 18.667 |
| E4-table1 | Mean | 22.7160 | .1055 | .1255 | 32.2125 | 237.20 | 1.8600 | 95.1920 | 57.15 |
| E4-table1 | Std. dev. | 21.62973 | .05125 | .02800 | 24.91987 | 153.313 | .90656 | 43.45420 | 27.567 |
| E4-table2 | Mean | 117.3310 | .1095 | .1235 | 17.8145 | 124.40 | 2.0010 | 54.9285 | 29.15 |
| E4-table2 | Std. dev. | 218.58099 | .05186 | .03856 | 19.39745 | 102.079 | .92071 | 35.62987 | 16.217 |
| E4-writing | Mean | 13.5080 | .1190 | .1425 | 141.2270 | 895.80 | 4.7445 | 500.6870 | 129.55 |
| E4-writing | Std. dev. | 28.20644 | .05098 | .03919 | 100.94728 | 500.835 | 2.97066 | 160.23312 | 52.983 |
Table 43: A summary table of eight eye-movement metrics
4.5.10 Qualitative analysis of eye-movements
In addition to the eight eye-movement metrics reported above, the visualisations of eye-movements offer another equally important window to understand the participants’ cognitive processes of test-taking. As a part of performing the basic qualitative analysis of the recorded eye-movements, the first author watched the animated videos of each participant’s complete eye-movements, in accumulated gazeplot and heatmap modes, several times (see Section 3.4). Then the first author focused on watching a few segments of each video: the first minute, the first 2 minutes, and the last 2 minutes, in sequence. The visualisations of the eye-movements (fixations, visits and saccades) confirmed not only the extreme complexity of each participant’s eye-movements in different tasks, but also the dynamics and the uniqueness of their eye-movements at different stages of the tasks, on different AOIs in a task, and on different components of an AOI. Due to space restrictions, we are not able to include all the visualisations in this report. Readers can view the visualisations of all 81 recordings of eye-movements (20 minutes each), in accumulated gazeplot and heatmap, at http://1drv.ms/1colamo. These visualisations are presented at about 1/3 of the original screen size.
RQ2: To what extent are there differences in test-takers’ cognitive processes due to different features of AWT1 graph prompts?
4.6.1 Eye-movement metrics
In response to RQ1 - an overarching research question on test-takers’ cognitive process - we have reported the differences in eye-movement between different graphs within a task (see Table 43 for an overview of the eye-movement metrics). In other words, we have addressed RQ2 partially. Further analysis7 was conducted to examine differences between the tasks to get a full picture of how different features of graphs affected test-takers’ cognitive process. It would be desirable to run paired-samples t-tests to compare test-takers’ eye-movements; however, due to the small sample size, we ran a series of one-sample t-tests on each eye-movement metric, using the mean of one of the seven graphs as the “test value”8. For each eye-movement metric, we ran 36 one-sample t-tests (e.g., E1-bar is compared with E2-bar, E2-pie, E3-line, E4-table1, and E4-table2)9. As the comparisons are symmetric (e.g., E1-bar vs. E2-bar, E2-bar vs. E1-bar), the comparisons reported in the following tables should also be read symmetrically.
As shown in Table 44, the majority of the comparisons in first fixation duration showed no statistically significant difference between graphs. Only five pairs of comparisons showed significant difference. The significant differences mainly lie in the comparisons that used E1- bar and E2-pie as “test value”. E1-bar had significantly longer first fixation duration than E3- line, E4-table1 and E4-table2; and E2-pie was significantly longer than E3-line and E4-table1. E1-bar and E2-pie were at a similar level of first fixation duration.
Table 44: One-sample t-tests of first fixation duration of all graphic AOIs
| Test value | E1 bar | E1 line | E2 bar | E2 pie | E3 line | E4 table1 | E4 table2 |
|---|---|---|---|---|---|---|---|
| E1-bar | — | x | -1.315 | -.193 | -2.662p<.0165 | -2.574p<.0195 | -2.199p<.0405 |
| E1-line | X | — | .462 | .881 | -.606 | -.393 | -.043 |
| E2-bar | 1.011 | -.430 | — | x | -1.141 | -.960 | -.604 |
| E2-pie | .246 | -1.357 | x | — | -2.292p<.0345 | -2.182p<.0425 | -1.811 |
| E3-line | 1.770 | .490 | .988 | 1.199 | — | .253 | .595 |
| E4-table1 | 1.612 | .298 | .782 | 1.074 | -.236 | — | x |
| E4-table2 | 1.393 | .033 | .497 | .902 | -.565 | x | — |
-
As “time to first fixation” can be influenced mainly by the position of a graph (i.e., where a graph is placed) in the task, rather than the type or the features of the graph, we decided to exclude “time to first fixation” in the analysis of the effects of graph features on cognitive process.
-
Due to the use of different “test value” in the analysis, the t-values in the onesample t-tests on two graphs (e.g., E2-bar vs. E1-line, E1-line vs. E2- bar in Table 44) can be different in size and direction (plus vs. minus).
-
One-sample t-test was not conducted on the two graphs within a task, because pairedsample t-tests would be more appropriate, which are reported in Section 4.5 already. They are indicated as X in the tables in Section 4.6.
Although E1-bar had the longest first fixation duration as shown in Table 44, it had the shortest average fixation duration, and the difference between E1-bar and any other graph was statistically significant across the four tasks (see the second column of Table 45). When E1-bar was entered as the test-value in the one-sample t-tests (see row #2 in Table 45), it was found that E1-bar was significantly shorter than E2-bar and E2-pie.
In total fixation duration, 27 out of 36 comparisons showed significant difference between graphs (see Table 46). E1-bar was significantly shorter than any other graph; and E3-line was significantly longer than any other graph. The difference between E3-line and E1-bar was particularly prominent.
Table 45: One-sample t-tests of fixation duration of all graphic AOIs
| Test value | E1 bar | E1 line | E2 bar | E2 pie | E3 line | E4 table1 | E4 table2 |
|---|---|---|---|---|---|---|---|
| E1-bar | — | x | 2.961p<.0085 | 2.356p<.029 | 1.836 | 2.044 | 1.252 |
| E1-line | X | — | 1.008 | .051 | .315 | .591 | .197 |
| E2-bar | -4.015p<.0015 | -.946 | — | x | -.471 | -.160 | -.348 |
| E2-pie | -2.703p<.0135 | -.037 | x | — | .282 | .559 | .174 |
| E3-line | -3.199p<.0045 | -.380 | .601 | -.431 | — | .288 | -.023 |
| E4-table1 | -3.723p<.0015 | -.744 | .215 | -.887 | -.303 | — | x |
| E4-table2 | -3.140p<.0055 | -.340 | .644 | -.380 | .031 | x | — |
Table 46: One-sample t-tests of total fixation duration of all graphic AOIs
| Test value | E1 bar | E1 line | E2 bar | E2 pie | E3 line | E4 table1 | E4 table2 |
|---|---|---|---|---|---|---|---|
| E1-bar | — | x | 4.922p<.0005 | 3.232p<.0045 | 5.167p<.0005 | 4.160p<.0015 | 2.025 |
| E1-line | x | — | 2.337p<.0315 | -.726 | 4.106p<.0015 | 2.493p<.0225 | -.117 |
| E2-bar | -16.068p<.0005 | -2.203p<.0395 | — | x | 3.146p<.0065 | .984 | -2.055p<.0545 |
| E2-pie | -6.889p<.0005 | .447 | x | — | 4.300p<.0005 | 2.799p<.0115 | .276 |
| E3-line | -41.074p<.0005 | -9.420p<.0005 | -7.660p<.0005 | -16.035p<.0005 | — | -3.958p<.0015 | -8.404p<.0005 |
| E4-table1 | -21.048p<.0005 | -3.640p<.0025 | -1.526 | -6.641p<.0005 | 2.519p<.0215 | — | x |
| E4-table2 | -7.975p<.0005 | .133 | 2.479p<.0235 | -.509 | 4.164p<.0015 | x | — |
In fixation count, E3-line received significantly more fixations than any other graph (see the sixth row of Table 47). E1-bar received significantly fewer fixations than any other graph when the “test value” was the fixation count of the other graphs (see the second column of Table 47). When E1-bar itself was used as the “test value” in the one-sample t-tests, it was found that E1-bar was significantly lower than any other graph but E4-table2 (see the second row of Table 47). In addition, E1-line was significantly lower than E2-bar and E4-table1; E2-bar was significantly higher than E1-line and E4-table2; and E4-table1 was significantly lower than E3-line, but a lot higher than E1-bar, E1-line and E2-pie. Overall, 27 out of the 36 comparisons showed significant difference (see Table 47), which is a strong evidence of the potential impact of the type of graph on the number of fixations that a graph might receive.
Table 47: One-sample t-tests of fixation count of all graphic AOIs
| Test value | E1 bar | E1 line | E2 bar | E2 pie | E3 line | E4 table1 | E4 table2 |
|---|---|---|---|---|---|---|---|
| E1-bar | — | x | 5.115p<.0005 | 3.207p<.0055 | 6.314p<.0005 | 4.591p<.0005 | 1.953 |
| E1-line | x | — | 2.750p<.0135 | -.358 | 5.192p<.0005 | 2.907p<.0095 | -.576 |
| E2-bar | -13.234p<.0005 | -2.859p<.0095 | — | X | 3.889p<.0015 | .949 | -3.516p<.0025 |
| E2-pie | -5.506p<.0005 | .247 | x | — | 5.305p<.0005 | 3.076p<.0065 | -.322 |
| E3-line | -34.458p<.0005 | -11.389p<.0005 | -8.203p<.0005 | -16.864p<.0005 | — | -4.890p<.0005 | -12.286p<.0005 |
| E4-table1 | -16.685p<.0005 | -4.246p<.0005 | -1.334 | -6.512p<.0005 | 3.257p<.0045 | — | x |
| E4-table2 | -4.726p<.0005 | .560 | 3.288p<.0045 | .454 | 5.448p<.0005 | x | — |
In visit duration, 21 out of 36 pairs of comparisons showed significant difference between the graphs (Table 48). It was found that E1-line, E2-bar and E2-pie all had significantly shorter visit duration than E3-line, E4-table1 and E4-table2. In addition, E1-bar had significantly longer visit duration than E2-bar and E2-pie; and E1-line longer than E2-pie.
Table 48: One-sample t-tests of visit duration of all graphic AOIs
| Test value | E1 bar | E1 line | E2 bar | E2 pie | E3 line | E4 table1 | E4 table2 |
|---|---|---|---|---|---|---|---|
| E1-bar | — | x | -2.918p<.0095 | -8.652p<.0005 | 1.487 | .283 | .963 |
| E1-line | x | — | .815 | -3.650p<.0025 | 3.673p<.0025 | 2.534p<.0205 | 3.180p<.0055 |
| E2-bar | .482 | -.451 | — | X | 3.196p<.0055 | 2.042p<.0555 | 2.696p<.0145 |
| E2-pie | 1.067 | 1.507 | x | — | 5.268p<0.0005 | 4.176p<0.0015 | 4.797p<0.0005 |
| E3-line | -.420 | -3.472p<.0025 | -5.458p<.0005 | -12.056p<.0005 | — | -1.249 | -.545 |
| E4-table1 | -.077 | -2.326p<.0305 | -3.387p<.0035 | -9.280p<.0005 | 1.213 | — | x |
| E4-table2 | -.268 | -2.964p<.0075 | -4.540p<.0005 | -10.826p<.0005 | 537 | x | — |
In terms of total visit duration (Table 49), the most notable was that E3-line was significantly longer than any other graph. Except for E3-line and E4-table1, E2-bar was significantly longer than any other graph (i.e., E1-bar, E1-line, and E4-table2). And conversely, except for E3-line and E2-bar, E4-table1 was significantly longer than any other graph (i.e., E1-bar, E1-line, and E2-pie).
Table 49: One-sample t-tests of total visit duration of all graphic AOIs
| Test value | E1 bar | E1 line | E2 bar | E2 pie | E3 line | E4 table1 | E4 table2 |
|---|---|---|---|---|---|---|---|
| E1-bar | — | x | 4.382p<.0005 | 0.714 | 9.349p<.0005 | 5.149p<.0005 | 1.226 |
| E1-line | X | — | 3.250p<.0045 | -.891 | 8.699p<.0005 | 4.171p<.0015 | .033 |
| E2-bar | -3.383p<.0035 | -3.566p<.0025 | — | x | 6.834p<.0005 | 1.360 | -3.395p<.0035 |
| E2-pie | -.389 | .689 | x | — | 9.060p<.0005 | 4.714p<.0005 | .695 |
| E3-line | -12.573p<.0005 | -16.627p<.0005 | -11.905p<.0005 | -22.379p<.0005 | — | -8.934p<.0005 | -15.950p<.0005 |
| E4-table1 | -4.597p<.0005 | -5.292p<.0005 | -1.573 | -7.730p<.0005 | 5.931p<.0005 | — | x |
| E4-table2 | -.898 | -.034 | 3.219p<.0055 | -.935 | 8.681p<.0005 | x | — |
Finally, in terms of visit count, 29 out of 36 comparisons showed significant differences between graphs of different tasks. E3-line received consistently higher visits than any other graph. E1-bar and E4-table2 had similar level of visit count and they both received significantly lower visits than any other graph.
Table 50: One-sample t-tests of visit count of all graphic AOIs
| Test value | E1 bar | E1 line | E2 bar | E2 pie | E3 line | E4 table1 | E4 table2 |
|---|---|---|---|---|---|---|---|
| E1-bar | — | x | 4.647p<.0005 | 3.753p<.0015 | 6.693p<.0005 | 3.955p<.0015 | -.998 |
| E1-line | X | — | 2.546p<.0205 | .951 | 5.464p<.0005 | 2.104p<.0495 | -4.145p<.0015 |
| E2-bar | -7.364p<.0005 | -2.673p<.0145 | — | x | 3.975p<.0015 | -.138 | -7.956p<.0005 |
| E2-pie | -4.460p<.0005 | -.748 | x | — | 5.047p<.0005 | 1.476 | -5.212p<.0005 |
| E3-line | -18.133p<.0005 | -9.810p<.0005 | -6.795p<.0005 | -11.505p<.0005 | — | -6.123p<.0005 | -18.130p<.0005 |
| E4-table1 | -7.116p<.0005 | -2.509p<.0205 | .157 | -2.235p<.0385 | 4.066p<.0015 | — | x |
| E4-table2 | 1.058 | 2.908p<.0085 | 5.314p<.0005 | 4.642p<.0005 | 7.083p<.0005 | x | — |
In summary, the majority of the comparisons on each eye-movement metric (see Tables 44 to 50), except first fixation duration and fixation duration, demonstrated significant differences between graphs of different tasks. The differences between graphs were more prominent in the metrics that report aggregated data of fixations (i.e., total fixation duration, fixation count, visit duration, total visit duration, and visit count) than the metrics that report a single activity of eye-movement (i.e., first fixation duration) or an average of single activities of eye-movement (i.e., fixation duration). This finding suggests that overall there was little difference in single fixations on a graph between the participants and between graphs; however, in a prolonged period of time (20 minutes in this research), the differences between graphs and between participants were accumulated to such an extent that they became statistically significant.
4.6.2 Stimulated recall interviews and focus-group discussions
The eye-movement data clearly evidenced the differential impacts of graphs, both within a task (see Section 4.5) and between tasks, on the participants’ test-taking process in terms of total fixation duration, fixation count, visit duration, total visit duration and visit count in the 20-minute IELTS AWT1 tasks. In this section, we report the qualitative analysis of the supplementary data - stimulated retrospective interviews and student-led focus group discussions - which can shed further light, from the students’ perspectives, on the impacts of different graphs on test-taking process and performance.
Overall, the supplementary data demonstrated findings similar to Yu et al. (2011). The data showed the students had knowledge about the “cognitive naturalness” (Zacks & Tversky, 1999) and perceptual properties of different types of graphs which influenced the students preference towards a certain type of graph, as well as their judgement about the difficulty in processing the graphs during the test. Although “cognitive naturalness” was not the term that the students used in the interviews or focus-group discussions, it is evident that the students understood the “cognitive naturalness” of graphs and graph comprehension as defined in Zacks and Tversky (1999). The type of a graph indicates what kind of information is normally included in the graph, and also determines how the students would process such information and how they would present their understandings in their writings (see also Section 4.7.2 on the students’ views on the extent of the impacts of their graph familiarity on their test-taking process and performance).
The comments made by Participant #10 present a nice summary of the views of the majority of the students with regard to the “cognitive naturalness” of graphs and graph comprehension.
Depending on the type of graphs - line graph, pie chart, bar graph or statistical table - I used different methods. For line graph, my writing would show the trends, I would definitely say what the trends looked like, what differences there were in the trends of different lines. For bar graph, I would say which one has this amount and which one has that amount and compare them. For pie chart, I would say which is the largest and which is the smallest and what their respective percentage is. However, I would not include every single detail in my writing, but I would have to say the most apparent and the most important.
(这要看图表类型,要看类型,不同的,折线图,饼状图,柱状图还有表格是不同的情况用不同的方法…如果是折线图,我会体现一个趋势,就是我肯定会说这个趋势怎么样子,然后它不同的类型不同的趋势是什么样子。然后是柱状图的话我就会有多有少,然后比较最多的最少的,然后一个情况,饼状图的话就可以也是最多最少的一个比例,一个情况,但不会什么都写到,就是把最突出的,很明显的一些信息会肯定要说出来) - Participant #10
Almost all students thought the line graph, pie chart, and bar graph were easier than the statistical tables, although it varied between the participants as to which of the three types (pie chart, bar graph or line graph) was the easiest. The main reason for this judgement was that the key messages of these types of graphs were more readily visible and useable than the information in statistical tables. For example, Participant #1 eloquently presented the differences in processing different types of graphs.
I would like to talk about the use of different types of graphs from two perspectives. From the perspectives of the test or the test provider, the use of different types of graphs can make the test fairer and can better measure test-takers’ ability. However, from my own, or test-taker’s perspectives, as everyone’s ability in graph comprehension is different and has different level of familiarity or adaptability in reading graphs, I think my performance would be affected by the different types of graphs. I was really confused when I read the statistical tables, because each cell in a table, whether in a row or in a column, represents an equal position in the table. Unlike statistical tables, however, line graph reports trends, pie chart represents proportions or percentages, bar chart shows which is higher or lower; in other words, these types of graphs have at least one thing that can attract your attention, and can make you feel you have something to say, especially the overall understanding of the key information or the main message of the graphs. However, when reading statistical tables, you would have to find the trends by yourself from a large amount of information from the tables, but you were not sure which trend is more important. Is it the trend based on the year, or the region? You had to find the information and work it out all by yourself. That being said, I would still accept the use of different types of graphs in the test, as at least it can help improve my graph comprehension ability.
(我的话这个问题我就是说从两个角度来看吧。从雅思本身这个考试来说我觉得它多元化了是会让这个考试更加公平的,而且也会真正的考察出一个考生的水平…。从这点上来说,这个多元化的图形从雅思本身来考虑的话是很好的嘛。然后但是从个人来讲,每个人读图的能力,就是对不同种图的适应性是有差别的,就是仅仅对我来说,就是我对这种table来说就是特别混乱,就我觉得它横过来纵过来,因为它每一个表格你都占了一个相同的位置,然后你像折线图它会体现一个趋势,圆饼图会体现比例,或者柱状图你能看出它高高低低,所以你总会总会有一个点会让你,就是吸引你更多的注意力,让你想去表达一下,就是总体上先概括一下的感觉。但是你到了这个表格图你就会发现你横过来纵过来每一个图都是一般大,然后而且你要自己去找趋势,你又不知道哪个趋势是重要的,到底是横着的它是年份下来是重要的还是地区下来是重要的还是怎么样是重要的,这些你都要自己去分析,那你分析出很多的信息量,但你又不知道哪个是最重要的。所以我觉着给我不同的图的话对我的考试会产生一定的影响,但是我觉得就是说如果从增长自身能力的角度上去说的话,我也愿意去接受它各种各样的图,这样起码会增强我的一个读图能力) - Participant #1
Participant #1 further summarised his views as below:
I can talk about the line graph and the pie chart, but the statistical tables have such a large amount of information to process that I found I was in a situation that I didn’t know what to write about the tables.
(像那个折线图啊,圆饼图啊,我觉得相对来说还会表达一下,然后像那种表格的题目,然后就觉得这一个表格的信息量太大了,然后都不知道自己要讲什么) - Participant #1
Other participants expressed similar views. For example:
I feel the pie chart is the easiest because it directly and clearly presents the amount of information and the percentage; line graph is ok, but it is more difficult to express the information in your own words.
(我就觉得饼图是最好一点的,因为它最能够直接反映信息量的。…饼图…就是一目了然,百分之多少是很清晰的。所以我觉得饼图应该是相对最容易一点的。折线图也还好一点,折线图就是怎么说呢,折线图就是不太好表达) - Participant #2
However, I don’t think there is much difference between a pie chart and a line graph, as long as you are able to find the key message of the graphs…The most important thing is to know a kind of template on how to write, a template that you can use in different situations
(但是我认为对于一个饼状图或者是一个折线图的话只要把关键的点掌握,我觉得都是大同小异的, …. 我觉得最主要是要掌握一个写作的套路吧,都可以用上) - Participant #5
Pie chart is the most straightforward, and line graph is also clear, showing trends; they are ok to describe in your own words. However, although it is not that difficult to identify the overall trends from bar graph, it is more challenging to describe them. Overall, I feel I had a lot to say about the graphs, but it is hard to convert them into words.
(饼状图最直观,折线图比较清楚有趋势,可以描述,然后柱状图的话也能大致的看出趋势,就是要描述的更复杂一点,然后,就觉得自己在做作文的时候就是能讲的很多,但是就很难转化过来) - Participant #6
I think that line graph is the easiest as it shows trends; the trends are easily visible from the graph and also easy to understand. The bar graph, it has several bars, therefore, you have a number of factors to consider. The last one, the statistical tables, is difficult. You have to summarise the information from the tables by yourself, as one glance at the tables won’t tell you much.
(我觉得最浅显易懂的就是折线,它就是有一个趋势,可以看出来,然后它总的线,有几条线,然后总线就可以明显看到哪条线造成的原因,从图上可以看到。如果第一个bar它也说明一些问题,就是可能它因素比较多,就是有很多bar,然后就是最后一个,就数字那个,不好,… 第一眼去看的话不清楚它在讲什么,要自己总结) - Participant #7
I also think line graph is the easiest, as it is easy to identify the trends from the graph, the easiest. (我也觉得折线最简单,就是趋势比较好找,最简单) - Participant #8
Pie chart is the one that I like the least, because there is little information in the pie chart, which means there is little room of flexibility for you to write about. It is like this part takes up certain percent and that one takes up certain percent, that’s it. You don’t have much to write about.
(我最不喜欢的就是那个饼状图了,因为饼状图就信息很简单,然后你描述的东西可能发挥的空间就很少了,你掌握的东西,因为它只有百分之多少,百分之多少,就没有,写的东西不多). - Participant #9
Anyhow, I was delighted to see line graph, because the trends are so obvious, moving up and down. In fact, we see a lot of line graphs in news every day.
(反正我看折线就超开心,因为它的趋势非常的明显,上下,对吧,这个我估计不是考试,就是平常我们看一些新闻它会有这种图表) - Participant #10
I think this one was easier to describe, because it is a line graph. Bar graph is also easy. There was another line graph in our tasks with clear trends, so I felt it was quite easy as you can describe the trends…I don’t like those line graphs with big ups and downs, because often you find it quite perplexing as to whether or not your writing should include those zig-zagging changes that happened in the middle of the trend.
(我觉得这个题目在我做过的三个题目中感觉是比较容易去描述的一个题目。因为它的线,一个是柱状图,是比较简单的。另外一个折线图我记得它的趋势也是比较明确的,所以在描述的时候感觉会比较方便,你可以直接说它是两个上涨的趋势这样子。…我是比较讨厌那种涨落特别大的曲线,就是一个曲线你可以简单的先看出它的趋势是往上但是它中间会有一些曲折,然后这些曲折我有时候就会纠结到底要不要去描述它) - Participant #14
I think statistical tables are the most difficult and pie chart is the easiest. When I described line graph and bar graph, I compared the trends in the different years.
(对我来说就是表格题是最难的,然后饼状图是最简单的。然后我描述折线图和柱状图都比较,因为它年份比较多,所以就比较是用趋势性来描述) - Participant #17
I think pie chart is the easiest to write about because it is somewhat fixed, there is no fluctuation. It only shows the largest and the smallest values, or which one has the large percentage or the smallest percentage. It is easy to describe…However, I feel line graphs can be also difficult to describe, if there are a lot of ups and downs in the trend or the trend is not so regular, or there are a number of lines or trends in the single graph. In a graph with multiple lines, you have to analyse and identify the relationships between the lines, which can involve a large amount of information.
(就我觉得所有图里面饼状图是最容易写的,因为它没有变化,它是多少就是多少。而且饼状图它都会有一个最大值最小值,就所占的比例最大或者最小,比如说有几个是差不多类似的,就很容易把它讲清楚…但是我觉得如果像那种折线图,如果它有波动的话,或者说它有一部分上升,然后中间下降,然后又上升,就这样子,就这样子上升的话也很难描述…然后它有些下降是比较明显,然后有些是有小下降,就如果里面它变化很大的话其实也很难描述。或者是它是一个完全不规律的折线的话它也不太好写….它那个折线图是有四条,还是五条,就是你要通过分析折线图,还要找到他们之间的关系…我就觉得这种的话,它不是一个折线,是好多条折线,就,而且它那个关系是一个是总的折线,下面是单列的几个各个原因的折线,就他们之间的关系要分析,然后每条线之间的对比也要分析,这样信息量也挺大的) -
Participant #19
I think most of the graphs are pretty clear. I can see the key messages of the graphs, and what we are required to write about. The key messages are very clear. I like pie chart or bar graph, but I don’t like statistical tables…I spent a lot of time reading the statistical tables. Overall, I think the line graphs present the trends very clearly and you also intend to describe the trend, but you would not be concerned about the exact number.
(我觉得那个图表是非常直观,大部分图表都是非常直观的能够看出它想要给我们什么东西,或者他想让我们写出什么东西,这都非常明白的清楚的把信息反馈给我,至少从我这方面是这样子的,然后我个人觉得我个人是会比较喜欢图形类的,比如说那个饼状图或者柱状图,但个人就不太喜欢表类,就是填数字或者是直线的那种,就不是很喜欢…我当时做那个就花了特别多的时间…我觉得线状给我的感觉就是趋势特别明显,然后你就会倾向于去把那个趋势描写出来,但不会去注重那个量的具体多少) - Participant #22
I use bar graph and line graph more often than other types of graphs, so I felt I quite like bar and line graphs when I saw them in the tasks; however, it was a different story when I saw the statistical tables, I felt my head would explode, there was so much data to be processed and summarised to identify the relationships between different data points within a limited period of time; and you have to express what you’ve understood in a limited number of words. So, I was very scared. I was rather in favour of those graphs that directly show the trends…I like line graph in particular…Pie chart is also easy to write, because the information in pie chart is pretty clear, but you feel there is not much information that you can write about pie chart…When I finished writing about the statistical tables within 20 minutes, I felt I did it very badly because I couldn’t present a coherent piece of writing and a coherent conclusion.
(我平时接触的柱状图和那种趋势性的图比较多,所以看到第一眼的话就对这种题目有一种,就是有好感一点,像那种,就是雅思托福成绩的表格的话,当时就有点头大的感觉,因为感觉数据量好多,然后有限的时间内要总结那么多数据之间的关系,还要用有限的字数去表达,去最好的表达这个图的意思的话,首先心理方面就特别害怕它,所以从个人来说还是更倾向于那种能直观表达趋势的图….我比较喜欢折线图…这个饼状图来说就是更好写一点,就是更直观一点,但是感觉就是字数很少,一般就是一两个标准,就是占多少…信息量比较少….但是我看到这雅思托福题(referring to statistical tables) 的时候,就是20分钟写完了嘛,我写得,感觉自己写的好差…因为自己后来都很难圆自己说的) - Participant #24
Line graph is the easiest…It is easy to describe trends. Pie chart, compared to bar graph and line graph, is more difficult to describe, as it is always about this is a certain percentage and that is another percentage. It is difficult to use a variety of sentence structures. It is monotonous if you can only say this is a certain percentage and that is another percentage…Overall, I think tasks with two graphs were more challenging. (折线最简单,…就是带有趋势的会比较好描述…我觉得饼最难,就是相对于其他,就是柱状图 ,折线和饼的话我觉得饼最难…我觉得它比较难描述,就它就比较难描述一个趋势,它就是 什么是百分之多少,什么是百分之多少,然后我们句式转化的话就会比较困难,只能说这是 百分多少,这是百分多少,但就是这样写会比较单调… 我觉得就是两个图的比较难一点) - Participant #25
The key messages in the line graph and the pie chart are pretty straightforward, but there is a huge amount of information in the statistical tables. It is very likely that our writings would look pretty similar in the tasks using line graph and pie chart because we would find similar information from these types of graphs. However, from statistical tables, we may find different information and, therefore, our writings could be different.
(前面两种像折线图和饼状图就是信息是比较直接的,但是像第三种就是一个表格的形式,有很多的数字有很多的国家,很多的信息,它信息量非常的大,前面两种的话,就是大家写起来,可能找到的信息都是比较类似的,然后雷同的,但是第三种就是我们可能会找到不一样的信息。大家,可能大家写出来的内容就会有不同的差别) - Participant #27
I agree with [Participant #22] that the perceptual properties of graphs are more visible than statistical tables; and tables contain more information. Personally, I like graphs with less information. If there is a lot of information, you have to compare and decide what to include in your writing and what to drop. It is a quite challenging task to describe the key messages, and at the same time briefly mention some information of minor importance, in 150 words within 20 minutes…I am in favour of line graph…It is easier to know the key message of line graphs. As I said earlier, you can write about the beginning and the end of the trend, and then some points in the middle, rather than every single point of the trend. By doing this, it is more likely you will meet the task requirement. (我比较赞同
(Participant#22)说的,表格的东西会比那个,图的东西要比表格里面填数字的要直观的多,然后我个人是比较青睐就是少一点的,只要陈述它的现象,因为比较的话信息量比较多的话就会涉及到一个取舍的问题,就是比如说这么多个信息怎么样在20分钟150个单词可以把重点筛选出来,然后把次要的点就顺带提一下,我觉得这个是比较棘手的问题…我是比较倾向于那种线状图….我觉得线状图的话它重点比较好抓住嘛,就刚才说的那个,要抓住哪个数据点,就只要把它的开头和最后那个点说清楚,然后中间的话就可以直接描述它的趋势,不可能每一个点,因为它中间有无限多个点,不可能把每个点都说一遍,你只要把它的比如上升,下降或者波动的趋势描述出来,这个就比较容易达到题目的要求) - Participant #28
You have to identify the most important information from tables by yourself; however, you can easily see such information in line graph and bar graph.
(表格更加需要挑重点,就是像这种折线,柱状一看就能看出来,表格还要自己去发现) -Participant #29
I found the line graph the most pleasing. (我也觉得看折线图是最爽的) - Participant #30
I also think line graph is the most obvious…and statistical tables the most difficult…if there is a lot of information in the graphs, you have to choose, have to find the most important, it takes time to make choices…After all, you have only 150 words to write. If you have something to write about, you have to include the most important in your writing, therefore, I think the statistical tables, which contain such a volume of information, are more difficult…For line graph and bar graph, however, you don’t have to decide which is the most important; all you need to do is to describe them all in your writing.
(我也这么觉得,就是折线图最明显了,…表格应该是最麻烦了…如果小作文它给的信息量比较大的话就是要做选择,然后要做重点,然后这方面的思考就比较困难一点。所以在写作的时候就会花时间多一点…它总共就是给150个字啊,就是如果你有东西好写,你肯定要挑重点,就表格那么多信息你不可能全部写出来,就,所以我觉得还是比较麻烦…我是觉得如果是那种折线柱状的话你不需要去挑什么重点,你就把所有的都描述一下就好了) - Participant #31
I like the graphs from which you can see the changes, e.g., the line graphs that have obvious moving up or down, or pie chart that compares the amount. However, you had to work out the information from statistical tables by yourself. It might be ok if the most important information is obvious to note, however, if there is a lot of information in the tables, it can be pretty annoying.
(我个人是比较喜欢那种就是看得出变化的那种图,就比如说那种折线图,就会很明显有上升下降的趋势,饼图就是有多少的对比嘛?就是都会有。但是像那种表格的话就没有对比,就是要自己找。就是如果它明显点就还好如果是多数据的话就会比较烦) - Participant #32
The extra step in having to work out the key messages from the statistical tables became burdensome, as most students claimed. Several participants also reported how they attempted to convert the information from the statistical tables to other types of graphs, and how it might help to reduce the time that they had to spend in reading the statistical tables if the tables were converted to other types of graphs. For example:
This reminded me how I did the task. I read the task, the statistical tables which have numbers and years. I drew a graph, with each country as a point, they go up and down. By linking the points I drew, I was able to see the trends more visually. It is pretty difficult to stare at the numbers in the statistical tables.
(这样让我想起来,原来…我做,就是在看文章,就是在看那些表格图,它有数字嘛,年份什Z7—ETT+FHπTTT上升下降,然后每一个再连起来,这样可以更直观的看到这是怎么一个趋势啊,怎样的….而不是就是盯着那个数字看我就觉得比较难,尤其是表格的) - Participant #5
It would have reduced the time to read the graphs, if the statistical tables had been converted to bar graphs or similar ones.
(读图时间肯定会减少,如果把表格换成柱状图之类的) - Participant #6
I hate statistical tables. Line graph, pie chart or bar graph has an apparent trend, or you can see the lowest and highest values, you can identify them from the graphs easily and very quickly as they are visually directly presented to you already. However, you have to analyse the statistical tables by yourself; I am not good at numbers, therefore, I spent a long period of time reading the tables before I started to write. I had to analyse the TOEFL scores, identify which is the highest and which is the lowest. The challenge was that I couldn’t draw anything on paper or make notes on the tables directly because the test was computer-based, so I had to go back to the tables again and again to find the key
information from the tables while I was writing. Therefore, I think statistical tables are more difficult than bar and line graphs.
(最讨厌就是图表题了,因为图表题,表格题不像之前的那种折线图或者饼状图或者柱状图一样,它有一个明显的趋势,而且可以明显的看到最低点最高点,可以看得很快,基本上很直观的反应给你了,而这个表格题是需要自己进行分析的,而且我对数字还不是特别的敏感,所以我前期在表格上面花费的时间非常的长。我就要首先对托福的分数进行一个分析,哪个最高哪个最低要清楚,重要的是我们这个考试不是在纸上,而是在电脑上,所以我没办法做草稿或者画圈圈,以至于我在后期写字的过程中要不断地返回到表格中去找我之前觉得要写到的几个关键点数据。所以我个人觉得表格题相对于那个柱状体和折线图,要难一点) -
Participant #10
When writing about the statistical tables, I had to convert, in my mind, the information from tables to a line graph. Only by doing this, I can avoid ending up with writing about one thing here a little bit and another thing there a little bit, which would make the writing look very unorganised or messy.
(其实相当于说我脑子里头要把这个表转换成一个类似于折线图这样的一个状况。这样我思路才能比较清晰,不至于说这里一点点,那里一点点,会显得很散乱) - Participant #10
If the statistical tables were converted to bar graph, I think the task would become easier, as you can see the high and the low values and find the differences between them.
(我觉得会比较简单,因为你这样通过柱状的高低我就可以之间看出不同) - Participant #17
If the tables were converted to a bar graph, it would definitely take a lot less time to read the graph (读图的时间肯定会减少) - Participant #18
In addition to the type and perceptual properties of graphs, and the amount of information contained in different types of graphs (e.g., statistical tables vs. pie chart), some students also considered specifically the number of graphs (one vs. two) as a major task feature that can make the tasks easier or more challenging for them. The views are opposing to each other. For some students, the use of two graphs would make the task easier because there is more information to write about; however, for others, the use of two graphs would make the task more challenging because they would have to work out the relationships between the two graphs. Similarly, for some students, the use of one graph would make the task easier because of the simple message of the graph; while for others, they would find the task particularly challenging because there was little information for them to write about and, in Participant #26’s words, they had to “dig deeper” to find more information.
To me, two graphs in a task would be more helpful than one graph as there would be more information to write about so that you can write enough number of words to meet the task requirement.
(对于我来说的话一个话题有一个图相对来于两个图表的,两个图表的比较容易一点,因为可能能写的信息量更大一点,因为字数也可以,可能能达到那个要求) - Participant #5
If there is little information in the graph, you won’t have much to write about…However, overall, the graphs are pretty easy to read. No matter what type of graph it is, you can work out what it means if you do it carefully.
(信息量少的话就没什么东西写…图表其实挺容易看的,不管哪种,其实仔细看都能分析出来)
- Participant #6
I think you have a lot more to say if there are two graphs in the task
(我觉得两幅图有更多的话可以说) - Participant #8
I think the more graphs there are, the easier to write. If there is one graph only, there is not much information you can write about. (我觉得图越多,写起来越方便… 然后就会觉
得图比较少的话会没什么东西写) - Participant #18
I feel you can have more to say if the task uses more than one graph. If there is only one graph, you feel there is not enough information to write about, so you have to dig deeper to find out more.
(我觉得两幅图有更多的话可以说…就一幅图的话就觉得写了还不够,就要想然后就要挖掘)
- Participant #26
However, unlike the participants above (#5, #6, #8, #18, #26), Participant #20 considered one-graph tasks easier than two-graph tasks.
Task with one graph was easier than those with two graphs, because the one-graph task was all about trends…Furthermore, you had to find the relationships between the two graphs; therefore, it took time to consider such relationships…I am used to doing onegraph tasks, it is already easy to write the required number of words; however, if you have two graphs, you have to decide which information to keep and which to drop, this process is very important. From test-taking perspective, it is definitely easier to write about one graph than two graphs, because you can use the template more easily; while for twograph tasks, it is pretty difficult to use the template…I think it is easier to write about pie chart than line graph, because pie chart contains less information
(单个图比多个图要简单,因为单个图好像都是趋势型的….然后那个双图的话,他不是要你找两个图之间的关联点,那个还是要多想一会.…因为以前有习惯,就是一张图做多了,基本上写着写着就到那个字数了,你如果要两张图都考虑,要150个字左右,你肯定要删减掉很多信息嘛。这个取舍很重要。我觉得从应试角度上说一张图肯定是更容易应试,对,就更容易套上去,两张图的话…对,就很难驾驭…还有一个描述,就是饼状图,更好写一点,就看题目类型,我觉得相对于线状图,要用语言描述出来还更简单一些…这个怎么说,就是它的信息量比较少) - Participant #20
RQ3: To what extent are test-takers’ cognitive processes affected by their graphicacy?
4.7.1 Eye-movement metrics
The questionnaire data (see Section 4.2) demonstrated that, overall, the participants had a high level of graphicacy, but they were most familiar with pie charts and least familiar with statistical tables. However, the differences in their familiarity with different types of graphs were not statistically significant. The questionnaire data also indicated some complicated relationships between graphicacy and IELTS AWT1 test performance, from test-takers perspectives (see Section 4.2). We also reported the correlations between the participants’ graphicacy and their actual test performance (Section 4.4). As reported in Table 10, no significant correlations between graphicacy and test results were observed. Furthermore, no significant correlation was identified between the participants’ familiarity with a specific type of graph and their performance in a task that used the types of graphs in question.
Below, we report the extent to which the seven eye-movement metrics of each AOI in a writing task are related to the students’ graphicacy. As presented in Table 51, there were only two significant correlations among the 105 correlations (15 AOIx 7 eye-movement metrics). To be specific, there is no significant correlation between graphicacy and any of the seven eye-movement metrics of “instructions” AOI. The only two significant correlations are between first fixation duration and E2-bar and E3-writing. The significant and negative correlations showed that, the higher a student’s graphicacy, the shorter his first fixation duration on E2 bar and E3-writing. Overall, we can argue that the participants’ graphicacy did not affect their eye-movement, except for first fixation duration which might be affected negatively by their graphicacy. However, this could be purely by chance that there were two significant correlations out of more than 100 correlations.
Table 51: Correlations between graphicacy and eye-movement metrics of all AOIs
| First fixation duration | Fixation duration_ mean | Total fixation duration | Fixation count | Visit duration_ mean | Total visit duration | Visit count | |
|---|---|---|---|---|---|---|---|
| E1-instruct | -.284 | -.247 | -.107 | -.025 | .233 | -.020 | -.043 |
| E1-line | .067 | -.343 | -.232 | -.158 | .179 | -.080 | .025 |
| E1-bar | .120 | -.098 | -.098 | -.091 | .339 | .295 | -.004 |
| E1-writing | .068 | -.199 | -.230 | -.130 | -.087 | -.248 | .046 |
| E2-instruct | -.011 | -.121 | .049 | .182 | -.161 | .172 | .236 |
| E2-bar | -.474* | -.192 | .168 | .240 | -.178 | .147 | .333 |
| E2-pie | -.374 | -.046 | .010 | .015 | -.066 | .018 | .040 |
| E2-writing | -.150 | -.137 | -.027 | .076 | -.297 | -.111 | .317 |
| E3-instruct | .031 | .217 | .220 | .246 | .066 | .292 | .097 |
| E3-line | .299 | .087 | .150 | .170 | .329 | .244 | .039 |
| E3-writing | -.553* | .107 | .088 | .086 | .158 | .119 | -.116 |
| E4-instruct | .139 | -.219 | -.151 | -.082 | -.200 | -.028 | .022 |
| E4-table1 | .108 | -.312 | -.156 | -.081 | -.320 | -.046 | .150 |
| E4-table2 | .015 | .092 | -.026 | -.065 | -.399 | -.122 | .157 |
| E4-writing | -.121 | -.291 | -.207 | -.091 | .088 | -.066 | .125 |
*Correlation is significant at the 0.05 level (2-tailed).
4.7.2 Stimulated recall interviews and focus-group discussions
Students were asked to comment on the potential relationships between their graph familiarity and test-taking process. These comments should be read in conjunction with the extracts reported in Sections 4.6.2 (effects of graphs) and 4.8.3 (effects of writing ability). Unlike their strong opinions on the effects of types of graphs, their views on the effects of graph familiarity seem to be mild or neutral. A number of students thought their graphicacy would have no or minor effects on their test-taking, as Participant #19, #18, #24, #26 commented:
I don’t think our graphicacy will have a big influence on our performance; rather I think it is the difficulty level of the graphs that are more important. For example, if the line graph had only one line, or the bar graph had a very clear trend, or the statistics in the tables were not complex, I think, we would be able to talk about them clearly. However, even if you are very familiar with one type of graph, but the graph you read is full of complex information, you will find it difficult to write about the graph…
(其实我觉得影响不是特别大,主要是看那个图表难不难… 如果它, 图比如说,像折线图,就一条线,然后柱状图它的趋势很明显,或者说是那个表格里面的数据它不是特别的复杂的话,我觉得其实都能够讲清楚。但是就算是你对一种类型的图表很熟悉,但是它如果里面变化非常大的话也很难说清楚) - Participant #19
Although we may prefer one specific kind of graph, our writings are dependent more on the methods we’ve learned on how to write than on our preference. After all, the key information we extract from the graphs is more or less the same.
(我觉得虽然说我们好像会倾向于哪种类型,但是在写出来的结果上,你掌握的方法会比较重要,就是每个图你能得到的信息是差不多的) - Participant #18
You would feel better if you are familiar with the graph you read, and more willing to express what you have learned from the graph. However, I don’t think it would be unfair even if you are reading an unfamiliar graph. After all, these graphs are all common.
(碰到熟悉的肯定比碰到陌生的,首先从心里这关肯定会稍微好一点,更乐意去表现里面的东西,碰到一个不熟悉的,我感觉也没有什么说不公平,这些东西,因为这些东西首先是大众化的东西) - Participant #24
I don’t think graph familiarity will necessarily help you to achieve better performance. Sometimes, you can’t express all the information, and sometimes you feel you know the graphs very well, but you may not write to the point, you may write just a heap of nonsense.
(TE,ERTEEHX1ERRI1E ) - Participant #26
Even for those who thought graph familiarity did affect their test-taking, they thought such effects were perhaps not that strong, particularly because they were familiar with the graphs anyway. And, these effects may be just at the psychological level, for example, their confidence, at the beginning of the test when they first saw the graphs. Some students also elaborated on how graph familiarity may entail topic familiarity and determine what vocabulary they can use in their writing. In this sense, it is more to do with their language ability than graph familiarity that would affect their test-taking process and performance (see also Section 4.8.3).
In my degree study, I use line graph more often than other types of graphs. As I use line graphs more often, I find it more straightforward to read line graphs; I would found it more difficult to summarise other types of graphs.
(就像我专业上就是,可能比较多的就是那种折线图…,就不太会有其他的这种形式,因为我觉得折线图对我来说,因为我用的比较多嘛,就对我来说我会觉得它比较直观,然后当它换成别的其他类型的时候,归纳起来就会觉得比较困难) - Participant #1
I found it easier to extract the main message of the graphs that I am more familiar with. ( ) - Participant #17
To me, the effects of graph familiarity would be related to my vocabulary choice in writing. I would know more words about the graph if I have read similar literature, which means that I would have more words to choose from. It would be a bit awkward if you have to use the same word again that you have already used in the previous sentence; however, if you are familiar with the graph, you have a large vocabulary size; you won’t have to repeatedly use that word.
(对我来说熟悉的影响就是可用的词汇量选择会多,如果你看过相关方面的文献的话,然后就可替换的词比较,有时候就是一句,下面的话讲比较相近的内容,再用同一个词我就会感觉有点别扭,如果有自己熟悉的,词汇量大就会替换一下) - Participant #20
I think the more familiar you are with graphs; the more you can write about them. In other words, you would have more knowledge to write about the graphs.
(我觉得越熟悉,你可能写的东西多了,就是你的想法比较多) - Participant #22
If you are familiar with the graph, you would be more confident, you would be able to write more smoothly. However, if you are not familiar, you would find it difficult to start… Furthermore, because of the time pressure, you would start to write more quickly if you are more familiar with the graph; and you would become nervous and anxious if you are less familiar.
(因为如果熟悉度比较高的话,自己发挥起来自信也比较有,然后把握也比较有,就是写起来会比较流畅。但如果不是很熟悉的话下手就比较难…而且还有一点就是考试的时候时间是很紧张,如果你熟悉度好的话就下手比较快嘛,就不太会受到时间的影响,如果不太熟悉的话感觉就会比较着急) - Participant #27
I think that graph familiarity will have some effects. For example, we have been talking about line graph, bar graph, statistical tables and pie chart. If, however, we are asked to write about sequence of events, or a diagram of events, or a map, which we haven’t practised, we will think the graphs we have been talking about are easier. This is a kind of effects of graph familiarity.
(我觉得大方向上还是会有影响的。就比方说我们刚才一直在说的这部分,就是折线柱状,表格,饼图这些,那如果我平时练的那种,像流程图啊,那种布局图啊,地图啊,练的不是很多,那有可能拿到的时候就会觉得原来那种比较好写。就这个也算是一个熟悉程度) -
Participant #29
I also think there are some minor effects of graph familiarity. We are familiar with line graph and pie chart, in other words, you know how to read such graphs and what they represent; however, you would have to think carefully what a diagram describing a sequence of events is all about. I think there are some minor differences between reading the familiar and the unfamiliar graphs.
(我也觉得还是稍微可能还是有点影响的。就我其实觉得大家现在对那种折线图饼状图都挺熟悉的,就你看到的时候你就已经知道你是怎么来读这个图了,它代表的是什么意思,但如果是不大熟悉的,像刚才那种流程图什么的,你看到图的时候你还是要思考一下,就是这张图大概是描述了什么意思,你是怎么来看它的,就是我觉得稍微还是有点区别的) -
Participant #31
I think graph familiarity does affect. I am not so familiar with graphs. For example, I am not familiar with even common graphs like line graph. It took me a long time to figure out what the graph was about and what was the most important message. I had to spend quite a long time to achieve that, so I was slower than other people.
(我觉得有影响。我就属于那种不太会看图的,就像什么折线图,就是普通的那种图,我也不太熟悉的,会不知道,就是我要看很久我才会知道它是想要讲什么或者它突出的点在哪里?
我要看很久才会发现那种信息,所以我觉得我可能做起来就是看那个图的时候会比别人慢一些吧) - Participant #32
RQ4: To what extent are test-takers’ cognitive processes related to their English writing abilities?
4.8.1 Eye-movement metrics
We ran 105 correlational analyses to identify if there was any significant relationship between the participants’ English writing ability and their eye-movements. As shown in Table 52, no significant correlation was noted, which means that the participants’ English writing ability (as measured by the argumentative essay, i.e., IELTS Task 2, see also Table 5) did not seem to directly influence the length of time the participants spent and the number of fixations and visits they made on different areas of interest in the four tasks.
Table 52: Correlations between writing ability (T2) and eye-movement metrics of all AOIs
| First fixation duration | Fixation duration | Total fixation duration | Fixation count | Visit duration | Total visit duration | Visit count | |
|---|---|---|---|---|---|---|---|
| E1-instruct | .060 | .076 | .055 | .126 | -.058 | .217 | .015 |
| E1-line | .282 | .058 | .029 | .046 | -.064 | .035 | .032 |
| E1-bar | -.039 | .115 | .166 | .128 | -.122 | -.094 | .121 |
| E1-writing | -.275 | -.122 | .098 | .165 | .045 | .272 | -.065 |
| E2-instruct | -.286 | .078 | .087 | .115 | .130 | .054 | -.061 |
| E2-bar | .208 | -.113 | .198 | .275 | .213 | .313 | .126 |
| E2-pie | -.085 | -.045 | .251 | .311 | .077 | .243 | .269 |
| E2-writing | -.048 | -.014 | .063 | .111 | .228 | .156 | -.096 |
| E3-instruct | .154 | .072 | .161 | .251 | -.027 | .237 | .043 |
| E3-line | -.279 | -.032 | .136 | .216 | -.169 | .213 | .281 |
| E3-writing | .000 | -.004 | .000 | .094 | -.004 | .106 | -.062 |
| E4-instruct | .231 | .097 | .281 | .272 | -.099 | .227 | .175 |
| E4-table1 | -.272 | -.058 | -.035 | -.006 | -.178 | -.084 | .169 |
| E4-table2 | .086 | -.098 | .153 | .258 | .108 | .350 | .392 |
| E4-writing | -.230 | .011 | .077 | .171 | -.007 | .301 | .049 |
*Correlation is significant at the 0.05 level (2-tailed).
We ran another set of 105 correlational analysis (see Table 53), using T1 (IELTS Academic Writing Task 1 that the participants did on paper) data. Again, we noted the majority of the correlations were not statistically significant. There were only four significant correlations: E2- instructions with first fixation duration (r=-.476), E2-bar with visit duration (r=.540), E2-bar with total visit duration (r=.493), and E3-line with total visit duration (r=.504). The increase in the number of significant correlations was anticipated because the analyses in Table 52 used T2, which did not directly measure the participants’ performance in graph-based tasks, while the analyses in Table 53 used T1 which was a graph-based task like E1, E2, E3 and E4. However, it should be noted that the correlation between T1 and T2 was reasonably high (r=.651, p.<.0005, see Table 8). It is also interesting to note that the majority of the correlations in first fixation duration and fixation duration were negative (one was statistically significant), which means that the higher a participant’s T1 test score, the shorter his first fixation duration and the average of the duration of all fixations (i.e., fixation duration) on an AOI.
In terms of the aggregated eye-movement data (i.e., total fixation duration, fixation count, visit duration, total visit duration and visit count), there were more positive (n=56) than negative (n=19) correlations, which means it is likely that the higher a participant’s English writing ability as measured by T1, the more engaged he was with the task in the sense of longer time and larger number of visits on a specific AOI. Three of these correlations were reasonably high and reached significance level. Specifically, they indicated that the higher a participant’s English writing ability as measured by T1 task, the longer his visit duration and total visit duration on E2-bar, and the longer his total visit duration on E3-line.
Table 53: Correlations between writing ability (T1) and eye-movement metrics of all AOIs
| First fixation duration | Fixation duration | Total fixation duration | Fixation count | Visit duration | Total visit duration | Visit count | |
|---|---|---|---|---|---|---|---|
| E1-instruct | -.084 | -.179 | -.049 | .043 | -.014 | .209 | .155 |
| E1-line | .343 | -.107 | .153 | .178 | .189 | .249 | .093 |
| E1-bar | -.393 | -.053 | .294 | .360 | .131 | .249 | .387 |
| E1-writing | -.387 | -.291 | -.041 | .098 | .089 | .175 | -.232 |
| E2-instruct | -.476* | -.202 | -.127 | -.062 | .100 | .007 | -.071 |
| E2-bar | .283 | -.328 | .222 | .312 | .540* | .493* | .141 |
| E2-pie | -.353 | -.365 | .197 | .303 | .165 | .341 | .331 |
| E2-writing | -.072 | -.287 | -.161 | -.095 | .363 | .044 | -.398 |
| E3-instruct | .233 | .003 | .145 | .211 | -.157 | .274 | .248 |
| E3-line | -.273 | -.090 | .180 | .278 | .082 | .504* | .342 |
| E3-writing | .034 | -.086 | -.089 | -.054 | .048 | .049 | -.184 |
| E4-instruct | .117 | -.216 | .156 | .225 | -.042 | .220 | .114 |
| E4-table1 | -.277 | -.238 | -.017 | .035 | .119 | .115 | .069 |
| E4-table2 | -.102 | -.060 | .139 | .198 | .139 | .315 | .243 |
| E4-writing | -.442 | -.185 | -.095 | -.018 | .257 | .072 | -.267 |
*Correlation is significant at the 0.05 level (2-tailed).
However, because T1 test score was still a kind of proxy of the participants’ actual performance in E1, E2, E3 and E4 tasks, and also because T1 had significant correlations only with E3 and E4 performance (see Table 8), it is important that we also analyse the relationships between eye-movement data and the participants’ actual test performance in E1, E2, E3 and E4 tasks separately. We conducted further 105 correlational analyses to understand the relationships between the eye-movement data and E1 test scores for E1 task, E2 test score for E2 task, E3 test score for E3 task and E4 test score for E4 task.
As shown in Table 54, there were seven statistically significant correlations, an increase from the analyses using T1 test score, as anticipated. These seven significant correlations were: E1-instructions with first fixation duration (r=-.474) and with fixation duration (r=-.452), E1-line with fixation duration (r=-.438), E1-writing with fixation duration (r=-.528), E2-instructions with total visit duration (r=-.450), E3-line with total visit duration (r=.506), and E3-line with visit count (r=.527). Similar to Table 53, there were a lot more negative correlations between test score and first fixation duration and fixation duration; and four of them were reasonably high and statistically significant. All the four significant correlations were in E1 task. The higher a participant’s test score in E1, the shorter his first fixation duration on E1-instructions; and the higher a participant’s test score in E1, the shorter his fixation duration on E1-instructions, E1- line and E1-writing.
In terms of the aggregated eye-movement data, just over half of the correlations (38 out of 75) were negative, which was quite different from the analyses using T1 test score that showed only 19 out 75 correlations were negative (see Table 53). Of all these 75 correlations, only three were statistically significant, one negative and two positive. To be specific, the higher a participant’s test score in E2, the shorter his total visit duration on E2-instructions; and the higher a participant’s test score in E3, the longer his total visit duration and the larger his visit count on E3-line.
Table 54: Correlations between writing ability (E1, E2, E3 and E4) and eye-movement metrics of all AOIs
| First fixation duration | Fixation duration | Total fixation duration | Fixation count | Visit duration | Total visit duration | Visit count | |
|---|---|---|---|---|---|---|---|
| E1-instruct | -.474* | -.452* | -.405 | -.319 | -.131 | -.366 | -.198 |
| E1-line | -.083 | -.438* | .040 | .154 | .131 | .234 | .209 |
| E1-bar | -.199 | .095 | .394 | .374 | .117 | .233 | .344 |
| E1-writing | -.186 | -.528* | -.371 | -.160 | -.118 | -.248 | .246 |
| E2-instruct | -.272 | -.236 | -.352 | -.412 | -.152 | -.450* | -.300 |
| E2-bar | .168 | -.290 | .121 | .166 | .255 | .179 | .074 |
| E2-pie | -.049 | -.245 | .099 | .135 | .126 | .066 | .100 |
| E2-writing | .052 | -.186 | -.276 | -.259 | -.023 | -.215 | .114 |
| E3-instruct | .114 | -.214 | -.122 | -.092 | -.364 | -.260 | .040 |
| E3-line | -.149 | -.244 | .062 | .247 | -.079 | .506* | .527* |
| E3-writing | .222 | -.195 | -.245 | -.151 | -.270 | -.249 | .136 |
| E4-instruct | -.280 | -.139 | -.182 | -.190 | -.341 | -.381 | -.314 |
| E4-table1 | -.114 | -.181 | -.030 | .068 | -.159 | .049 | .230 |
| E4-table2 | .046 | -.100 | -.006 | .100 | -.250 | .164 | .435 |
| E4-writing | -.317 | -.248 | -.099 | .024 | .060 | .063 | -.025 |
*Correlation is significant at the 0.05 level (2-tailed).
In summary, we conducted three sets of 105 correlational analyses (see Tables 52 to 54) between the seven eye-movement metrics and T2, T1 and E1/E2/E3/E4 test scores respectively. Overall, it was found that T2 had no significant correlation with any of the eye-movement metrics, T1 had four significant correlations, and E1/E2/E3/E4 had seven. This slight increase in the number of significant correlations was anticipated because T2 measured the participants’ ability in writing an argumentative essay, T1 measured their graph-based writing ability, and only E1/E2/E3/E4 test score was the participants’ actual performance in the task concerned.
The vast majority of the correlations were not significant, which indicates that the participants’ English writing ability (or actual performance in the four tasks) did not seem to have a direct impact on (or relationship with) how the participants dealt with the graphs, the task instructions and the main textbox, in terms of their fixations and visits on an AOI. However, it should be noted that the correlations between the participants’ English writing ability (or actual performance in the four tasks) and the two metrics which measure duration of single fixations (i.e., first fixation duration) and the average duration of single fixations (i.e., fixation duration) seemed to be consistent across the board (see Tables 53 and 54).
Almost all of these correlations were negative, with five of them statistically significant (one in Table 53 and four in Table 54), which means that the higher a participant’s English writing ability or test score, the shorter his first fixation duration and the average of fixation durations.
It should also be noted that the four significant correlations in Table 54 were all with E1 task, including its three AOIs: instructions, one graph and textbox. Furthermore, as presented in Table 54, E2-instruction was negatively and significantly correlated with E2-test score, in total visit duration, which means that the high performers spent less time than low performers in reading the task instructions. E3-line was positively and significantly correlated with E3-test score, in both total visit duration and visit count, which means that the high performers spent more time and made more visits on the line graph in E3.
Overall, this rather inconclusive, but dynamic picture suggests that whether a participant’s English writing ability is significantly related to his eye-movement is dependent upon at least four factors: the construct of English writing ability, the task features, the AOI of the task, and the metric of eye-movement data. Further qualitative comparisons of the eye-movements of high performers and low performers are equally valuable to shed light on the relationships between writing ability and eye-movement. We report below the findings from the qualitative analyses on the eye-movement of top and low performers in the first two minutes of the four tasks.
4.8.2 Eye-movement: Qualitative analysis of a few examples of top and poor performance
As an example, the following visualisations of the first two minutes of the tasks illustrate the dynamics and uniqueness of eye-movements of the participants who achieved the highest score and those who achieved the lowest score. Participant #8 (Figure 15) and Participant #13 (Figure 16), the only two students who achieved the highest band score 7 in Task 1, both focused predominantly on reading the instructions and graphs than writing their responses in the main textbox; and both focused more on the bar graph than the line graph during the first two minutes of the task.
The saccades between the three AOIs demonstrated interesting differences between the participants, though. As shown in Figure 15, Participant #8 seemed to have more saccades between the instructions and the main textbox than between the instructions and the line graph or between the instructions and the bar graph. The saccades pointing to the bottom of the screen indicated that the participant was looking at the keyboard when he was entering his response. The visualisation of the eye-movements of Participant #13 in Task 1 (Figure 16) showed that there were a lot more saccades between the main textbox and the graphs, which indicate that he was reading forward and backward between the textbox and the two graphs, in a sharp contrast to Participant #8 whose saccades were mainly between the textbox and the instructions (see Figure 15).

Figure 15: Visualisation of eye-movements of Participant #8 in the first two minutes of Task 1

Figure 16: Visualisation of eye-movements of Participant #13 in the first two minutes of Task 1
Unlike Participants #8 and #13 whose eye-movements demonstrated they were confident and concentrative in what they were doing or looking for, Participant #27 who achieved the lowest band score of 4 for this task looked less confident or concentrative. A number of his fixations were even on blank space (see Figure 17).
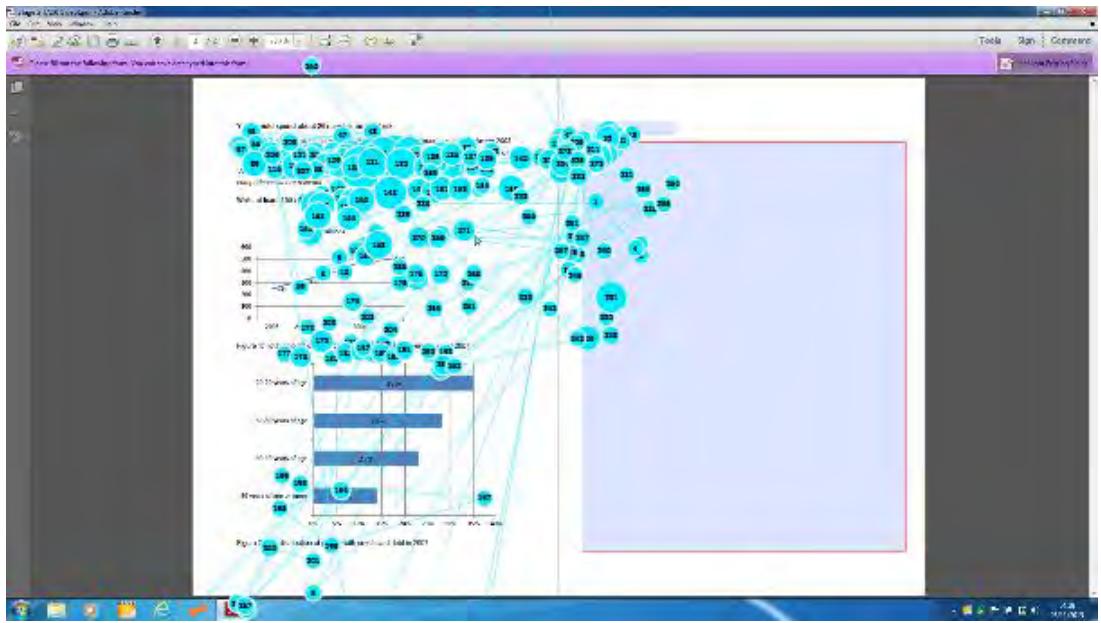
Figure 17: Visualisation of eye-movements of Participant #27 in the first two minutes of Task 1
In Task 2, Participants #8 (Figure 18) and #13 (Figure 19) both focused more on reading the instructions and the graphs than writing their responses in the main textbox in the first two minutes. However, Participant #13 seemed to be a lot more focused on writing in the textbox than Participant #8. Furthermore, Participant #8 had a much smaller number of fixations on the bar graph than on the pie chart; while Participant #13 had focused almost exclusively on the bar graph with only three fixations on the pie chart.
Their saccades between the four AOIs (instructions, bar graph, pie chart and textbox for writing) were distinctively different. The saccades of Participant #8 seemed to be equally distributed between AOIs; while Participant #13 had much more frequent saccades between the textbox and the bar graph. Participant #13 also had a lot more saccades between the instructions and the bar graph than Participant #8. In this task, Participant #8 was the only one who achieved a band score of 7; Participant #13 achieved 6.5, the second best.
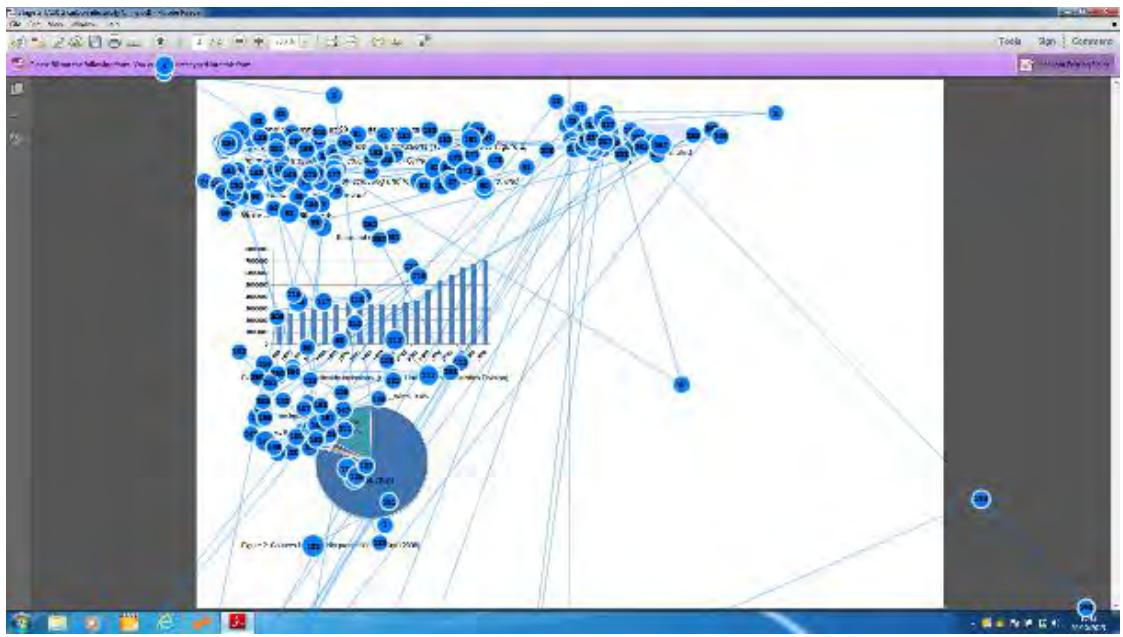
Figure 18: Visualisation of eye-movements of Participant #8 in the first two minutes of Task 2
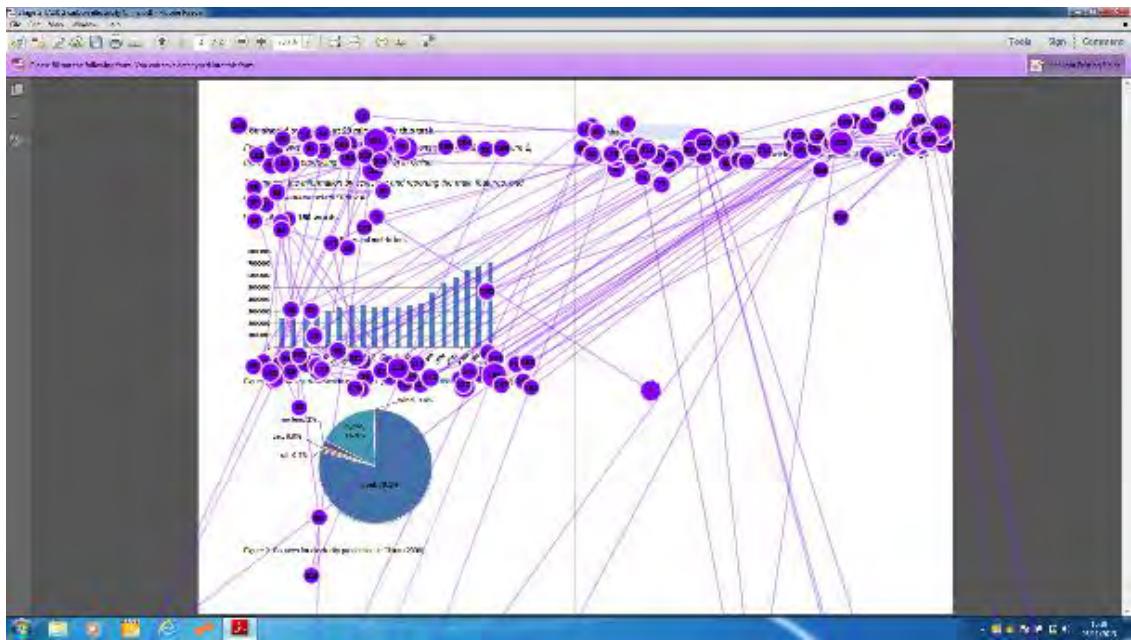
Figure 19: Visualisation of eye-movements of Participant #13 in the first two minutes of Task 2
Participant #20 achieved the lowest band score of 4.5 in Task 2. The visualisation of his eye-movements in the first two minutes (Figure 20) showed that he did not write anything in the main textbox within that time frame.

Figure 20: Visualisation of eye-movements of Participant #20 in the first two minutes of Task 2
In Task 3, three participants (#18, #19, #31) achieved a band score of 7. The visualisations of their eye-movements in the first two minutes are presented in Figures 21 to 23. The fixations and saccades of Participant #18 in the first two minutes (Figure 21) seemed to be equally distributed among the three AOIs (instructions, line graph and textbox), while Participant #19 (Figure 22) focused more on reading the instructions and the line graph than on the textbox for writing. Participant #19 also had the biggest number of fixations on the line graph than the other two participants. Participants #31 (Figure 23) and #18 had a similar number of fixations on the line graph, and they were also similar in terms of the areas of the line graph that they fixated on; however, Participant #31 had a lot more fixations on the instructions and the textbox than Participant #18 on these two AOIs.
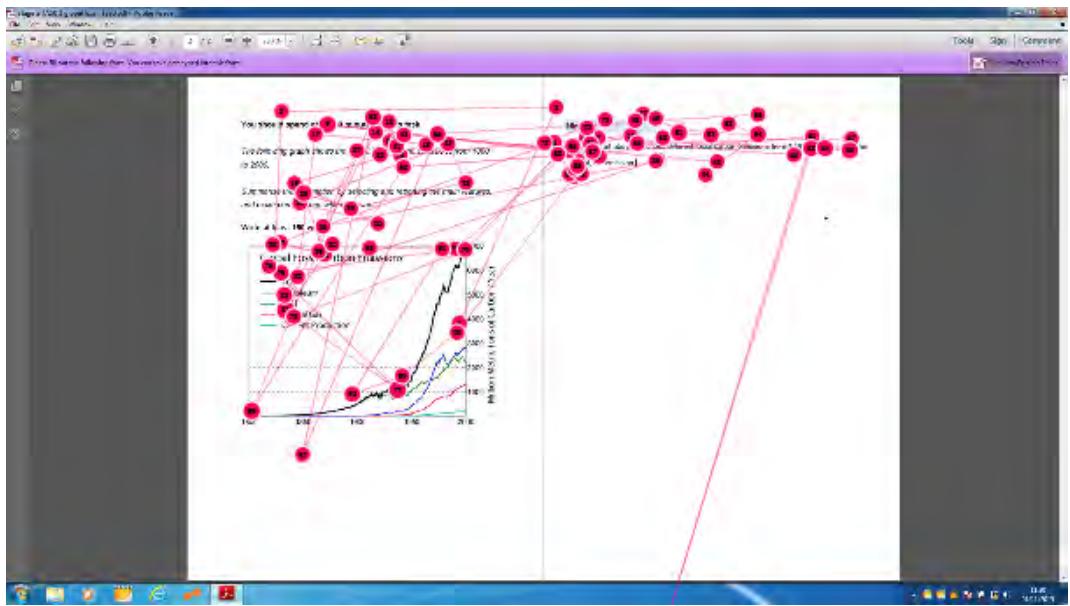
Figure 21: Visualisation of eye-movements of Participant #18 in the first two minutes of Task 3

Figure 22: Visualisation of eye-movements of Participant #19 in the first two minutes of Task 3

Figure 23: Visualisation of eye-movements of Participant #31 in the first two minutes of Task 3
In Task 3, Participant #6 achieved the lowest band score (4.5), the visualisation of his eye-movements in the first two minutes of the task is presented in Figure 24. Unlike Participant #18 and #31 who achieved a band score of 7, Participant #6 had a large number of fixations on the line graph, which looked similar to Participant #19 (Figure 22). However, Participants #6 and #19 were not entirely the same in their focus on the line graph. Participant #19 had only two fixations on the area where the lines diverged, while Participant #6 had a lot more fixations on the same area.

Figure 24: Visualisation of eye-movements of Participant #6 in the first two minutes of Task 3
In Task 4, two participants (#13, #31) achieved a band score of 7. The most noticeable difference in these two participants’ eye-movements in the first two minutes was that Participant #13 had a large number of fixations on the tables, especially table 1 (see Figure 25), compared to Participant #31 who had only 7 fixations on table 1 and none on table 2 (see Figure 26). When they were writing their responses in the main textbox, the saccades of Participant #13 were mainly between table 1 and the main textbox. For Participant #31, the saccades were mainly between the instructions and the main textbox.
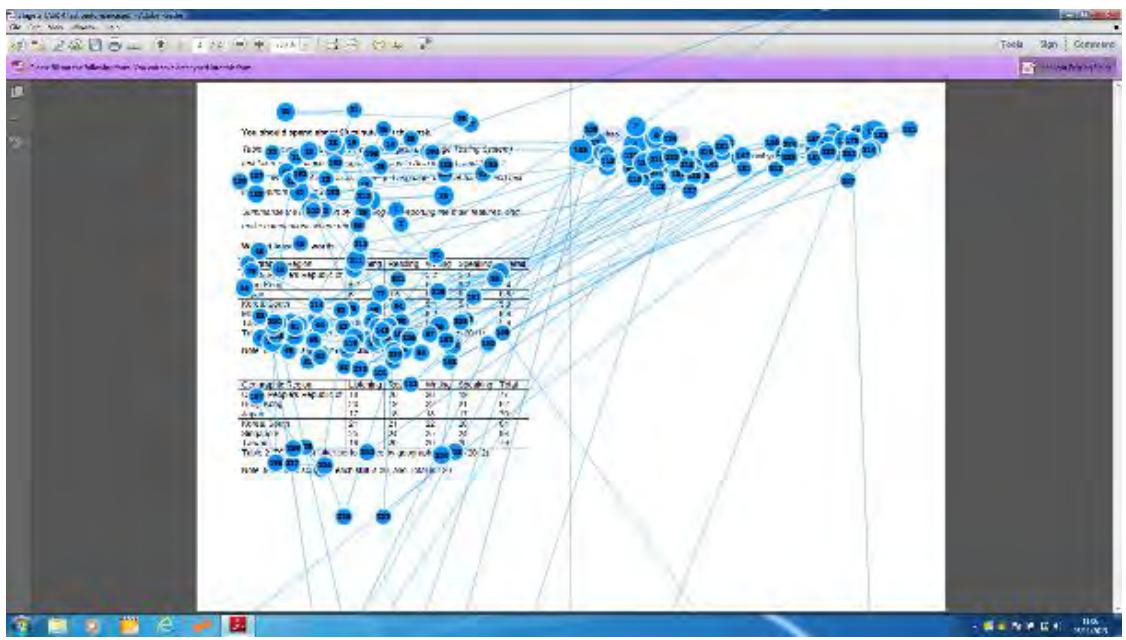
Figure 25: Visualisation of eye-movements of Participant #13 in the first two minutes of Task 4
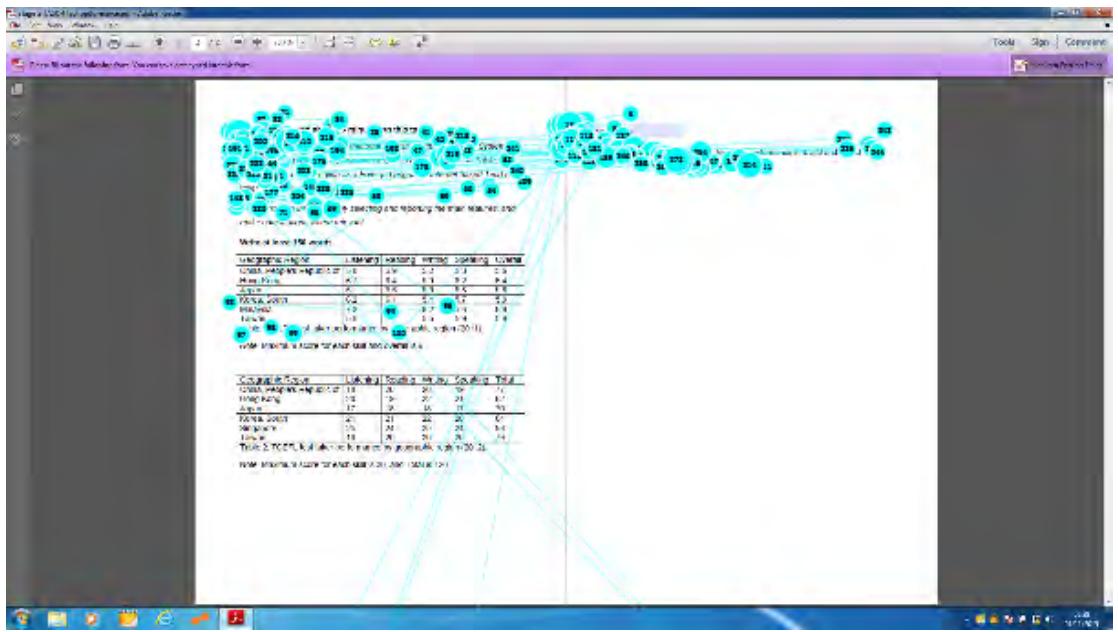
Figure 26: Visualisation of eye-movements of Participant #31 in the first two minutes of Task 4
In Task 4, Participant #10 had the lowest band score (4.5), and the visualisation of his eye-movements in the first two minutes is presented in Figure 27. Like the two successful participants above (#13, and #31) in this task, he also focused more on the instructions and the tables than on the main textbox. However, what differentiated them was that Participant #10 did not write anything in the first two minutes, whereas Participants #13 and #31 both wrote about one sentence. Participant #13 began to write at 1 minute 18 seconds after the start of the test, and Participant #31 began to write at 56 seconds after the start of the test.
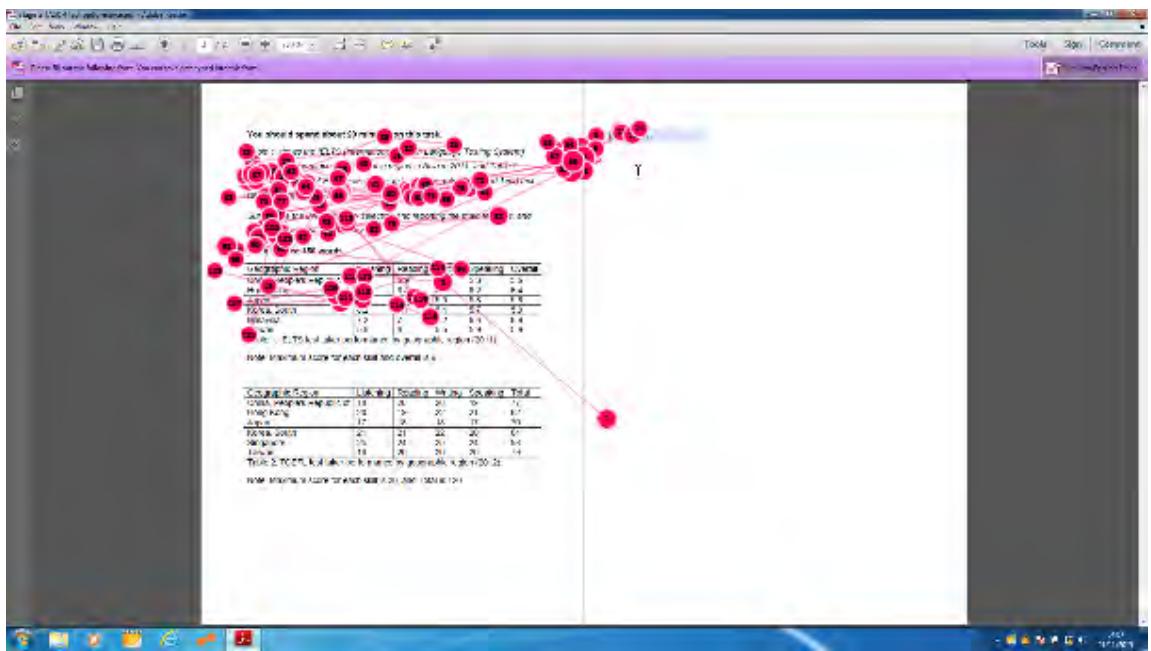
Figure 27: Visualisation of eye-movements of Participant #10 in the first two minutes of Task 4
As shown in the figures above, it is evident that all these participants, regardless of their test score, focused predominantly on reading the instructions and the graphs during the first two minutes of the tasks, which corroborates the finding of our previous study that test-takers would often spend the first 2-3 minutes reading instructions and graphs (see Appendix 1 for the working model developed from the think-aloud data). The visualisations of the eye-movements during the first two minutes also provide further evidence that the writing process may not be linear. Test-takers would not necessarily wait until they have fully understood the task instructions and graphs before they start writing.
The visualisations of the eye-movements during the first two minutes demonstrate that variations between the four tasks, between successful participants, between successful and less successful participants, are noticeable. For example, Participant #31 in the first two minutes of Task 3 seemed to have paid equal attention to reading the instructions and the graphs and writing his response; while in Task 4, he began to write even without reading the second table. The uniqueness of the eye-movements of every single participant, for different tasks and at different stages of the tasks, shows the necessity for conducting qualitative analysis of eye-movements to understand the “individuality” (Arndt, 1987) of each test-taker’s writing process.
4.8.3 Stimulated recall interviews and focus-group discussions
In the stimulated recall interviews and focus-group discussions, 17 participants commented explicitly on how their English writing ability might have affected their test-taking process and to what extent the graph-based tasks measured their writing ability. Seven of them held the view that IELTS AWT1 can measure their writing ability well (or writing ability is important for successful performance) and 10 of them felt that AWT1 can measure their writing ability to some degree, but not as well as IELTS AWT2.
The seven participants (#5, #6, #19, #22, #24, #28, and #29) highlighted the importance of English writing ability in their performance in the graph-based tasks.
In my view, it can reflect my English language proficiency very well.
( ) - Participant #5
I think it can really discriminate test-takers’ English language proficiency. If your English is not good, you can only use a few empty sentences to describe the graphs, and that’s it, you can’t write enough number of words; however, if your English is good, you can use longer sentences to reach the number of words…So, I think it measures your English language ability, because everyone seems to be able to understand the graphs, after all, the graphs are not difficult to read.
(我觉得对英语水平的要求还是很大能区分的。假如英语水平低的话就是你只能用很空洞的几句话去描述完了,就达不到它的字数,如果你水平高的话你就用句子比较长什么的,反正就能达到它的字数…我觉得是英语,像读图的话一般一般人都能读懂吧,这个图也不是特别难读。主要还是你自己英语能力吧) - Participant #6
Even if the overall sentence structure is correct, some small errors in grammar or expression can make the rater confused, so your writing ability does have great influence on the grade your writing would receive.
(即使说他这句话用的句式是正确的,但它里面会有小的细节的语法错误或者小的细节的表达错误就让对方的老师不明白这个东西在说什么。所以写作能力对于分数的影响是很大的) -Participant #19
I think the influence is big; definitely it has influence, great influence. If your English language proficiency is high, you can write quickly, the words and sentence structures come as if running to you quickly for you to use. However, if your English language proficiency is not high, you can only write slowly. I had many classmates; their English language proficiency was not high, they had to translate then write, so their writing process was slowed down.
(我觉得挺大的,就影响肯定是有的,而且是挺大的,因为你要水平高的话可以写的快,写的词语,句型跑到脑子里,蹦蹦蹦就出来了,吧啦吧啦的就可以写的多。像如果不快的话估计就写的比较慢,像我原来很多同学就是,写作水平不是特别高,他就翻译一遍,再写,估计那个时候速度就下来了) - Participant #22
I think the determining factor for your test result is your language ability, regardless of graph type or topic. You can still produce a good writing even if you are not familiar with the topic, because you have good language ability, rich vocabulary and sentence structure that will help make your writing full of ideas. It is possible that you did not know well this or that topic; however, it is unlikely that a rater would mark down your writing that used very good vocabulary and sentence structures simply because you did not know the topic.
(我想能力,就是最后决定一个人考试成绩的还是能力,不管是什么类型的图表,你遇到什么样的话题。如果你能力强的话我感觉就算你碰到了一个不是你很了解的话题,你也是通过自己平时积累的东西,对这方面的了解吧,你也能很好的写出来。因为你可以通过丰富的词汇量的表达,丰富的句型,让文章显得很饱满。可能这个知识点是你不了解的,但是有这些很大的很好的词汇量,用很好的句型,考官应该也不会,因为你这个东西的不了解给你很低的分) - Participant #24
I also think that this is highly related to vocabulary size and grammatical knowledge. For example, we may be at the same level of analytical skills; however, someone may be good at writing, good at expressing himself, he would be able to spend less time and efforts in figuring out what words to use and how to punctuate. However, another person who is not good at writing will have to go through a strenuous process: understanding the source information, thinking about what words to use and at the same time worrying about if the rater will be pleased with the simple sentences he has written. This kind of influence is big, negative influence…Someone who is good at expressing himself is able to write an extended paragraph even about a stone or an egg. On the contrary, someone who is not good at writing won’t be able to describe a colourful scene, because, very likely, he does not have the vocabulary to describe the colourful scene…Sometimes, someone may know very clearly what to write in Chinese, but he can’t write them down in English.
(我也觉得就是词汇量和语法的积累有很大的关系,像有些人就可以,虽然对一个事物分析认知能力大家都一样,但是如果他表达能力强的话,他就可以在表达上少花很多心思,信手拈来,文不加点,然后如果你的表达能力欠缺的话你还得一边分析图表一边在想我应该用什么词来描述这样子的现象,然后又会担心自己的语句太单薄,然后就让考官满意啊,这些,可能影响会比较大,负面影响…就是有表达能力强的话,面对的一块石头或者一块鸡蛋它就可以写出一大段话,但是可能表达能力弱的话你给他看一个丰富多彩的景色,可能他就因为词汇的匮乏,可能也描述不出它的美妙…有时候,有些人就是说中文的时候头脑很清晰,要讲什么讲什么,要英文讲,他知道要怎么表达,但是就是写不出来) - Participant #28
Test preparation course is useful; it can help you reach a certain level, but not massively. It is still your English language proficiency that matters. A template can help you to have an overall structure for your writing, but what you write and how you write is still very much dependent on your language ability.
(我感觉训练一定是有用的,就会帮你到达一个,但是我觉得不会到一个很高的程度。还是会和你平时的积累啊,英语水平有关系….可能用出来还是要看你的水平。句式只能帮你搭好一个框架,然后写什么怎么写,然后填进去还是有很大的关系) - Participant #29
Ten participants commented that the graph-based writing tasks measured not only their English writing ability but also their ability in reading, analysing and summarising information presented in graphs. AWT1 was considered less capable of measuring writing ability than the second task in IELTS. The less flexible overall structure and the limited number of words that test-takers can use or are required to use were considered as the two major factors that made the tasks highly coachable and, therefore, less capable of measuring writing ability due to the intensive preparation that the majority of the test-takers would normally do. Two of the participants thought IELTS AWT1 was like bāgǔwén10 ( ) in Chinese imperial examinations, because of their shared characteristics of rigid overall structure and limited number of words. Below, we present all the comments from the 10 participants.
We have done four graph-based writing tasks which looked very similar to me. I don’t think they can really reflect our writing ability; it measures our ability in summarising and analysing the information more than our ability in writing…Furthermore, in fact, you can prepare for the words and sentence structures that you can use in the graph-based writing tasks; it is like a fill-in-a-blank task…I think the graph-based writing task is less capable of measuring our writing ability than IELTS Writing Task 2, as it measures our ability in analysing and summarising information.
(而且我觉得像这种图,因为做了也相当是四个图表题,对吧,我自己觉得它都,它的类型都是非常非常相似的,所以我认为它不是很能够表现一个人的写作水平,它可能比较多的是体现一个总结和分析的能力… 然后它其实就是说, 它稍微准备一下词汇啊或者句型这样,
- Literally translated as eight-legged essay, it was formulated around an artificial, rigid structure of eight legs or sections: opening, amplification, preliminary exposition, initial argument, central argument, latter argument, final argument, and conclusion. There were also strict limits on the number of words ano sentences that the examinees could write in each leg/section to insert their knowledge about the Four Books and Five Classics (see https://en.wikipedia.org/ wiki/Eight-legged_essay)
就有点类似于填空的感觉,我觉得这个第一部分,图表题就是这种感觉…我觉得它比task2来说要弱一点,就是分析总结能力考察要多一点) - Participant #1
I think the graph-based writing tasks can only measure your writing ability to a small extent, because there is a kind of template that you can follow.
(但是这个图表类的,写作水平还是,比较太小,说明不了太大问题,就它有一个套路什么的)- Participant #7
It is not as well as the second task of IELTS test that the first task can measure your writing ability, since it mainly measures your ability in describing graphs. In this sense, the two types of tasks are different. Furthermore, I think you can improve your performance after a short period of training because there are certain words and templates that you can use in your writing no matter what graphs are used in the task; and in fact, the number of words and templates that you need to grasp are not big.
(就是没有第二部分反映自己英语的写作能力,没那么强啦,这种更多的是表现自己描述这种表格的能力。或者曲线,等等。所以我觉得还是有区别的,而且我觉得这种是通过一段时间的训练,是可以短时间提高的,因为它不管这个表格怎么变来变去,就那样,然后我掌握所有跟这个有关的词汇表达方式,都掌握了,而且这个量也不是很大) - Participant #9
I feel IELTS AWT1 is like bāgǔwén. If you know the words, e.g., connectors, you can put these words into something like a template, the writing is done. I read some writings that were awarded 7; they did not use complex words, there were just common words used in these writings. All you need to do is to put the words into a template, your writing is done.
(然后我觉得雅思task 1很有八股文的味道,就是它那个,你只要掌握了连接词啊这些之类的,然后就是把它套进去,套公式一样,一篇就写完了。我看那种雅思7分的作文,基本上没什么难的词汇,就是普通的词汇,然后他主要是用那种套的格式比较好,就是把各种词套上去,基本上一篇就可以写完了) - Participant #16
I think the second writing task of IELTS can better discriminate test-takers’ writing ability. I don’t think the first writing task has a good discrimination power.
(我觉得大作文的写作比较能区分开写作能力吧,我觉得小作文就不大能区分开) - Participant #17
I don’t think it can discriminate test-takers’ English language proficiency very well, especially when we can all say something about the graphs…Those people who are good at writing academic papers are also good at describing graphs because the graph-based writing tasks measure your ability in reading and analysing data in the graphs.
(我自己的感觉是好像,就是在大家都能够表达的基础上来讲对英语水平的区分度不是很高…
我觉得为什么科学论文写的比较好的人会比较擅长写那些图表,因为它考的也是你的读图的能力或者是数据分析的能力) - Participant #18
It is possible that those who can write academic papers well (in Chinese) are also good at describing the graphs if his English language ability is OK…It may also be related to what subject you’re studying…students in arts and social sciences may be doing literaturebased research or essays, their scientific reasoning skills are probably not trained to a good extent.
(可能就是科学论文写的比较好的大多图表题也比较好吧。如果他的英语能力也okay的话…我觉得专业什么的也有关系, …像文科生的专业基本上还是做一些文字方面的作业或者是研究,然后对这种逻辑思维能力其实得不到很大的锻炼) - Participant #27
I was very much constrained by…, it was a pretty painful process to write. I mean, I wanted to say something, but I couldn’t figure out how to express myself in English, so I felt I was constrained by my own English writing ability…The weaker students may just copy the sentences from the task instructions as the first sentences in their own writing; however, someone with better language ability would use a different sentence structure and paraphrase the sentences with different words. Although the overall structure of the writing may be somewhat fixed, the final product still depends on the person…The first sentence may look similar, but the rest is different from person to person.
If one person used a template he has memorised, his writing would be monotonous; there would be no change in words or sentence structures from the template; and if another person can make some adjustment in vocabulary and grammar, you should be able to see the differences between the two writings. However, overall, there isn’t much difference between our writings, because the overall structure is fixed and we are only allowed to write 150 words, though differences do lie in the details.
(我是觉得我在写的时候还是挺受限…在写作文的时候有点痛苦。就是我想表达一个意思,但我想不出来英语应该怎么说,就这样子写作我觉得还挺受自己写作能力的限制的…就比如从第一句话来讲这个图表描述了什么什么,我觉得能力稍微差一点的人就会把题干上的句子抄下来,就是介绍,但是如果能力稍微好一点的话他就会换一个句式,然后使用的词语也会不一样,就总体来说虽然他大框架是钉死的,但是最后发挥可能还是要看人的…那是第一句嘛,但是后来的,后面的每一句,每一句来讲大家的表现也是不一样的。就是总体文章来讲,两个人,一个人完全按照模板来写,完全就是很呆板的,就是词汇也不变,句式也不变,和另外一个能稍微做一个小变化,使用的词汇形式啊,就多用一点语法形式那种,就两个比较起来我觉得总体还是有点区别的。小作文的话我觉得的确是相差不是特别大,因为毕竟就只有150字,而且大部分框架都订了,但是总体上来讲,细节上来讲我觉得还是会有一些区别) -Participant #31
I don’t think there is a great influence of my English writing ability. If your grammar is OK and you know the pile of words that you can use in different tasks, that’s about it, because it is quite easy to insert the connectors in your writing as there aren’t any complicated relationships…After you’ve done certain preparation, the influence of writing ability on test performance becomes limited…If you remember the common words to describe graphs and do some practice, I think, I mean there isn’t much room for you to go beyond this in your writing.
(我觉得没太大影响啊,我主要觉得是你语法如果还okay不会怎么错,然后词都是那堆,然后那些短语跟词语那堆都弄好了,大概就差不多了吧。因为像写作能力,像衔接什么的那种也是算比较简单的吧,就是在这里它没有很多什么乱七八糟的一些关系什么的…当在准备第一部分的时候我觉得准备到一定程度上面,就写作能力影响上面就不会很大….像那种描述图表比较常用到的那种词根表达,都记得比较清楚,然后熟练运用一下,我觉得就是,我的意思就是可发挥的空间没有特别多) - Participant #32
I agree with [Participant #16] that AWT1 is like bāgǔwén. Clearly it has three sections. In the first section, you need to describe the topic of the graph; in the second section, you describe in detail the changes and the trends, and in the third section, you draw a conclusion. Furthermore, the vocabulary you use in one task can be used in another task. They are words like rise, go up, etc., especially for describing line graphs. What words you use are fixed, therefore, it is very easy to follow a template or model writing. Does it reflect our writing ability? I think it measures more of our reading ability than writing ability, because we first of all have to understand the graph and do the analysis…Therefore, AWT1 reflects not only your writing ability, but more importantly, your reading ability.
(就像刚才[Participant #16]所说的,它就像八股文的形式,就很明显的三段论嘛,
就是第一段描述它在讲什么,第二段就是具体的描述它这个变化趋势,那么第三段就是根据它那个图表你自己分析做出一个结论。这是,然后它里面的那个词汇其实很好套,就是rise,go up的那种,特别是折线图, 它的那个词汇都是比较固定的,都是非常好套的,
就是一个模板内做的。但是就是它到底能不能反映一个人的写作水平,我觉得它反映更多的是一个人的阅读能力,因为你因为首先要把图表看懂,然后再做分析嘛,…所以我觉得
Task 1它反映的不仅仅是你写作的能力也更多 的是在反映你阅读的能力) - Participant #33
5 Conclusion
This study investigated test-takers’ cognitive processes when doing IELTS AWT1 tasks. To be specific, the four research questions aimed to identify: (1) the overall patterns of test-takers’ cognitive processes; (2) the extent to which their cognitive processes were affected by the use of different graphs in the tasks; (3) the relationship between test-takers’ graph familiarity and test-taking cognitive processes; and (4) the relationship between test-takers English writing ability and test-taking cognitive processes.
5.1 RQ1: The overall patterns of test-takers’ cognitive processes
The quantitative eye-movement data showed that test-takers did not follow a linear sequence from reading task instructions, to reading graphs and entering responses, although it was very clear that the first AOI that the majority of the participants read was the task instructions which were apparently at the beginning of each task. Task instructions had the longer first fixation duration across the four tasks, although not significantly longer than the rest of the AOIs which had very similar first fixation duration. In terms of fixation duration which measures the average of all single fixations on an AOI, the participants spent a similar length of time on the two non-graph AOIs (i.e., the task instructions and textbox for writing) in a task, and also a similar length of time on the two graph AOIs (excluding Task 3 which had only one graph). On average, the participants had significantly longer fixation duration on the nongraph than the graph AOIs. In terms of visit duration, the participants on average spent more time on the textbox, followed by the task instructions (which were about ½ of visit duration on textbox) and then the graph AOIs. In both fixation duration and visit duration, non-graph AOIs were significantly longer than the graph AOIs.
The aggregated data of fixations and visits (i.e., total fixation duration and total visit duration respectively) demonstrated with ample evidence that IELTS AWT1 is predominantly a writing task. About 63-68% of total fixation duration was on writing, 18-26% on reading the graphs and 9-15% on reading the task instructions. Similarly, about 68-75% of total visit duration was on writing, 16-26% on reading the graphs and 6-9% on reading the task instructions. As total visit duration is closer than total fixation duration to the full length of time that the participants actually spent on an AOI, it is safe to say that, on average, the participants spent less than 10% of their time on reading the task instructions, around 20% on reading the graphs and nearly 70% of their time focusing on writing.
It should also be noted that there were some small variations between the four tasks. For example, in Task 1, 75.4% of total visit duration was on writing, while it was 72.8% in Task 2, 67.8% in Task 3 and 69.3% in Task 4. Similarly, the participants’ total visit duration on the graphs also varied slightly between tasks: 15.5% in Task 1, 18.3% in Task 2, 25.9% in Task 3 and 21.4% in Task 4. The total visit duration on task instructions also varied: in Task 1, it was 9.1%, while it was 8.8% in Task 2, 6.3% in Task 3 and 9.4% in Task 4 (see Figure 12). It is evident that the participants spent less time in total (as shown in total visit duration) on the task instructions than on the graphs, but their fixation duration and visit duration (which report the average of fixations and visits respectively) on the task instructions were much longer than on the graphs.
The quantitative eye-movement data showed clearly the overall, though much simplified, pattern of test-takers’ cognitive processes when completing the graph-based writing tasks. The qualitative analysis of the visualisations of eye-movements (fixations, visits and saccades) offered another equally important perspective to understand the test-taking cognitive processes. A much richer picture of how each participant dealt with the graph-based writing tasks emerged from our qualitative analysis of eye-movements.
5.2 RQ2: The extent to which their cognitive processes were affected by the use of different graphs in the tasks
With regard to the second question on the effects of graph features on test-taking cognitive processes, the eye-movement metrics reporting single fixations (i.e., first fixation duration, fixation duration) showed little difference between graphs. However, the eye-movement metrics reporting aggregated data of fixations (i.e., total fixation duration, fixation count, visit duration, total visit duration and visit count) demonstrated statistically significant differences between graphs, both within a task and between tasks. In other words, the impacts of graphs on single fixations and visits were almost negligible; however, these minor impacts were accumulated gradually during the 20-minute test period to a point that they became statistically significant.
The interviews and focus-group discussions offered further insights into how the participants dealt with the different types of graphs. In essence, these participants made very similar observations as the participants in Yu et al. (2011). They had a clear understanding about the “cognitive naturalness” (Zacks & Tversky, 1999) and perceptual properties of different types of graphs and how they should follow the cognitive conventions to process the graphs and present their comprehension of the graphs in their writings, which in turn affected their preference towards certain types of graphs, as well as their judgement about the difficulty level of tasks. The line graph, pie chart and bar graph were considered easier (though not equally among the three types of graphs themselves) than the statistical table because the key messages in the former three types were more readily identifiable and useable than the information in a statistical table.
Another important factor that affected their test-taking process was the amount of information available in the graphs. The amount of information could mean the number of graphs (e.g., one or two) in a task, as well as the amount of information contained in a single graph (e.g., a simple line graph vs. a line graph with multiple lines and trends, a simple line graph vs. a complex statistical table). The participants seemed to have different experiences in coping with the amount of information in a task. Some participants found that a large amount of information in a task made the task easier because they felt they had plenty to write about; while for others, the large amount of information made the task more challenging because they had to make decisions on which information was more important and whether it should be included in their writing and they had to figure out by themselves the relationships between two graphs if there were two graphs in a task. Overall, the impacts of graph features on the participants’ eye-movements seemed to be the largest among all the factors that this research investigated (the other two factors being the participants’ English writing ability and graph familiarity).
5.3 RQ3: The relationship between test-takers’ graph familiarity and test-taking cognitive processes
To address the third research question about the impacts of graph familiarity on test-taking processes, we conducted a series of correlational analyses. It was found that only two out of 105 correlations were statistically significant. The two significant negative correlations were with first fixation duration on E2-bar and E3-writing, which means that the higher a participant’s graph familiarity, the shorter his first fixation duration on E2-bar and E3-writing. However, as we discussed earlier, first fixation duration presents only the information of a single fixation and, therefore, may not be as sensitive or useful as the metrics reporting the aggregated data of eye-movements (e.g., total fixation duration and total visit duration) to identify the accumulated impacts of graph familiarity on test-taking process.
The largely non-significant correlations between eye-movement metrics and graph familiarity were in line with the findings from the analysis of the stimulated interviews and focus-group discussions, as well as the participants’ self-assessment on the potential impacts of their graph familiarity on test performance (see Section 4.2 for the findings from the graphicacy questionnaire data). According to the data of stimulated interviews and focus-group discussions, a number of participants thought their graph familiarity had only minor or no effect on their test-taking process, as they were sufficiently capable of comprehending the graphs used in this project.
Like the participants in Yu et al. (2011), a number of them also thought that the effects of their graph familiarity were more on their feelings (e.g., confidence vs. anxiety, at the beginning of a test when they first saw the graphs) than on the whole test-taking process or their test results. While lack of graph familiarity would not have detrimental impacts of test-taking process or performance, high familiarity with certain types of graphs was considered to be capable of facilitating more successful and smooth test-taking process (see also Section 4.6 on the impacts of graph features on eye-movements).
5.4 RQ4: The relationship between test-takers’ English writing ability and test-taking cognitive processes
The last research question examined the relationship between test-takers’ English writing ability and their cognitive processes involved in the graph-based writing tasks. We looked at 315 correlations between the participants’ English writing ability and the seven metrics of the participants’ eye-movements. Overall, only a very small number of significant correlations were observed, which indicates that the participants’ English writing ability on the whole did not seem to have a direct impact on their eye-movements; or to put in another way, there did not seem to be significant correlations between a participant’s English writing ability and his eye-movements on the various AOIs (task instructions, graphs and the textbox for writing). Furthermore, there does not seem to be any easily observable pattern in the small number of statistically significant correlations either; which correlation is significant or not remains rather unpredictable. However, there was one noticeable consistency in the sets of correlations, though largely not statistically significant. The participants’ English writing ability or performance was found consistently negatively correlated with first fixation duration and fixation duration. In a nutshell, our correlational analysis suggests that the relationships between the participants’ English writing ability and their eye-movements are rather inconclusive.
Our further qualitative analysis of the eye-movements of high performers and low performers during the first two minutes of the four tasks provided further evidence on the inconclusive relationships between writing ability and eye-movement metrics. There were highly noticeable differences in eye-movements in different tasks, at different stages of the tasks and on different AOIs in a task, between successful and less successful participants, but equally so, between successful participants as well as between less successful participants.
The stimulated recall interviews and focus-group discussions indicated that the participants were rather divided in their views on the relationships between their English writing ability and their test-taking processes. Just over half of those who explicitly commented on such relationships thought that successful performance of IELTS AWT1 tasks were dependent, not only on their English writing ability, but also on their ability in reading, analysing and summarising both the textual and graph information. A number of participants also commented that the rigid overall structure of AWT1 writing and the predictable nature of graphs and the associated cognitive conventions of graph comprehension and presentation (see Section 4.6) made AWT1 tasks highly coachable and mouldable in the sense that test-takers can easily memorise a limited number of vocabulary, sentence structures and even model writings or templates during test preparation and use them in slightly modified forms in their AWT1 writings (see also Yu et al. 2011).
5.5 Further research and analyses
The findings to the four research questions present some glimpses into the complex nature of the IELTS AWT1 tasks, and the dynamic interplays between test-taker characteristics (e.g., graph familiarity, English writing ability) and task features (e.g., different types of graphs, amount of information contained in a graph, and the relationships between task instructions, graphs and the textbox as the three major components of a task). Methodologically, this research demonstrates the great potential of using eye-movement data to examine test-taking process.
A number of further analyses of the quantitative eye-movement data could be conducted to make more use of the recorded eye-movement data, for example:
We could define more fine-tuned AOIs for task instructions and graphs and analyse the eye-movement metrics of the new AOIs and groups of AOIs. For instance, the task instructions could be defined in four AOIs in the order of: (i) the first sentence of the task instructions (“You should spend about 20 minutes on this task”), (ii) the sentence describing the content of the graph(s), (iii) “Summarise the information by selecting and reporting the main features, and make comparisons where relevant”, and (iv) “Write at least 150 words”. Each graph could have three fine-tuned AOIs, namely, the graph’s title, the graph itself, and the legends used (if any). The analysis based on the eye-movement metrics of the fine-tuned AOIs and AOI groups could provide further information on how each component of the task instructions and graphs activated the test-takers’ attention and which component might have caused any problem for the test-takers. Findings from this kind of detailed analysis would provide more useful diagnostic information for test-takers and their tutors in test preparation courses. As we noticed that the relationship between English writing ability and eye-movement metrics may not be linear, so it would be interesting to conduct further statistical analysis to understand the extent to which the effects of English writing ability on eye-movement varied at different stages of the test, e.g., during the first two minutes when test-takers would normally focus on reading the task instructions and graphs, and during the last two minutes when test-takers tend to self-evaluate their writings (see Appendix 1). Furthermore, we could conduct the correlational analysis using IELTS four sub-scores (task achievement, coherence and cohesion, lexical resource, grammatical range and accuracy) instead of the overall grade to understand the relationships between the different sub-skills in English writing ability and eye-movement metrics. In the same vein, we could do segment-based analysis. For example, we could divide the 20-minute recording into 10 segments, with two minutes each. The eye-movement metrics would be based on each segment, instead of the whole recording of 20 minutes; this would give us a clearer picture of what happened at a particular point of time during the test. All the quantitative analyses we have conducted already and the two types of analyses we suggested above could use the eye-movement metrics based on the segments.
As we reported in Sections 4.5.10 and 4.8.2, the qualitative analysis of the visualisations of the eye-movements is another important window into understanding test-takers’ cognitive processes. The comparative analysis of the eye-movements during the first two minutes of successful and less successful participants confirmed the value of such qualitative analyses. The eye-movement metrics evidenced that the participants spent more time in writing than reading the task instructions or graphs. In this research, the writing tasks were presented as a “screen recording” element in Tobii Studio, the participants’ whole test-taking process including their every single activity on the screen (e.g., key stroke, mouse click, and pause) was recorded. Systematic qualitative analysis of the participants’ composing process (e.g., their decisions in vocabulary, spelling, grammar and sentence structure, pausing, revision and information-searching behaviours, and their interactions with and use of different components of task prompt) would provide further insights into test-takers’ cognitive processes.
However, we are also acutely aware of the limit of eye-mind hypothesis (Anderson, et al., 2004). Which AOI a participant reads, for how long, how many times and how often he fixates on and visits that AOI are only one manifestation of his cognitive process. It is possible that two participants may spend exactly the same length of time on an AOI and make the same number of visits to the AOI, and they may have exactly the same statistics of all the eye-movement metrics but what they get out of reading or fixating on the AOI could be very different, and what they are thinking could be different too; and these differences may not be manifested in the eye-movement metrics.
We conclude this report by arguing for collecting more empirical data from different sources and larger number of participants, and more qualitative analysis of the visualisations of eye-movement data. It is the dynamics and the idiosyncratic nature of each participant’s eye-movements in different tasks, at different stage of the tasks, on different AOIs in a task, and on different sub-components of an AOI that warrant further detailed qualitative analysis for the purposes of theory building and test validation.
References
- Anderson, J. R., Bothell, D. & Douglass, S. (2004). Eye movements do not reflect retrieval processes. Psychological Science, 15(4), 225-231. doi: 10.1111/j.0956-7976.2004.00656.x
- Arndt, V. (1987). Six writers in search of texts: A protocol-based study of L1 and L2 writing. ELT Journal, 41(4), 257-267. doi: 10.1093/elt/41.4.257
- Bax, S. (2013). The cognitive processing of candidates during reading tests: Evidence from eye-tracking. Language Testing, 30(4), 441-465. doi: 10.1177/0265532212473244
- Bax, S. & Weir, C. (2012). Investigating learners’ cognitive processes during a computer-based CAE reading test. Research Notes, 47, 3-14.
- Bowles, M. A. (2010). The think-aloud controversy in second language research. New York: Taylor & Francis.
- Brunfaut, T. & McCray, G. (2015). Looking into test-takers’ cognitive processes while completing reading tasks. London: British Council.
- Carpenter, P. A. & Shah, P. (1998). A model of the perceptual and conceptual processes in graph comprehension. Journal of Experimental Psychology: Applied, 4(2), 75-100.
- Cubilo, J. & Winke, P. (2013). Redefining the L2 listening construct within an integrated writing task: Considering the impacts of visual-cue interpretation and note-taking. Language Assessment Quarterly, 10(4), 371-397. doi: 10.1080/15434303.2013.824972
- Freedman, E. G. & Shah, P. (2002). Toward a model of knowledge-based graph comprehension. Diagrams, 18-30.
- Ginther, A. (2002). Context and content visuals and performance on listening comprehension stimuli. Language Testing, 19(2), 133-167. doi: 10.1191/0265532202lt225oa
- Golub-Smith, M., Reese, C. & Steinhaus, K. (1993). Topic and topic type comparability on the Test of Written English. Princeton, NJ: Educational Testing Service.
- Guthrie, J. T., Weber, S. & Kimmerly, N. (1993). Searching documents: Cognitive processes and deficits in understanding graphs, tables, and illustrations. Contemporary Educational Psychology, 18(2), 186-221.
- Hollands, J. G. & Spence, I. (1998). Judging proportion with graphs: The summation model. Applied Cognitive Psychology, 12(2), 173-190.
- Hollands, J. G. & Spence, I. (2001). The discrimination of graphical elements. Applied Cognitive Psychology, 15(4), 413-431.
- Katz, I. R., Xi, X., Kim, H.-J. & Cheng, P. C. H. (2004). Elicited speech from graph items on the test of spoken English. ETS Research Report 74. Princeton, NJ.: Educational Testing Service.
- Knoch, U. & Sitajalabhorn, W. (2013). A closer look at integrated writing tasks: Towards a more focussed definition for assessment purposes. Assessing Writing, 18(4), 300-308. doi: http://dx.doi.org/10.1016/j.asw.2013.09.003
- Körner, C. (2004). Sequential processing in comprehension of hierarchical graphs. Applied Cognitive Psychology, 18(4), 467-480.
- Liversedge, S., Gilchrist, I. & Everling, S. (Eds.). (2011). The Oxford Handbook of Eye Movements. Oxford: Oxford University Press.
- Lohse, G. L. (1993). A cognitive model for understanding graphical perception. Human-Computer Interaction, 8(4), 353-388.
- Mickan, P., Slater, S. & Gibson, C. (2000). Study of response validity of the IELTS writing subtest. IELTS Research Reports, Volume 3 (pp. 29-48). Canberra, Australia: IELTS Australia Pty Limited.
- O’Loughlin, K. & Wigglesworth, G. (2003). Task design in IELTS Academic Writing task 1: The effect of quantity and manner of presentation of information on candidate writing. IELTS Research Reports, Volume 4 (pp. 89-130), R. Tulloh (Ed.). Canberra, Australia: IELTS Australia Pty Limited.
- Peebles, D. & Cheng, P. C. H. (2002). Extending task analytic models of graph-based reasoning: A cognitive model of problem solving with cartesian graphs in act-r/pm. Cognitive Systems Research, 3(1), 77-86.
- Peebles, D. & Cheng, P. C. H. (2003). Modeling the effect of task and graphical representation on response latency in a graph reading task. Human Factors, 45(1), 28-47.
- Pinker, S. (1990). A theory of graph comprehension. In R. Freedle (Ed.), Artificial intelligence and the future of testing (pp. 73-126). Hillsdale, NJ, England: Lawrence Erlbaum Associates, Inc.
- Rayner, K. (1978). Eye movements in reading and information processing. Psychological Bulletin, 85(3), 618-660. doi: 10.1037/0033-2909.85.3.618
- Rayner, K. (1998). Eye movements in reading and information processing: 20 years of research. Psychological Bulletin, 124(3), 372-422. doi: 10.1037/0033-2909.124.3.372
- Schnotz, W., Picard, E. & Hron, A. (1993). How do successful and unsuccessful learners use texts and graphics? Learning and Instruction, 3(3), 181-199.
- Shah, P., Freedman, E. G. & Vekiri, I. (2005). The comprehension of quantitative information in graphical displays. In P. Shah & A. Miyake (Eds.), The Cambridge Handbook of Visuospatial Thinking (pp. 426-476). New York, NY: Cambridge University Press.
- Spinner, P., Gass, S. M. & Behney, J. (2013). Ecological validity in eye-tracking. Studies in Second Language Acquisition, 35(2), 389-415. doi: 10.1017/S0272263112000927
- Suvorov, R. (2015). The use of eye tracking in research on video-based second language (L2) listening assessment: A comparison of context videos and content videos. Language Testing, 32(4), 463-483. doi: 10.1177/0265532214562099
- Winke, P. (2013). Eye-tracking technology for reading. In A. Kunnan (Ed.), The Companion to Language Assessment: John Wiley & Sons, Inc.
- Xi, X. (2005). Do visual chunks and planning impact performance on the graph description task in the speak exam? Language Testing, 22(4), 463-508.
- Xi, X. (2010). Aspects of performance on line graph description tasks: Influenced by graph familiarity and different task features. Language Testing, 27(1), 73-100. doi: 10.1177/0265532209346454
- Yang, H.-C. (2012). Modeling the relationships between test-taking strategies and test performance on a graph-writing task: Implications for EAP. English for Specific Purposes, 31(3), 174-187. doi: 10.1016/j.esp.2011.12.004
- Yu, G. (2013). From integrative to integrated language assessment: Are we there yet? Language Assessment Quarterly, 10(1), 110-114. doi: 10.1080/15434303.2013.766744
- Yu, G. & Lin, S.-w. (2014). A comparability study on the cognitive processes of taking graph-based gept-advanced and IELTS-academic writing tasks (pp. 78). Taipei: LTTC-GEPT.
- Yu, G., Rea-Dickins, P. M. & Kiely, R. (2011). The cognitive processes of taking IELTS Academic Writing Task 1, IELTS Research Reports Volume 11 (pp. 373-449). Canberra: IDP: IELTS Australia & London: British Council.
- Zacks, J. & Tversky, B. (1999). Bars and lines: A study of graphic communication. Memory and Cognition, 27(6), 1073-1079.
Appendix 1: A working model of cognitive processes for taking IELTS AWT1 tasks
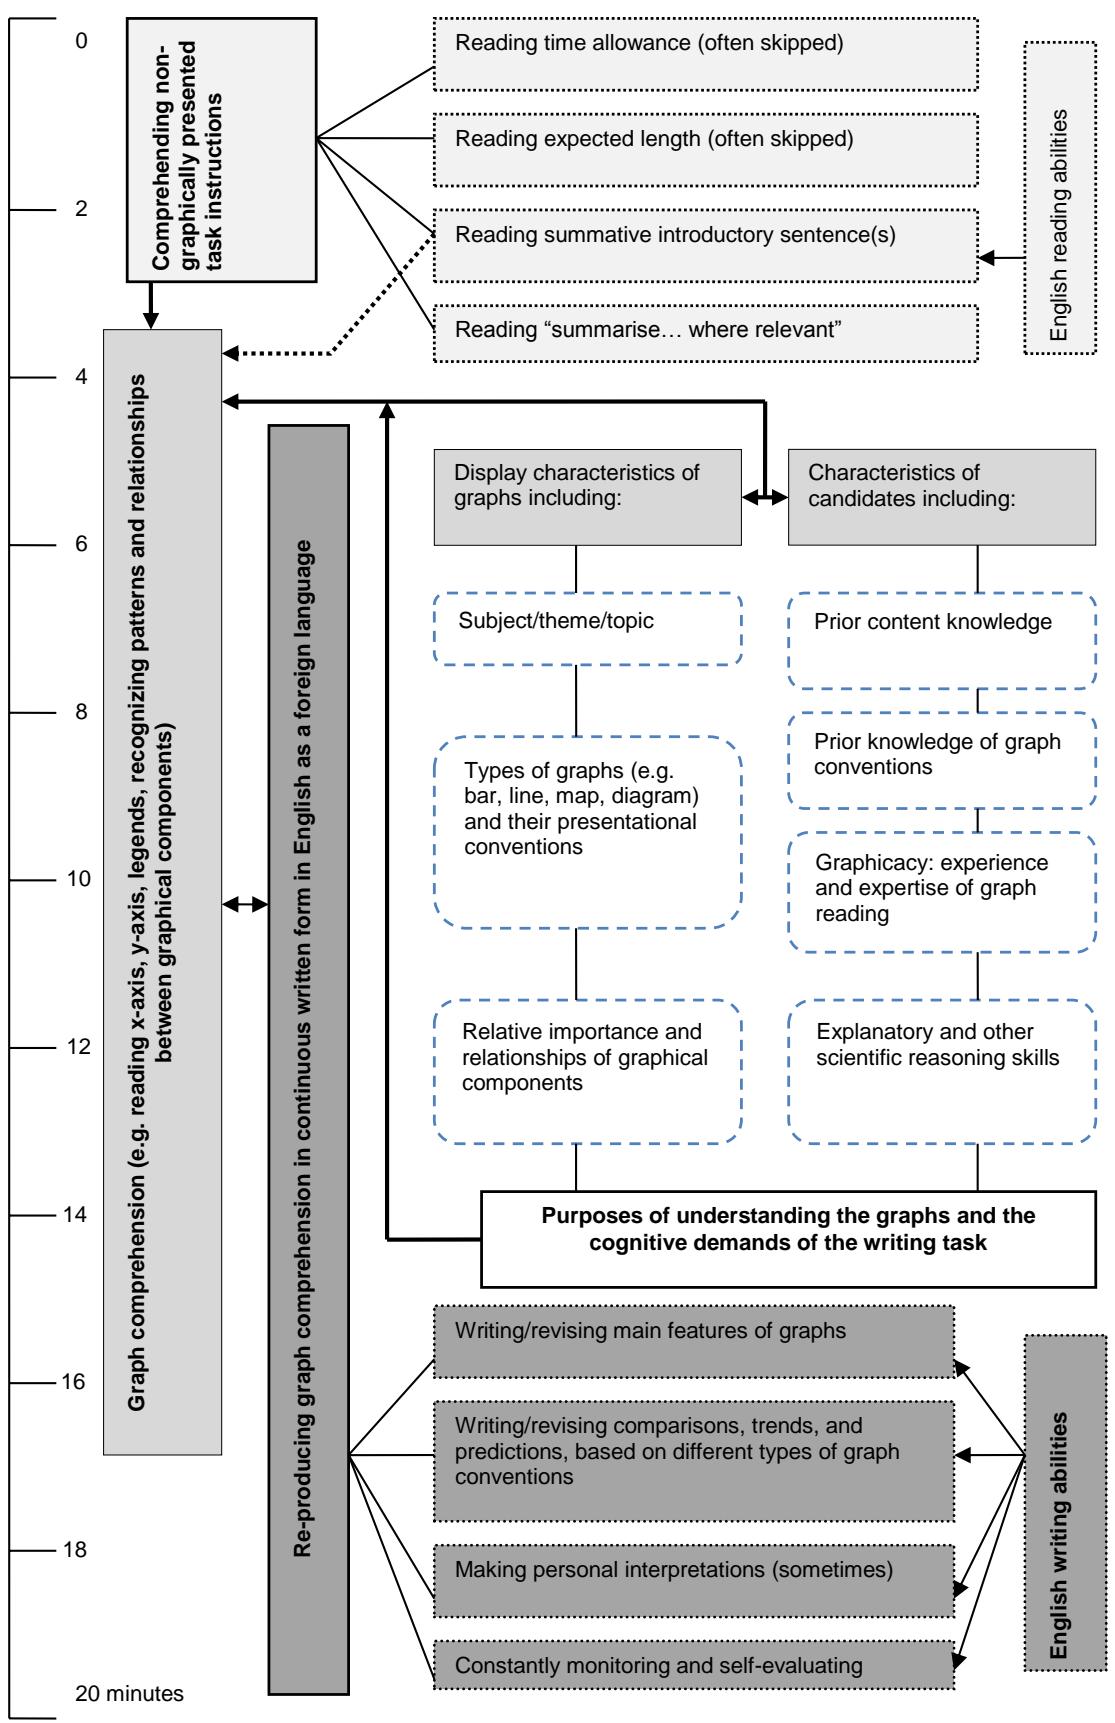
Appendix 2: Open invitation letter for participation
To: All full-time undergraduate and postgraduate students
Zhejiang University
Hangzhou, Zhejiang
People’s Republic of China
Dear Student,
If you will take IELTS (Academic) test in the future, please read on.
I’m writing to invite you to participate in a research project funded by British Council, and carried out jointly by University of Bristol and Zhejiang University. This project aims to gain better understanding of the cognitive processes of taking IELTS Academic Writing Task 1 (AWT1). As a token of our appreciation, we will pay you £20 as honorarium for your participation; in addition, we provide you with the opportunity to assess your English writing ability.
If you are interested, please respond to the survey (https://www.survey.bris.ac.uk/gsoe/ielts) by providing some basic personal information (as shown in the table below) by 18 October. At this stage, your expression of interest in participation is non-obligatory: which means that it does not guarantee that you will be offered a place on the one hand because the number of participants to be invited is very limited due to the nature of this research project, and you have the right to withdraw from the project any time if so you wish on the other hand. However, if you are selected, we do hope you will stay with us until the end of the project to maximise your learning benefits.
We aim to email you the outcomes by 20 October. If you are selected, you will be fully informed of the research procedures then. We plan to conduct this research at Zhejiang University late October-early November 2013.
We abide by the Data Protection Act (1998) and the ethical research guidelines of the International Language Testing Association and British Association for Applied Linguistics. All data collected for this research will be anonymised and used solely for this research. Meanwhile, if you have got any question, please don’t hesitate to contact me.
Yours sincerely,
Yu Guoxing, PhD
Director of the CogPro-2 Project
| Name | Gender | Faculty, Department, Specialism | Undergraduate or postgraduate | Year Group | Have you taken IELTS test? | If yes, what are your IELTS scores | When do you plan to take IELTS? | Contact Tel. number | Email Address |
|---|---|---|---|---|---|---|---|---|---|
Appendix 3: Consent form
Dear Participant,
Thank you for agreeing to participate in the CogPro-2 research project funded by British Council and carried out by the consultants from University of Bristol and Zhejiang University in October-November 2013. This project aims to gain better understanding of IELTS Academic Writing Task 1 (AWT1) that uses graphs as test prompts. The data collection for this research would involve three sessions:
Session1: you will take IELTS Academic Writing Tasks 1 and 2 under normal examination conditions, and then answer a questionnaire about your graph familiarity and experience, and another questionnaire about your computer familiarity and experience. Session 2: you will take three IELTS AWT1 tasks, with your eye-movements recorded, and then be interviewed on a one-to-one basis on how you took the AWT1 tasks. Session 3: you will take part in a focus-group discussion with peers on test-takers cognitive processes.
The interviews and focus-group discussions will be recorded.
As a potential IELTS test-taker, you will benefit from participating in this research. Your participation is voluntary. You have the right to withdraw your participation any time if so you wish without any consequences, but we would like to encourage you to work your best until the end of the project to maximise your learning benefits. As a token of our appreciation, we will pay you £20 as honorarium for your participation.
We would like to ask for your consent formally, following the ethical guidelines of International Language Testing Association (www.iltaonline.com) and British Association for Applied Linguistics (www.baal.org.uk). All data collected for this research will be anonymised and used solely for this research in a fair and respectful manner, in its report and subsequent academic publications and disseminations. Your data will be protected in accordance with the Data Protection Act (1998).
We would be grateful if you could read this consent form carefully and sign below, and indicate how you would like your contribution to be acknowledged in the research report and any subsequent publications and disseminations based on this.
Your Chinese name [in print] Signature Date
- Please select either A or B for acknowledgement of your contribution to this research. I would like acknowledgement and thanks expressed generically, i.e. to the students at Zhejiang University. OR [please tick here I would like acknowledgement and thanks expressed to mention me explicitly, i.e. to the students at Zhejiang University including (my name). [please tick here
If you have any queries about the CogPro-2 project or this consent form, please get in touch.
Best wishes
YU Guoxing, PhD
Director of CogPro-2 Project,
University of Bristol
Appendix 4: Academic Writing Task 1 (Stage 1)
You should spend about 20 minutes on this task.
The following graph shows the total UK greenhouse gas (GHG) emissions between 1990 and 2003 in comparison to 1990 as 100 in different end users.
Summarise the information by selecting and reporting the main features, and make comparisons where relevant.
Write at least 150 words.

Appendix 5: Independent writing task (Stage 1)
You should spend about 40 minutes on this task.
Write about the following topic:
Once children start school, the teachers would have more influence on their intellectual and social development than parents.
To what extent do you agree or disagree?
Give reasons for your answer and include any relevant examples from your own knowledge or experience.
Write at least 250 words.
Appendix 6: Graphicacy questionnaire
This questionnaire will collect your personal information and your experience, familiarity and understanding of graphs including bar, line, chart, diagram, and table with numerical data (图表、数字统计图、数字统计表格、示意图、流程图等). You are asked to provide ONE answer by ticking the relevant box or filling the blank which describes best your OWN situation. Please answer them independently and honestly. There are no right or wrong answers.
For example: Male [√]
If you don’t fully understand a question, please ask the researcher for an explanation.
Personal information
- Your contact mobile phone number
- Your email address (Please print)
- Your CHINESE Name (Please print)
- Gender: Male [ ] Female [ ]
Questions on your graphicacy
Below are several statements concerning your experience, familiarity and preference in using graphs including bar, line, chart, diagram, and table with numerical data
(图表、数字统计图、数字统计表格、示意图、流程图等). Six examples of these graphs are given below. We will use GRAPHS as a generic term covering all these different types of graphs in this questionnaire, so your answer should reflect the AVERAGE of using these different types of graphs, unless otherwise stated in the question.

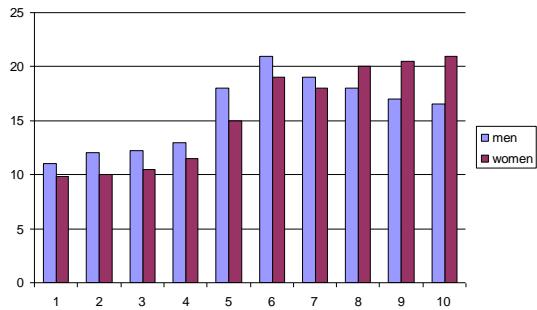

| Countries | Packaging | |
|---|---|---|
| Tonnes exported in bags | Tonnes exported in containers | |
| China | 652 | 2001 |
| India | 4361 | 5002 |
| New Zealand | 82 | 44032 |

QUESTIONS START HERE
Please tick ONE number which best describes your own situation. There is no right or wrong answer.
Scale: Never to Very often.
| Item | Scale (1-6) |
|---|---|
| 5. I use a special computer software to produce graphs. | [1] [2] [3] [4] [5] [6] |
| 6. As part of my academic study, I need to produce graphs. | [1] [2] [3] [4] [5] [6] |
| 7. As part of my academic study, I need to describe and interpret graphs. | [1] [2] [3] [4] [5] [6] |
| 8. I read graphs in popular press (e.g. magazines, newspapers). | [1] [2] [3] [4] [5] [6] |
| 9. When I read a graph, I try to identify the main trend or the overall pattern of the data that the graph presents. | [1] [2] [3] [4] [5] [6] |
| 10. When I read a graph, I try to think about the possible underlying reasons for the main trend or the overall pattern of the data the graph presents. | [1] [2] [3] [4] [5] [6] |
| 11. When I read a graph, I tend to study the details presented in the graph. | [1] [2] [3] [4] [5] [6] |
| 12. When I encounter a graph in a text in popular press (e.g. magazines, newspapers), I tend to ignore/skip it. | [1] [2] [3] [4] [5] [6] |
| 13. When I encounter a graph in an academic paper in my field, I tend to ignore/skip it. | [1] [2] [3] [4] [5] [6] |
| Strongly disagree → Strongly agree | |
| 14. I am familiar with reading bar graphs. | [1] [2] [3] [4] [5] [6] |
| 15. I am familiar with reading line graphs. | [1] [2] [3] [4] [5] [6] |
| 16. I am familiar with reading pie charts. | [1] [2] [3] [4] [5] [6] |
| 17. I am familiar with reading diagrams representing a process. | [1] [2] [3] [4] [5] [6] |
| 18. I am familiar with reading tables with numerical data. | [1] [2] [3] [4] [5] [6] |
| 19. I can notice errors or misinterpretations in graphs presented in popular press. | [1] [2] [3] [4] [5] [6] |
| 20. I can notice errors or misinterpretations in graphs presented in academic papers in my field. | [1] [2] [3] [4] [5] [6] |
| Strongly disagree → Strongly agree | |
| 21. I can recognise the different components of a graph (e.g. X and Y axes, legends, colours). | [1] [2] [3] [4] [5] [6] |
| 22. I can understand how the different components of a graph (e.g. X and Y axes, legends, colours) are combined to represent the data. | [1] [2] [3] [4] [5] [6] |
| 23. I can understand the relationships between a graph and the numerical data it represents. | [1] [2] [3] [4] [5] [6] |
| 24. I can identify the relationships or the patterns displayed in one graph. | [1] [2] [3] [4] [5] [6] |
| 25. I can identify the relationships or the patterns displayed in a few graphs about one similar theme. | [1] [2] [3] [4] [5] [6] |
| 26. I can tell when one type of graph is a better representation of the data than another. | [1] [2] [3] [4] [5] [6] |
| 27. I can identify a poorly constructed graph. | [1] [2] [3] [4] [5] [6] |
| 28. I can revise and improve a poorly constructed graph. | [1] [2] [3] [4] [5] [6] |
| 29. I can describe the general trend or overall pattern of a graph in words. | [1] [2] [3] [4] [5] [6] |
| 30. I can produce a graph to describe/convey the general trend or overall pattern of numerical data. | [1] [2] [3] [4] [5] [6] |
| 31. I find graphs useful to vividly represent the numerical data. | [1] [2] [3] [4] [5] [6] |
| 32. I find graphs helpful for me to remember the key information contained in the numerical data. | [1] [2] [3] [4] [5] [6] |
| 33. Graphs are a waste of space in a text. | [1] [2] [3] [4] [5] [6] |
| 34. I am concerned that I cannot fully demonstrate my writing ability in IELTS Academic Writing Task 1 because I am not good at describing graphs. | [1] [2] [3] [4] [5] [6] |
| 35. I may do better in IELTS Academic Writing Task 1 using familiar graphs than unfamiliar ones. | [1] [2] [3] [4] [5] [6] |
| 36. I would prefer one type of graph to be used in IELTS Academic Writing Task 1. | [1] [2] [3] [4] [5] [6] |
| 37. Special training on how to describe graphs would be helpful for me to get a higher score in IELTS Academic Writing Task 1. | [1] [2] [3] [4] [5] [6] |
| Not experienced at all → Very experienced | |
| 38. Overall, on a scale of 1-6, how would you rate your own experience in using graphs? | [1] [2] [3] [4] [5] [6] |
| Very weak → Very strong | |
| 39. Overall, on a scale of 1-6, how would you rate your own ability in describing and interpreting graphs? | [1] [2] [3] [4] [5] [6] |
ADDITIONAL COMMENTS you want to make about your experience, familiarity and proficiency of using graphs. You can respond in English and/or Chinese.
Thank you for completing this questionnaire.
(Note: This questionnaire is adapted from Yu et al. 2011)
Appendix 7: Questionnaire on computer familiarity and word processing
This questionnaire aims to understand your familiarity with using computers. It is not a test, there is no right or wrong answer. Read the questions below and fill in ONE circle for each question which best describes your own situation.
Your name: _ (Chinese)
| Question | Option 1 | Option 2 | Option 3 | Option 4 |
|---|---|---|---|---|
| How long ago did you get your own first computer? | >3 years ago | 1-3 years ago | < 1 year ago | Not available |
| How long ago did you get your own first computer? | ○ | ○ | ○ | ○ |
| How often do you use a computer in these places? | ≥4 times a month | 2-3 times a month | < 2 times a month | Never |
| (a) at home or university dormitory | ○ | ○ | ○ | ○ |
| (b) at university computer labs | ○ | ○ | ○ | ○ |
| (c) outside university (e.g. at Internet café, friend’s home) | ○ | ○ | ○ | ○ |
| How often do you do these things? | ||||
| (a) word processing in English | ○ | ○ | ○ | ○ |
| (b) word processing in Chinese | ○ | ○ | ○ | ○ |
| (c) reading from a computer screen | ○ | ○ | ○ | ○ |
| (d) sending emails in English via computer | ○ | ○ | ○ | ○ |
| (e) sending emails in Chinese via computer | ○ | ○ | ○ | ○ |
| How many hours, on average, do you spend each day on a computer (incl. desktop, laptop, tablet)? | >3 hours | 2-3 hours | < 2 hours | None |
| How many hours, on average, do you spend each day on a computer (incl. desktop, laptop, tablet)? | ○ | ○ | ○ | ○ |
| How familiar are you with using: | Very familiar | Familiar | A little familiar | Not at all familiar |
| (a) a desk top computer | ○ | ○ | ○ | ○ |
| (b) a laptop computer | ○ | ○ | ○ | ○ |
| (c) an iPad or other tablet | ○ | ○ | ○ | ○ |
| (d) a mouse (ball or touch pad)? | ○ | ○ | ○ | ○ |
| How familiar are you with: | ||||
| (a) word processing in English | ○ | ○ | ○ | ○ |
| (b) word processing in Chinese | ○ | ○ | ○ | ○ |
| (c) touch typing | ○ | ○ | ○ | ○ |
| (d) reading from a computer screen? | ○ | ○ | ○ | ○ |
| How many examinations have you taken on a computer? | ≥5 | 3-4 | 1-2 | None |
| How many examinations have you taken on a computer? | ○ | ○ | ○ | ○ |
| How would you rate your ability to use a computer generally? | Excellent | Good | Fair | Poor |
| How would you rate your ability to use a computer generally? | ○ | ○ | ○ | ○ |
Appendix 8: Stage 2 IELTS AWT1 Task 1
You should spend about 20 minutes on this task.
Figure 1 reports the total amount of credit card debt in a developed economy between 2003 and 2007, while Figure 2 reports the age distribution of people with credit card debt in 2007.
Summarise the information by selecting and reporting the main features, and make comparisons where relevant.
Write at least 150 words.
USD$ in Billions


Appendix 9: Stage 2 IELTS AWT1 Task 2
You should spend about 20 minutes on this task.
Figure 1 shows the carbon dioxide (CO2) emissions (1990-2008); and Figure 2, the sources for producing electricity (2008) in China.
Summarise the information by selecting and reporting the main features, and make comparisons where relevant.
Write at least 150 words.
thousand metric tons

Figure 1: China’s carbon dioxide emissions. (Source: United Nations Statistics Division)

Figure 2: Sources for electricity production in China (2008)
Appendix 10: Stage 2 IELTS AWT1 Task 3
You should spend about 20 minutes on this task.
The following graph shows the global fossil carbon emissions from 1880 to 2000.
Summarise the information by selecting and reporting the main features, and make comparisons where relevant.
Write at least 150 words.

Appendix 11: Stage 2 IELTS AWT1 Task 4
You should spend about 20 minutes on this task.
Table 1 shows the IELTS (International English Language Testing System) test-taker performance by geographic region in Asia in 2011; and Table 2, TOEFL-iBT (Test of English as a Foreign Language, Internet-based Test) test-taker performance in 2012.
Summarise the information by selecting and reporting the main features, and make comparisons where relevant.
Write at least 150 words.
| Geographic Region | Listening | Reading | Writing | Speaking | Overall |
|---|---|---|---|---|---|
| China, People’s Republic of | 5.8 | 5.9 | 5.2 | 5.3 | 5.6 |
| Hong Kong | 6.7 | 6.4 | 5.9 | 6.2 | 6.4 |
| Japan | 6 | 5.6 | 5.5 | 5.8 | 5.8 |
| Korea, South | 6.2 | 6.1 | 5.4 | 5.7 | 5.9 |
| Malaysia | 7.2 | 7 | 6.2 | 6.6 | 6.9 |
| Taiwan | 5.9 | 6 | 5.5 | 5.9 | 5.9 |
Table 1: IELTS test-taker performance by geographic region (2011).
Note: Maximum score for each skill and overall is 9.
| Geographic Region | Listening | Reading | Writing | Speaking | Total |
|---|---|---|---|---|---|
| China, People’s Republic of | 18 | 20 | 20 | 19 | 77 |
| Hong Kong | 20 | 19 | 22 | 21 | 82 |
| Japan | 17 | 18 | 18 | 17 | 70 |
| Korea, South | 21 | 21 | 22 | 20 | 84 |
| Singapore | 25 | 24 | 25 | 24 | 98 |
| Taiwan | 19 | 20 | 20 | 20 | 79 |
Table 2: TOEFL test-taker performance by geographic region (2012).
Note: Maximum score for each skill is 30, and total is 120.
Appendix 12: A screenshot of two-page view of a writing task as a fillable form in Adobe Reader

Appendix 13: Task instructions in Tobii Studio
Listen to instructions.
Please turn off your mobile phone and any electronic device.
This is one of the three tests you will do (randomly selected out of 4 tests). When you are presented the task, move mouse to the small highlighted text box on the top of the right page, enter your name in PiNYIN there; and then enter your writing in the big highlighted text box, any time during the 20 minutes allowed.
During the test, DO NOT use any of the menu. DO NOT attempt to change the view percentage of the document. DO NOT close the window until you are told to do so. DO NOT “save” the document because it is saved automatically.
There will be 5 minutes break between tests.
Appendix 14: Questions for stimulated retrospective interviews and focus-group discussions
- Briefing the purpose of the individual interviews and focus-group discussions: to better understand your thinking process when doing IELTS AWT1 tasks.
- Asking the students to talk about their experience of doing the AWT1 tasks, in particular, what is their general impression of the tasks, which task(s) do they find more challenging and why?
- In what ways do you think your AWT1 writing process may be affected by different graphs/prompts? Did you work differently for different graphs?
- In what ways do you think your AWT1 writing process may be affected by your familiarity with and comprehension of graphs?
- In what ways do you think your AWT1 writing process may be affected by your writing ability?
- Any other comments
Notes:
All participants to be interviewed individually immediately after the eye-track tests. The focus-group discussions will have 4-5 participants after all the eye-track tests are completed.
Selected episodes from the recorded eye-movement data will be replayed to assist the interviews and focus-group discussions
The interviews and focus-group discussions are recorded.
The focus-group discussion will be led by the students, facilitated by the researcher, in order to minimise the researcher’s influence on how the students respond to the guiding questions listed above and on how they interact with each other.
Appendix 15: Examples of gazeplots (screenshots)

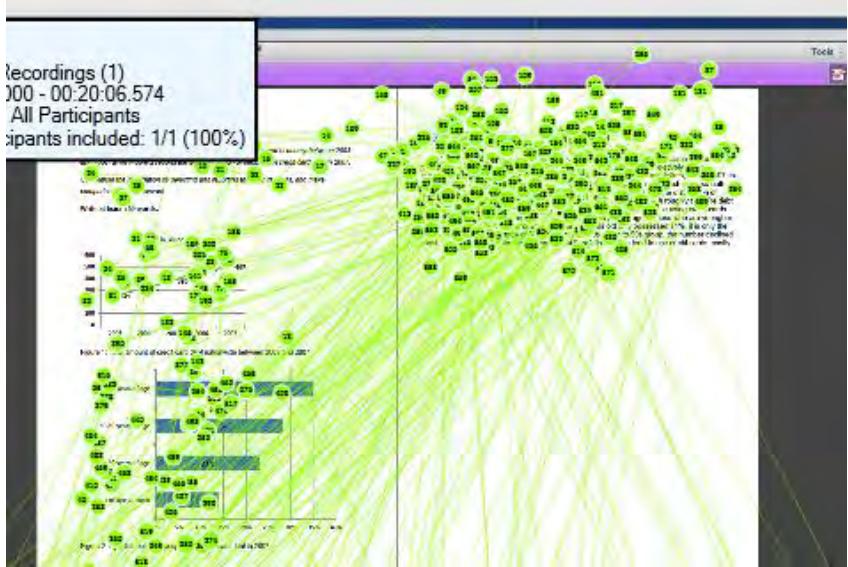

Appendix 16: Examples of heatmaps (screenshots)


Task 1 (N=22)
| E1 bargraph_Mean | E1 bargraph_Max | E1 bargraph_Min | E1 bargraph_Median | E1 bargraph_Stdev | |
|---|---|---|---|---|---|
| Mean | .1127 | .3568 | .0700 | .0982 | .0559 |
| Std. error of mean | .00343 | .05551 | .00000 | .00268 | .00789 |
| Median | .1100 | .2900 | .0700 | .1000 | .0500 |
| Std. deviation | .01609 | .26037 | .00000 | .01259 | .03699 |
| Skewness | 1.321 | 3.806 | .060 | 3.705 | |
| Kurtosis | 2.545 | 16.302 | -.323 | 15.693 | |
| Minimum | .09 | .13 | .07 | .08 | .03 |
| Maximum | .16 | 1.45 | .07 | .12 | .21 |
| Kolmogorov-Smirnov Z | 1.382 | 1.326 | 1.335 | 1.436 | |
| Asymp. Sig. (2-tailed) | .044 | .059 | .057 | .032 |
| E1 instructions_Mean | E1 instructions_Max | E1 instructions_Min | E1 instructions_Median | E1 instructions_Stdev | |
|---|---|---|---|---|---|
| Mean | .1445 | .5395 | .0700 | .1200 | .0832 |
| Std. error of mean | .00920 | .06076 | .00000 | .00668 | .00854 |
| Median | .1300 | .4250 | .0700 | .1050 | .0700 |
| Std. deviation | .04317 | .28500 | .00000 | .03132 | .04005 |
| Skewness | 1.189 | .835 | 1.105 | .898 | |
| Kurtosis | .792 | -.339 | .782 | .023 | |
| Minimum | .10 | .18 | .07 | .08 | .03 |
| Maximum | .25 | 1.12 | .07 | .20 | .17 |
| Kolmogorov-Smirnov Z | 1.045 | .915 | 1.118 | 1.031 | |
| Asymp. Sig. (2-tailed) | .225 | .372 | .164 | .238 |
| E1 linegraph_Mean | E1 linegraph_Max | E1 linegraph_Min | E1 linegraph_Median | E1 linegraph_Stdev | |
|---|---|---|---|---|---|
| Mean | .1218 | .4355 | .0668 | .1014 | .0636 |
| Std. error of mean | .00495 | .04734 | .00202 | .00380 | .00557 |
| Median | .1200 | .3850 | .0700 | .1000 | .0600 |
| Std. deviation | .02322 | .22206 | .00945 | .01781 | .02610 |
| Skewness | .812 | 1.151 | -3.370 | .554 | .851 |
| Kurtosis | .438 | .583 | 11.767 | -.284 | .364 |
| Minimum | .09 | .15 | .03 | .08 | .02 |
| Maximum | .18 | .97 | .07 | .14 | .12 |
| Kolmogorov-Smirnov Z | .786 | 1.112 | 2.324 | 1.209 | 1.113 |
| Asymp. Sig. (2-tailed) | .567 | .169 | .000 | .107 | .168 |
| E1 writingmain text_Mean | E1 writingmain text_Max | E1 writingmain text_Min | E1 writingmain text_Median | E1 writingmain text_Stdev | |
|---|---|---|---|---|---|
| Mean | .1345 | .7818 | .0677 | .1059 | .0836 |
| Std. error of mean | .00714 | .09653 | .00113 | .00425 | .00922 |
| Median | .1300 | .6650 | .0700 | .1000 | .0700 |
| Std. deviation | .03348 | .45274 | .00528 | .01992 | .04327 |
| Skewness | 1.380 | .985 | -2.394 | .827 | 1.691 |
| Kurtosis | 2.055 | .249 | 5.459 | .494 | 3.620 |
| Minimum | .10 | .25 | .05 | .08 | .04 |
| Maximum | .23 | 1.88 | .07 | .15 | .22 |
| Kolmogorov-Smirnov Z | .872 | .678 | 2.273 | 1.400 | .801 |
| Asymp. Sig. (2-tailed) | .433 | .748 | .000 | .040 | .542 |
Task 2 (N=20)
| E2 bargraph_Mean | E2 bargraph_Max | E2 bargraph_Min | E2 bargraph_Median | E2 bargraph_Stdev | |
|---|---|---|---|---|---|
| Mean | .1265 | .4930 | .0680 | .1075 | .0700 |
| Std. error of mean | .00466 | .03152 | .00156 | .00383 | .00503 |
| Median | .1200 | .4500 | .0700 | .1000 | .0700 |
| Std. deviation | .02084 | .14094 | .00696 | .01713 | .02248 |
| Skewness | .171 | .627 | -3.874 | .711 | .062 |
| Kurtosis | -1.147 | .042 | 15.534 | .699 | -1.026 |
| Minimum | .09 | .27 | .04 | .08 | .03 |
| Maximum | .16 | .82 | .07 | .15 | .11 |
| Kolmogorov-Smirnov Z | .830 | .772 | 2.295 | 1.428 | .730 |
| Asymp. Sig. (2-tailed) | .495 | .591 | .000 | .034 | .661 |
| E2 instructions _Means | E2 instructions _Max | E2 instructions _Min | E2 instructions _Median | E2 instructions _Stdev | |
|---|---|---|---|---|---|
| Mean | .1395 | .4950 | .0700 | .1165 | .0760 |
| Std. error of mean | .00694 | .04485 | .00000 | .00539 | .00646 |
| Median | .1400 | .5200 | .0700 | .1200 | .0750 |
| Std. deviation | .03103 | .20056 | .00000 | .02412 | .02891 |
| Skewness | .345 | .151 | .758 | .140 | |
| Kurtosis | -.314 | -1.009 | .912 | -.890 | |
| Minimum | .09 | .18 | .07 | .08 | .03 |
| Maximum | .20 | .87 | .07 | .17 | .13 |
| Kolmogorov-Smirnov Z | .577 | .602 | .840 | .608 | |
| Asymp. Sig. (2-tailed) | .893 | .862 | .480 | .854 |
| E2 piechart_Mean | E2 piechart_Max | E2 piechart_Min | E2 piechart_Median | E2 piechart_Stdev | |
|---|---|---|---|---|---|
| Mean | .1220 | .4825 | .0700 | .1030 | .0700 |
| Std. error of mean | .00395 | .04697 | .00000 | .00263 | .00562 |
| Median | .1150 | .4100 | .0700 | .1000 | .0600 |
| Std. deviation | .01765 | .21006 | .00000 | .01174 | .02513 |
| Skewness | .812 | .869 | -.004 | .995 | |
| Kurtosis | -.438 | -.318 | .178 | .394 | |
| Minimum | .10 | .23 | .07 | .08 | .04 |
| Maximum | .16 | .93 | .07 | .12 | .13 |
| Kolmogorov-Smirnov Z | 1.126 | .747 | 1.569 | .915 | |
| Asymp. Sig. (2-tailed) | .159 | .633 | .015 | .372 |
| E2 writingmain text_Mean | E2 writingmain text_Max | E2 writingmain text_Min | E2 writingmain text_Median | E2 writingmaintext_Stdev | |
|---|---|---|---|---|---|
| Mean | .1445 | .9935 | .0660 | .1145 | .0970 |
| Std. error of mean | .00705 | .11339 | .00169 | .00432 | .00935 |
| Median | .1400 | 1.0500 | .0700 | .1200 | .0950 |
| Std. deviation | .03154 | .50708 | .00754 | .01932 | .04181 |
| Skewness | .254 | .404 | -2.423 | .011 | .076 |
| Kurtosis | -1.168 | -.788 | 6.903 | -.195 | -1.182 |
| Minimum | .10 | .32 | .04 | .08 | .03 |
| Maximum | .20 | 1.95 | .07 | .15 | .17 |
| Kolmogorov-Smirnov Z | .588 | .558 | 1.798 | .948 | .604 |
| Asymp. Sig. (2-tailed) | .880 | .914 | .003 | .330 | .859 |
Task 3 (N=19)
| E3 instructions_Mean | E3 instructions_Max | E3 instructions_Min | E3 instructions_Median | E3 instructions_Stdev | |
|---|---|---|---|---|---|
| Mean | .1337 | .5142 | .0700 | .1132 | .0747 |
| Std. error of mean | .00681 | .08070 | .00000 | .00519 | .00770 |
| Median | .1300 | .4300 | .0700 | .1000 | .0700 |
| Std. deviation | .02967 | .35176 | .00000 | .02262 | .03356 |
| Skewness | .739 | 1.765 | .848 | 1.095 | |
| Kurtosis | .207 | 2.435 | .929 | .590 | |
| Minimum | .09 | .20 | .07 | .08 | .03 |
| Maximum | .20 | 1.40 | .07 | .17 | .15 |
| Kolmogorov-Smirnov Z | .560 | 1.201 | 1.072 | 1.048 | |
| Asymp. Sig. (2-tailed) | .913 | .112 | .201 | .222 |
| E3 linegraph_Mean | E3 linegraph_Max | E3 linegraph_Min | E3 linegraph_Median | E3 linegraph_Stdev | |
|---|---|---|---|---|---|
| Mean | .1237 | .5316 | .0663 | .1047 | .0668 |
| Std. error of mean | .00598 | .05907 | .00267 | .00504 | .00662 |
| Median | .1100 | .5000 | .0700 | .1000 | .0600 |
| Std. deviation | .02608 | .25747 | .01165 | .02195 | .02888 |
| Skewness | 1.480 | 1.375 | -3.892 | 1.431 | 1.374 |
| Kurtosis | 2.913 | 2.349 | 15.856 | 3.217 | 2.497 |
| Minimum | .09 | .23 | .02 | .08 | .03 |
| Maximum | .20 | 1.27 | .07 | .17 | .15 |
| Kolmogorov-Smirnov Z | .987 | .679 | 2.032 | 1.175 | .845 |
| Asymp. Sig. (2-tailed) | .284 | .746 | .001 | .126 | .473 |
| E3 writingmain text_Mean | E3 writingmain text_Max | E3 writingmain text_Min | E3 writingmain text_Median | E3 writingmain text_Stdev | |
|---|---|---|---|---|---|
| Mean | .1389 | .9416 | .0647 | .1074 | .0921 |
| Std. error of mean | .00904 | .16206 | .00269 | .00477 | .01249 |
| Median | .1300 | .6800 | .0700 | .1000 | .0800 |
| Std. deviation | .03943 | .70642 | .01172 | .02077 | .05442 |
| Skewness | 1.005 | 1.943 | -3.398 | .725 | 1.224 |
| Kurtosis | .665 | 4.450 | 12.939 | .080 | 1.345 |
| Minimum | .09 | .23 | .02 | .08 | .02 |
| Maximum | .23 | 3.15 | .07 | .15 | .23 |
| Kolmogorov-Smirnov Z | .735 | .847 | 1.558 | 1.178 | .728 |
| Asymp. Sig. (2-tailed) | .652 | .470 | .016 | .125 | .665 |
Task 4 (N=20)
| E4 Instructions_Mean | E4 Instructions_Max | E4 Instructions_Min | E4 Instructions_Median | E4 Instructions_ Stdev | |
|---|---|---|---|---|---|
| Mean | .1365 | .5430 | .0700 | .1140 | .0760 |
| Std. error of mean | .00670 | .06054 | .00000 | .00472 | .00716 |
| Median | .1350 | .5000 | .0700 | .1100 | .0750 |
| Std. deviation | .02996 | .27073 | .00000 | .02113 | .03202 |
| Skewness | .493 | .671 | .341 | .437 | |
| Kurtosis | -.318 | -.340 | -.572 | .358 | |
| Minimum | .09 | .17 | .07 | .08 | .02 |
| Maximum | .20 | 1.12 | .07 | .15 | .15 |
| Kolmogorov-Smirnov Z | .711 | .533 | .878 | .567 | |
| Asymp. Sig. (2-tailed) | .692 | .939 | .424 | .905 |
| E4 table1_Mean | E4 table1_Max | E4 table1_Min | E4 table1_Median | E4 table1_Stdev | |
|---|---|---|---|---|---|
| Mean | .1255 | .4960 | .0695 | .1055 | .0645 |
| Std. error of mean | .00626 | .05876 | .00050 | .00438 | .00694 |
| Median | .1200 | .4450 | .0700 | .1000 | .0650 |
| Std. deviation | .02800 | .26277 | .00224 | .01959 | .03103 |
| Skewness | .996 | 1.014 | -4.472 | 1.129 | .952 |
| Kurtosis | .547 | .841 | 20.000 | 1.151 | .641 |
| Minimum | .09 | .18 | .06 | .08 | .03 |
| Maximum | .19 | 1.17 | .07 | .15 | .14 |
| Kolmogorov-Smirnov Z | .833 | .512 | 2.408 | 1.612 | .803 |
| Asymp. Sig. (2-tailed) | .492 | .955 | .000 | .011 | .539 |
| E4 table2_Mean | E4 table2_Max | E4 table2_Min | E4 table2_Median | E4 table2_ Stdev | |
|---|---|---|---|---|---|
| Mean | .1235 | .4105 | .0700 | .1045 | .0625 |
| Std. error of mean | .00862 | .06285 | .00000 | .00505 | .00940 |
| Median | .1100 | .3200 | .0700 | .1000 | .0450 |
| Std. deviation | .03856 | .28108 | .00000 | .02259 | .04204 |
| Skewness | 2.072 | 1.783 | 2.021 | 2.035 | |
| Kurtosis | 5.439 | 3.795 | 6.042 | 5.234 | |
| Minimum | .08 | .13 | .07 | .08 | .02 |
| Maximum | .25 | 1.28 | .07 | .18 | .20 |
| Kolmogorov-Smirnov Z | 1.056 | .961 | 1.471 | .911 | |
| Asymp. Sig. (2-tailed) | .215 | .314 | .026 | .377 |
| E4 Writingmain text_Mean | E4 Writing maintext_Max | E4 Writing maintext_Min | E4 Writingmain text_Median | E4 Writingmain text_Stdev | |
|---|---|---|---|---|---|
| Mean | .1425 | 1.0020 | .0675 | .1115 | .0990 |
| Std. error of mean | .00876 | .15931 | .00099 | .00525 | .01233 |
| Median | .1400 | .7900 | .0700 | .1200 | .0900 |
| Std. deviation | .03919 | .71246 | .00444 | .02346 | .05515 |
| Skewness | .742 | .921 | -1.251 | .616 | .669 |
| Kurtosis | -.088 | .306 | -.497 | .778 | -.391 |
| Minimum | .09 | .22 | .06 | .08 | .03 |
| Maximum | .23 | 2.80 | .07 | .17 | .22 |
| Kolmogorov-Smirnov Z | .571 | .937 | 2.071 | .933 | .673 |
| Asymp. Sig. (2-tailed) | .901 | .344 | .000 | .349 | .755 |
Task 1
| E1 bargraph_Mean | E1 bargraph_Max | E1 bargraph_Min | E1 bargraph_Median | E1 bargraph_Stdev | |
|---|---|---|---|---|---|
| Mean | 1.8027 | 18.1682 | .0705 | .2605 | 4.5436 |
| Std. error of mean | .73995 | 10.41381 | .00045 | .03300 | 2.67944 |
| Median | .9850 | 7.5350 | .0700 | .1900 | 1.5950 |
| Std. deviation | 3.47066 | 48.84511 | .00213 | .15478 | 12.56771 |
| Skewness | 4.489 | 4.623 | 4.690 | .648 | 4.620 |
| Kurtosis | 20.648 | 21.554 | 22.000 | -.730 | 21.531 |
| Minimum | .11 | .13 | .07 | .07 | .03 |
| Maximum | 17.13 | 235.89 | .08 | .59 | 60.55 |
| Kolmogorov-Smirnov Z | 1.845 | 2.117 | 2.528 | .931 | 1.993 |
| Asymp. Sig. (2-tailed) | .002 | .000 | .000 | .352 | .001 |
| E1 instructions_Mean | E1 instructions_Max | E1 instructions_Min | E1 instructions_Median | E1 instructions_Stdev | |
|---|---|---|---|---|---|
| Mean | 2.5841 | 17.3986 | .0777 | .7923 | 4.2214 |
| Std. error of mean | .28935 | 1.42771 | .00588 | .07981 | .42171 |
| Median | 2.1600 | 16.3450 | .0700 | .7750 | 3.8550 |
| Std. deviation | 1.35717 | 6.69654 | .02759 | .37433 | 1.97802 |
| Skewness | 2.200 | .609 | 4.540 | .706 | 1.500 |
| Kurtosis | 4.588 | .252 | 20.982 | 1.082 | 2.092 |
| Minimum | 1.22 | 5.80 | .07 | .11 | 1.77 |
| Maximum | 6.62 | 33.23 | .20 | 1.75 | 9.47 |
| Kolmogorov-Smirnov Z | 1.347 | .500 | 1.978 | .928 | .951 |
| Asymp. Sig. (2-tailed) | .053 | .964 | .001 | .356 | .326 |
| E1 linegraph_Mean | E1 linegraph_Max | E1 linegraph_Min | E1 linegraph_Median | E1 linegraph_ Stdev | |
|---|---|---|---|---|---|
| Mean | 1.3464 | 12.6773 | .0695 | .3755 | 2.6005 |
| Std. error of mean | .22085 | 2.41920 | .00104 | .05328 | .57367 |
| Median | 1.0050 | 8.3700 | .0700 | .3850 | 1.6700 |
| Std. deviation | 1.03586 | 11.34707 | .00486 | .24991 | 2.69077 |
| Skewness | 2.937 | 1.851 | -2.890 | .632 | 2.642 |
| Kurtosis | 10.170 | 2.320 | 14.504 | -.463 | 6.840 |
| Minimum | .44 | 2.75 | .05 | .10 | .75 |
| Maximum | 5.29 | 41.07 | .08 | .93 | 11.82 |
| Kolmogorov-Smirnov Z | 1.294 | 1.414 | 2.307 | .845 | 1.687 |
| Asymp. Sig. (2-tailed) | .070 | .037 | .000 | .473 | .007 |
| E1 writingmain text_Mean | E1 writingmain text_Max | E1 writingmain text_Min | E1 writingmain text_Median | E1 writingmain text_Stdev | |
|---|---|---|---|---|---|
| Mean | 5.5209 | 53.0491 | .0705 | 2.0455 | 9.2482 |
| Std. error of mean | .92611 | 7.83164 | .00154 | .38676 | 1.65841 |
| Median | 4.9800 | 49.0650 | .0700 | 1.5200 | 8.2050 |
| Std. deviation | 4.34385 | 36.73364 | .00722 | 1.81407 | 7.77862 |
| Skewness | 2.931 | 2.233 | 3.268 | 2.558 | 2.992 |
| Kurtosis | 11.125 | 6.977 | 14.832 | 8.520 | 11.442 |
| Minimum | 1.28 | 12.51 | .06 | .46 | 1.77 |
| Maximum | 22.38 | 183.08 | .10 | 8.73 | 39.61 |
| Kolmogorov-Smirnov Z | 1.040 | .951 | 2.250 | .896 | .965 |
| Asymp. Sig. (2-tailed) | .229 | .326 | .000 | .398 | .309 |
| E2 bargraph_Mean | E2 bargraph_Max | E2 bargraph_Min | E2 bargraph_Median | E2 bargraph_ Stdev | |
|---|---|---|---|---|---|
| Mean | 1.4460 | 14.4300 | .0685 | .3905 | 2.7495 |
| Std. error of mean | .12225 | 1.95928 | .00150 | .04758 | .34078 |
| Median | 1.4550 | 11.1000 | .0700 | .3400 | 2.2750 |
| Std. deviation | .54670 | 8.76217 | .00671 | .21279 | 1.52401 |
| Skewness | .901 | 1.395 | -4.472 | .400 | 1.234 |
| Kurtosis | 1.886 | 1.685 | 20.000 | -1.057 | .974 |
| Minimum | .59 | 3.72 | .04 | .10 | .90 |
| Maximum | 2.98 | 38.49 | .07 | .78 | 6.44 |
| Kolmogorov-Smirnov Z | .615 | .949 | 2.408 | .663 | .919 |
| Asymp. Sig. (2-tailed) | .844 | .328 | .000 | .772 | .367 |
| E2 instructions_Mean | E2 instructions_Max | E2 instructions_Min | E2 instructions_Median | E2 instructions_Stdev | |
|---|---|---|---|---|---|
| Mean | 1.8340 | 11.7465 | .0730 | .7005 | 2.7635 |
| Std. error of mean | .08211 | 1.00190 | .00164 | .09061 | .18074 |
| Median | 1.7700 | 10.6900 | .0700 | .6650 | 2.7100 |
| Std. deviation | .36723 | 4.48065 | .00733 | .40521 | .80827 |
| Skewness | .067 | 1.198 | 3.015 | .840 | .394 |
| Kurtosis | -.997 | 1.276 | 9.995 | 1.174 | .219 |
| Minimum | 1.13 | 5.33 | .07 | .12 | 1.30 |
| Maximum | 2.47 | 22.10 | .10 | 1.77 | 4.45 |
| Kolmogorov-Smirnov Z | .686 | 1.148 | 2.052 | .537 | .582 |
| Asymp. Sig. (2-tailed) | .734 | .143 | .000 | .936 | .887 |
| E2 piechart_Mean | E2 piechart_Max | E2 piechart_Min | E2 piechart_Median | E2 piechart_Stdev | |
|---|---|---|---|---|---|
| Mean | 1.0135 | 7.8550 | .0700 | .3545 | 1.6370 |
| Std. error of mean | .09121 | .89771 | .00000 | .05449 | .15530 |
| Median | .9700 | 7.2600 | .0700 | .2850 | 1.5800 |
| Std. deviation | .40793 | 4.01469 | .00000 | .24367 | .69451 |
| Skewness | .687 | .881 | 1.265 | .625 | |
| Kurtosis | .872 | -.232 | 1.165 | -.150 | |
| Minimum | .43 | 3.39 | .07 | .09 | .57 |
| Maximum | 2.06 | 16.64 | .07 | .99 | 3.23 |
| Kolmogorov-Smirnov Z | .532 | .788 | .850 | .602 | |
| Asymp. Sig. (2-tailed) | .940 | .563 | .465 | .862 |
| E2 writingmain text_Mean | E2 writingmain text_Max | E2 writingmain text_Min | E2 writingmain text_Median | E2 writingmain text_Stdev | |
|---|---|---|---|---|---|
| Mean | 4.1460 | 43.9575 | .0715 | 1.6195 | 6.8005 |
| Std. error of mean | .49462 | 7.13337 | .00150 | .23259 | .98374 |
| Median | 3.5450 | 31.1500 | .0700 | 1.3550 | 5.6850 |
| Std. deviation | 2.21199 | 31.90138 | .00671 | 1.04018 | 4.39943 |
| Skewness | .433 | 1.314 | 4.472 | .911 | 1.180 |
| Kurtosis | -.920 | 1.572 | 20.000 | .040 | 1.749 |
| Minimum | 1.16 | 8.40 | .07 | .56 | 1.44 |
| Maximum | 8.61 | 131.56 | .10 | 4.14 | 19.14 |
| Kolmogorov-Smirnov Z | .691 | .895 | 2.408 | .750 | .661 |
| Asymp. Sig. (2-tailed) | .727 | .399 | .000 | .626 | .774 |
| E3 instructions_Mean | E3 instructions_Max | E3 instructions_Min | E3 instructions_Median | E3 instructions_Stdev | |
|---|---|---|---|---|---|
| Mean | 1.7268 | 11.6758 | .0705 | .5105 | 3.0274 |
| Std. error of mean | .21863 | 1.24062 | .00053 | .08629 | .43305 |
| Median | 1.3800 | 9.7800 | .0700 | .4100 | 2.3500 |
| Std. deviation | .95300 | 5.40774 | .00229 | .37611 | 1.88764 |
| Skewness | 1.832 | 1.550 | 4.359 | 1.447 | 1.962 |
| Kurtosis | 4.208 | 2.534 | 19.000 | 1.555 | 3.722 |
| Minimum | .72 | 5.92 | .07 | .12 | 1.40 |
| Maximum | 4.68 | 27.15 | .08 | 1.47 | 8.58 |
| Kolmogorov-Smirnov Z | .754 | .915 | 2.346 | .990 | .966 |
| Asymp. Sig. (2-tailed) | .620 | .372 | .000 | .281 | .308 |
| E3 linegraph_Mean | E3 linegraph_Max | E3 linegraph_Min | E3 linegraph_Median | E3 linegraph_ Stdev | |
|---|---|---|---|---|---|
| Mean | 2.1132 | 21.5058 | .0700 | .7537 | 3.6400 |
| Std. error of mean | .20873 | 2.99973 | .00000 | .09646 | .47660 |
| Median | 1.9300 | 16.6100 | .0700 | .6700 | 2.9000 |
| Std. deviation | .90984 | 13.07551 | .00000 | .42048 | 2.07747 |
| Skewness | 2.648 | 1.454 | .839 | 1.792 | |
| Kurtosis | 9.104 | 1.275 | .921 | 2.887 | |
| Minimum | 1.20 | 10.35 | .07 | .12 | 1.94 |
| Maximum | 5.35 | 52.39 | .07 | 1.79 | 9.56 |
| Kolmogorov-Smirnov Z | .840 | 1.069 | .637 | 1.037 | |
| Asymp. Sig. (2-tailed) | .480 | .203 | .811 | .233 |
| E3 writingmain text_Mean | E3 writingmain text_Max | E3 writingmain text_Min | E3 writingmain text_Median | E3 writingmain text_Stdev | |
|---|---|---|---|---|---|
| Mean | 4.1732 | 43.6416 | .0700 | 1.4458 | 7.1784 |
| Std. error of mean | .69762 | 6.33580 | .00076 | .29767 | 1.30088 |
| Median | 3.5300 | 41.9700 | .0700 | .9800 | 5.7100 |
| Std. deviation | 3.04087 | 27.61713 | .00333 | 1.29751 | 5.67042 |
| Skewness | 1.449 | .814 | .000 | 2.313 | 1.349 |
| Kurtosis | 2.417 | -.038 | 9.000 | 6.877 | 1.370 |
| Minimum | 1.11 | 8.69 | .06 | .22 | 1.34 |
| Maximum | 12.87 | 102.62 | .08 | 5.83 | 21.20 |
| Kolmogorov-Smirnov Z | .741 | .657 | 1.950 | .943 | .695 |
| Asymp. Sig. (2-tailed) | .642 | .781 | .001 | .337 | .719 |
| E4 Instructions_Mean | E4 Instructions_Max | E4 Instructions_Min | E4 Instructions_Median | E4 Instructions_Stdev | |
|---|---|---|---|---|---|
| Mean | 2.0305 | 22.0555 | .0710 | .5475 | 4.4200 |
| Std. error of mean | .21030 | 2.85047 | .00069 | .09756 | .55752 |
| Median | 1.8300 | 22.8500 | .0700 | .5200 | 4.4600 |
| Std. deviation | .94051 | 12.74768 | .00308 | .43630 | 2.49331 |
| Skewness | .996 | .375 | 2.888 | .967 | 1.059 |
| Kurtosis | 1.472 | -.804 | 7.037 | .081 | 2.225 |
| Minimum | .50 | 4.12 | .07 | .11 | .76 |
| Maximum | 4.38 | 45.67 | .08 | 1.45 | 11.57 |
| Kolmogorov-Smirnov Z | .575 | .507 | 2.358 | .924 | .614 |
| Asymp. Sig. (2-tailed) | .896 | .959 | .000 | .361 | .846 |
| E4 table1_Mean | E4 table1_Max | E4 table1_Min | E4 table1_Median | E4 table1_Stdev | |
|---|---|---|---|---|---|
| Mean | 1.8600 | 17.0825 | .0700 | .6035 | 3.3620 |
| Std. error of mean | .20271 | 1.34805 | .00000 | .11749 | .33927 |
| Median | 1.6850 | 17.5700 | .0700 | .5250 | 3.3600 |
| Std. deviation | .90656 | 6.02865 | .00000 | .52543 | 1.51728 |
| Skewness | 2.425 | .841 | 2.809 | 1.937 | |
| Kurtosis | 7.807 | 1.859 | 10.299 | 5.570 | |
| Minimum | .76 | 7.75 | .07 | .08 | 1.51 |
| Maximum | 5.04 | 33.69 | .07 | 2.55 | 8.34 |
| Kolmogorov-Smirnov Z | .869 | .679 | .982 | .902 | |
| Asymp. Sig. (2-tailed) | .436 | .745 | .290 | .390 |
| E4 table2_Mean | E4 table2_Max | E4 table2_Min | E4 table2_Median | E4 table2_ Stdev | |
|---|---|---|---|---|---|
| Mean | 2.0010 | 11.3080 | .0730 | .7795 | 2.8240 |
| Std. error of mean | .20588 | .99377 | .00252 | .15947 | .24095 |
| Median | 1.9700 | 10.5500 | .0700 | .5250 | 2.6600 |
| Std. deviation | .92071 | 4.44429 | .01129 | .71319 | 1.07757 |
| Skewness | .812 | .275 | 4.218 | 1.215 | .198 |
| Kurtosis | .408 | -.763 | 18.207 | .734 | -1.227 |
| Minimum | .81 | 5.08 | .07 | .10 | 1.41 |
| Maximum | 4.21 | 19.75 | .12 | 2.61 | 4.91 |
| Kolmogorov-Smirnov Z | .576 | .520 | 2.258 | .841 | .773 |
| Asymp. Sig. (2-tailed) | .894 | .950 | .000 | .480 | .589 |
| E4 Writingmain text_Mean | E4 Writing maintext_Max | E4 Writingmain text_Min | E4 Writingmain text_Median | E4 Writingmain text_Stdev | |
|---|---|---|---|---|---|
| Mean | 4.7445 | 42.0175 | .0705 | 1.8490 | 7.3875 |
| Std. error of mean | .66426 | 4.84617 | .00088 | .25013 | 1.14507 |
| Median | 4.4800 | 38.5750 | .0700 | 1.7750 | 6.2300 |
| Std. deviation | 2.97066 | 21.67275 | .00394 | 1.11860 | 5.12092 |
| Skewness | 1.922 | 1.773 | .531 | .323 | 2.859 |
| Kurtosis | 5.102 | 5.082 | 4.985 | -1.100 | 10.302 |
| Minimum | 1.34 | 9.22 | .06 | .23 | 1.86 |
| Maximum | 14.42 | 112.22 | .08 | 4.07 | 26.36 |
| Kolmogorov-Smirnov Z | .911 | .817 | 2.015 | .714 | .936 |
| Asymp. Sig. (2-tailed) | .378 | .517 | .001 | .687 | .345 |