
Test-takers’ IELTS preparations, their attitudes towards IELTS practices, and the use of technologies in the global pandemic
Official IELTS research report on Impact and Washback - IELTS on Computer; Impact and Washback - Test preparation; Technology; Test delivery, published in 2022.
Abstract
The importance of understanding test-takers’ perspectives has been emphasised in the language assessment literature (e.g., O’Sullivan & Green, 2011; Weir, 2005). This study explored test-takers’ perspectives on the current practices in IELTS in relation to the global pandemic situation. It further examined any differences in their use of test preparation resources across learners’ geographic locations and proficiency, as well as test types.
A total of 241 potential IELTS test-takers participated from three different geographic regions: South Korea, China, and the United States (approximately 80 from each country). They completed a survey which took about 60-90 minutes, and included background questionnaires, online and offline resource use, test-taker’s learning strategies, and their pandemic-related concerns. All participants were asked to provide brief online interviews at the end. Descriptive statistics, Exploratory Factor Analysis (EFA), factorial ANOVAs were performed to examine general patterns and mean differences of perceptual and attitude scores.
The results showed that no significant main effects or interactions emerged for country, test type, or proficiency. This indicates that the pandemic impacted all groups of test-takers to a similar degree when considering impacts as a group. On average, most of the participants mentioned that they thought about delaying IELTS or had to delay/cancel IELTS at some point, i.e., near the midpoint (50 on the 100-point scale). U.S. participants reported using websites (k = 113) more than Chinese (k = 55) and Korean (k = 83) participants. The most frequently reported websites were ielts.org and several news sites (e.g., BBC, CNN, VOA). However, all participants from the three countries seemed to use online resources every day and find them useful.
Overall, the findings offer important implications for test development and administration, and language assessment and learning.
Authors’ biodata
Okim Kang
Okim Kang is Professor of Applied Linguistics and Director of the Applied Linguistics Speech Lab at Northern Arizona University, Flagstaff, Arizona. Her research interests include speech production and perception, L2 pronunciation and intelligibility, L2 oral assessment and testing, automated scoring and speech recognition, World Englishes, and language attitude.
Kevin Hirschi
Kevin Hirschi is a doctoral candidate in Applied Linguistics at Northern Arizona University. His primary research interests lie at the intersection of second language pronunciation and technology, including technology-assisted pronunciation training for second language learners, corpus linguistic approaches to descriptions of phonological phenomena, and the impacts of pronunciation training on human perception of accented speech.
Yongzhi Miao
Yongzhi (Vito) Miao is a PhD student in Applied Linguistics at Northern Arizona University. Inspired by his exposure to a variety of English accents in China, England, and California, he studies L2 listening and speaking, with which he hopes to promote language learning, testing, and social justice in light of the global use of English.
Hyunkee Ahn
Hyunkee Ahn is a full Professor at the Department of English Language Education, Seoul National University, South Korea. He earned a PhD in Linguistics (phonetics) in 1999 from the University of Texas at Austin, USA. His research is currently on applied/L2 phonetics, pronunciation teaching and learning, and language assessment.
Yongkook Won
Yongkook Won is a visiting researcher at the Center for Educational Research, Seoul National University, and teaches an English Education and Big Data course for graduate students at the International Graduate School of English. His recent research focuses on investigating fairness in language testing, designing algorithms for automated essay/speech assessment, and enhancing language teaching and learning using AI-based language learning tools.
1 Introduction
IELTS is a high-stakes test used to measure the proficiency of English learners intending to study at a tertiary institution or meet proof of language requirements for employment or immigration. It is widely used, with more than 1100 testing centres across over 140 countries (www.idp.com/global/ielts). Accordingly, how test-takers prepare for their IELTS test and perceive current IELTS practices can be of importance to both IELTS test-takers and examiners. It can also inform test development and administration, as well as language assessment and learning in general. The current study explored IELTS test-takers’ test preparation efforts and their attitudes towards IELTS practices. It also investigated test-takers’ needs in the fast-growing technology era, especially in relation to the global pandemic situation.
Technological advancements have introduced affordable, powerful computer systems that take advantage of rapid communication networks. The influence of such technology-oriented changes has extended the modes of test delivery, administration, and preparation (Chou et al., 2017). Overall, this study aimed to explore test-takers’ preparation methods using different resources, their perspectives on the use of technologies in language testing, and the impact of the global pandemic on their test preparation and experience. It further examined to what extent the above phenomena interacted with test-takers’ proficiency, test types, and geographic locations.
2 Background
2.1 Test-takers’ preparation practice for the IELTS tests
Examining insights into IELTS test-takers’ preparation methods is crucial, because IELTS could provide advice to prospective test-takers regarding how to best prepare for IELTS based on this information. It can also ensure test fairness to different test-takers because they are entitled to access sufficient test preparation resources to enhance their best test performance (Chappell et al., 2019). Without sufficient or proper preparation, however, test-takers’ performance can be negatively influenced (see Gardine & Howlett, 2016; Stankov et al., 2012).
2.1.1 The effectiveness of IELTS preparation courses
Research about test preparation has mainly focused on the effectiveness of IELTS preparation courses and the use of different self-study methods. In the first line of research on the effectiveness of IELTS preparation courses, studies have generally provided mixed findings. For example, while some studies found that such preparation courses were not effective (Celestine & Ming, 1999), others suggested that they were useful, at least for lower-level students (Gan, 2009). On the other hand, IELTS preparation courses were found to be particularly effective for listening (Nguyen, 2007), but not necessarily for writing (Green, 2007). However, the relationships between preparation methods and test-takers’ proficiency levels are only partially understood. Examining the relationship between preparation classes and score gains would be of use to both examinees and examiners. Specifying different skill areas (e.g., listening) rather than the overall effect would provide a more finely grained perspective. In addition, very few previous studies examined how test preparation could vary across different geographic locations, test types, or learners’ proficiency levels. Accordingly, the current study involved three different countries (Korea, China, and the U.S.) for this topic of investigation by examining IELTS Academic and IELTS General Training separately.
2.1.2 The use of test-preparation resources and different test types
To comprehensively understand contextual and learner factors that drive successful self-study methods for IELTS preparation, consideration of learner motivations for taking IELTS, test types, and resource availability is necessary. A few studies investigated IELTS preparation methods, including test-takers’ use of both online and offline resources. For example, Kang et al. (2021) examined IELTS preparation methods both in class and out of class, as well as using English to communicate with native, non-native speakers of English and family members from a longitudinal perspective (12 weeks) of Korean IELTS test-takers. The study also explored the effect of using online resources (e.g., online gaming, social media, and music or movies) on the improvement of English skills and IELTS score gains. Their findings reported that the use of these online resources (e.g., social media or online gaming) was not necessarily related to IELTS test-takers’ score improvement but it was limited to one country (Korea).
In Mickan and Motteram’s (2006) study, 78 participants in South Australia incorporated a range of activities into IELTS preparation, including attending English classes, using textbooks and websites, and completing practice tests. The study also: examined participants’ test-taking tips and time management during the test; analysed the test format; received feedback from teachers; and chatted with (especially L1 English) friends. It was found that about of test-takers reported not having taken any of the test preparation courses, especially among those who were taking IELTS General Training. Similarly, Chappell et al. (2019) asked 679 participants to check what methods they used to prepare for IELTS on their own (e.g., completing sample tests) and what other preparation methods they employed in their everyday life (e.g., reading books in English). Overall, test-takers used a range of methods to prepare for IELTS, of which the most popular were practicing with sample tests, reading books or articles in English, watching videos online of teachers’ tips, speaking to fluent English speakers, taking IELTS preparation classes, and watching TV in English. Although researchers tried to include both online and offline IELTS preparation methods, relevant online preparation methods were not comprehensive. Future research is thus needed to provide a more thorough picture of the different online resources used for IELTS preparation, especially for different test types (e.g., IELTS Academic and IELTS General Training).
In addition, learners’ test preparation can vary depending on the type of test they are interested in (e.g., IELTS Academic and IELTS General Training). Most studies, however, control this test variable and focus on one test type (e.g. Kang et al., 2021, focused on IELTS Academic), or they do not examine the relationship between test type and test preparation styles (e.g., Chappell et al., 2019; Mickan & Motteram, 2006). This gap of knowledge is important because the target language use domain represented by the two IELTS task types are arguably different, i.e., one focusing on academic and the other on day-to-day life. Thus, there is reason to believe that test-takers would adopt different strategies to prepare for these two types of tests with different purposes. Answers to this question would benefit test-takers of both task types for more efficient preparation.
2.1.3 IELTS preparation methods across different geographic locations
While Mickan and Motteram (2006) and Chappell et al. (2019) provided information about different IELTS preparation methods test-takers employed, it was unclear whether these methods differed by contextual factors such as geographic locations. Addressing this question, O’Sullivan et al. (2019) asked over 6000 test-takers from Southeast Asia, Central and South America, and the Middle East and North Africa to rank 12 different preparation methods based on their usefulness, including completing practice tests on electronic devices, practising materials on paper, consulting online tutors to correct writing or speaking, practising timed or untimed tests, watching videos of preparation classes, watching videos or audios with tips from teachers and students.
Their results suggested that the three different geographic locations did not differ significantly regarding their test-takers’ preferences over IELTS preparation tests. However, the number of items investigated in this study was somewhat limited (i.e., only 12 items) and it was not clear how these items were selected and developed. Future studies are thus warranted to gain a further understanding of test-takers’ preparation efforts in relation to their use of resource availability. These efforts can inform future IELTS examinees about their effective IELTS preparations.
2.1.4 IELTS preparation methods across different proficiency levels
Most studies investigating IELTS preparation methods sought to provide a descriptive account of the varieties of methods employed (Chappell et al. 2019; Kang et al., 2021; Mickan & Motteram, 2006; O’Sullivan et al., 2019). In these studies, preparation methods were treated as a relatively stable phenomenon, but the interaction of test preparation with other variables, such as test-takers’ proficiency or test type, was not explored widely. In general, second language learners’ proficiency was found to mediate their language learning strategies (Green & Oxford, 1995; Khaldieh, 2000; Wharton, 2000). For example, Green and Oxford (1995) found that higher proficiency learners were associated with more strategic behaviours used than lower proficiency learners. Moreover, proficiency was also found to be associated with the quality or effectiveness of strategies used (Chen, 1990).
Specific to the language assessment context regarding test-taking strategies, several findings emerged. First, high proficiency test-takers tended to employ more strategies in addressing different questions (Ghafournia & Afghari, 2014). Building on this, it was also found that high proficiency test-takers attended to an interactive approach with both top-down and bottom-up perspectives (Flowerdew & Miller, 2005), compared to lower-level test-takers whose primary focus was individual lexical items (Yamashita, 2003). Taken together, test-takers’ strategies differ quantitatively and qualitatively depending on their proficiency level. This discussion highlights the potential of proficiency in mediating test-takers’ use of preparation methods, which would be empirically investigated in the present report.
2.2 Test-taker perspectives on IELTS practice
2.2.1 Test-takers’ attitudes towards IELTS in general
In the assessment literature, scholars have argued that test-takers’ attitudes towards, and perspectives of, a test can potentially influence their test performance (Bachman & Palmer, 2010; Kane, 2006; Messick, 1989). This implies that it is crucial for testing agencies to explore test-takers’ attitudes and make adjustments accordingly, so as to ensure that the test provides a more valid measure of test-takers’ proficiency.
Moreover, understanding test-takers’ perceptions may help access their lived experiences of validity which may lead to a more socially responsive enactment of language testing and assessment (Hamid, 2014; Hamid et al., 2019). Growing research attention has been given to IELTS test-takers, albeit with mixed findings. In Chappell et al. (2019), for example, some test-takers argued that IELTS indeed provided a valid proficiency assessment of their English skills, but others complained about the variability of scores (when they had to take IELTS multiple times) and about the time and financial commitment to prepare for, and attend, a test. IELTS would benefit from a systematic investigation of test-takers’ perspectives of the current IELTS practice, especially in the technology-dependent context in the global pandemic situation.
2.2.2 Test-taker attitudes towards computer-based assessment
In global applications of technology-assisted language testing, issues related to construct representation, bias, and cheating have often been raised (Wagner & Kunnan, 2015). Overall, test-takers generally seem to prefer in-person speaking assessment compared to computer-based speaking assessment (e.g., Kiddle & Kormos, 2011). Then, they preferred computer-based assessment of other skills than speaking (e.g., reading, see Fan & Ji, 2014). Although test-takers oftentimes did not prefer the ‘online’ version, it is important to tease apart the ‘synchronous, person-to-person’ online version and the ‘asynchronous, person-to-machine’ version for a more elaborate discussion. Research generally suggested that test-takers would prefer person-to-person interaction during the speaking exam, especially because of the interaction embedded in the test format and the associated improved test experience (McNamara, 1987; Qian, 2009). However, while these studies attempted to provide a collective result, it is important to understand test-takers’ preferences as a function of their own circumstances.
Overall, test-takers are somewhat hesitant about computer-based speaking assessment, but more flexible with other skills than speaking. However, research on test-takers’ perception of technology use in high-stakes L2 assessment has been limited at large. Amongst these studies, most did not explicitly address the IELTS test, and were conducted prior to the global pandemic. Therefore, it remained unclear to what extent test-takers prefer computer-based IELTS tests including the speaking section in a context-specific manner (i.e., specific to IELTS and after/during the pandemic).
2.3 Impact of the global pandemic on language assessment
The global pandemic has challenged the administration and delivery of high-stakes English proficiency tests (Harding & Winke, 2021; Muhammed & Ockey, 2021). This inevitably affects multiple stakeholders of the tests, including testing agencies, test-takers, and parties accepting the test scores such as universities (Ockey, 2021). Due to the recency of the event, few studies have explored the effect of the global pandemic on language assessment. Most of the studies thus far have focused on how test administrators adapted existing versions of the tests to cater for safety / lockdown requirements during the pandemic. For example, Ockey et al. (2021) described how Iowa State University modified its English placement test of oral communication, such that it was held face-to-face outdoors, instead of indoors to maintain social distance. Purpura et al. (2021) discussed the changes being made to the placement test for a community English language program at the Teacher’s College Columbia, including the addition of online remote proctoring to enable tests at home. Many more university placement tests were differently adapted in their own contexts (Green & Lung, 2021; Wagner & Krylova, 2021).
While more studies were conducted locally, fewer investigated the modifications being made in international English tests such as IELTS and TOEFL. Among these studies, Papageongiou and Manna (2021) described the promotion of TOEFL iBT Home Edition, which allowed test-takers to complete the TOEFL test online at home, compared to at a testing centre prior to the pandemic. Similarly, Clark et al. (2021) described the changes being made to IELTS in the marketing of IELTS Indicator, which was an at-home test for prospective IELTS test-takers. Isbell and Kremmel (2020) provided a timely report comparing different tests available during the global pandemic in terms of their strengths and limitations.
Most studies investigated the effect of the global pandemic on test administrators, with little research into exploring test-takers’ perceptions of this pandemic on their test practice. Very recently, Clark et al. (2021) reported that IELTS test-takers held positive attitudes towards the IELTS Indicator.
Still, it is somewhat unclear how test-takers across different geographic locations are affected by the global pandemic. This information can be of use to testing agencies as it can provide tailored support for different groups of test-takers to prepare for any unexpected situations in the future. Therefore, the present study aims to provide a timely response to this question by addressing the differential impact of the pandemic on test-takers’ preparations in different geographic locations.
3 METHODOLOGY
3.1 Research questions
This study was guided by the following research questions.
- What kinds of resources do test-takers use to prepare for their IELTS test and how are they different in different geographic locations by different test types, and by proficiency?
- What are test-takers’ perspectives on their use of technologies for language testing and how are they different in different geographic locations by different test types, and by proficiency?
- What are test-takers’ perspectives on the current IELTS practices in the global pandemic situation and how are they different in different geographic locations by different test types, and by proficiency?
3.2 Research methods and design
The current study adopted a cross-sectional, correlational, mixed-methods research design. A cross-sectional design was employed to capture the current global pandemic-related perspectives. The study also adopted a correlational design because it made no attempts to control or manipulate variables so as to preserve the ecological validity of the findings (Rose et al., 2019). The study investigated 241 IELTS test-takers’ preparation methods for IELTS, their perceptions of computer-based assessment, and the effect of the global pandemic on their IELTS practices. The data collected were both quantitative (online survey responses) and qualitative (open-ended comments and follow-up email interviews). Qualitative data were used to corroborate quantitative data and to provide further explanations (see Creswell & Clark, 2007; Mackey & Gass, 2021).
3.3 Participants
Participants included 241 IELTS test-takers who were either: a) studying for IELTS; b) planned to take it in 12 months; or c) had taken it in the past 12 months from when the study took place. These participants were roughly equally distributed across three geographic locations in South Korea (n = 81), China (n = 80), and the U.S. (n = 80). The age of participants from China (M = 21.75, SD = 1.25) was slightly lower than those from South Korea (M = 26.81, SD = 7.04). Comparatively, in the U.S., test-takers’ age differed significantly. Amongst the reported data (n = 22), the mean age was 31.41 years (SD = 6.06). In terms of gender, 41% of the test-takers in South Korea reported being male, 41% being female, and 18% preferred not to share. In China, 75% of the test-takers were female and 25% were male. In the U.S., 45% were female, 45% male, and 10% preferred not to share. Participants in South Korea and China spoke a generally homogenous first language (Korean and Chinese respectively), whereas those from the U.S. spoke diverse first languages (30%+ Hindi, 8%+ English of different varieties, 7% Spanish, 7% Chinese, and others).
Their self-reported proficiency in English based on four questions on 5-point Likert scales on listening, speaking, reading, and writing (Cronbach’s ) was significantly different in each location ( , , CI [.279, .454]), with U.S. participants reporting being the most proficient (M = 4.19, SD = 0.64), followed by those in China (M = 3.43, SD = 0.53) and South Korea (M = 2.02, SD = 0.82). In terms of the subskills, the U.S. participants reported higher scores in all categories than did Chinese and Korean participants. Table 1 below provides a summary of the proficiency levels of the self-reported proficiency amongst the participants.
Table 1: Participants’ self-reported proficiency on a 5-point Likert scale
| OverallM (SD) | Listening | Speaking | Reading | Writing | |
|---|---|---|---|---|---|
| U.S. | 4.19 (0.64) | 4.32 (0.72) | 4.14 (0.73) | 4.32 (0.75) | 3.95 (0.73) |
| Chinese | 3.43 (0.53) | 3.57 (0.77) | 3.07 (0.83) | 3.89 (0.65) | 3.16 (0.79) |
| Korean | 2.02 (0.82) | 3.17 (0.99) | 2.76 (1.02) | 3.10 (1.08) | 2.65 (1.02) |
The type of IELTS the participants intend to take / had already taken was also different. While the majority of participants in the U.S. indicated IELTS General Training (72.5%), those in South Korea (90%) and China (74%) mostly indicated IELTS Academic. Similarly, the majority of the test-takers across all locations took IELTS because they wanted to travel to different places (68%-86%). In addition, Korean test-takers took IELTS for work (51%) and to attend undergraduate programs (33%), Chinese test-takers took it to attend both undergraduate (26%) and postgraduate programs (70%), and U.S. test-takers took IELTS mainly for immigration (74%) and work (25%). Among the participants in the U.S. and China, 26% reported never having taken IELTS before, about 50% had taken it once, and about 20% had taken it twice or more. Comparatively, in South Korea, about 50% reported not having taken IELTS, about 20% had taken it once, and 25%, twice or more.
3.4 Materials
An online questionnaire was used to collect data in this study. There are five parts to the questionnaire: background survey; survey of online resources and evaluation; survey of offline resources; survey of test-takers’ attitudes towards computer-based IELTS assessment; and survey of pandemic-related questions. This section introduces these elements of the survey.
3.4.1 Background survey
Participants completed a background questionnaire that elicited information about their first and additional language(s), geographic location, self-reported proficiency, type of IELTS tests they would take / had taken, reasons for taking IELTS, time spent in IELTS preparation, experience with IELTS tests, and most recent IELTS test scores (if any).
3.4.2 Survey of online resources and evaluation
Participants were asked to name three most frequently used online resources, identify their types (e.g., a mobile app, an online course), and to provide the purpose of these resources (e.g., specific to IELTS preparation, for general English skills). They then provided qualitative comments on the advantages and limitations of the resources they used to prepare for their IELTS tests. The resources they provided were then subject to a systematic evaluation based on the frequency of use (e.g., I use this resource often), perceived effectiveness (e.g., I think that I improved my speaking with this resource), perceived value (e.g., This resource motivates me to study for IELTS), and valence (i.e., personal needs and preferences; e.g., I like the way I learn using this resource). These questions (k = 14 in total) appeared on 100-point Likert scales (0 = not at all, 100 = very much).
Note that the use of the 100-point Likert scales was intentional. This approach can be controversial when participants are making perceptual decisions. In the contexts of language assessment or speech perception, the scales that employ minimally explicated scales (i.e., only endpoints are anchored) can give participants difficulty in their application (Yan & Ginther, 2017). In fact, it is possible that when scale points are used, participants may not be able to tell the difference between some of the scale points (e.g., 7-points or 9-points) and therefore may not use all scale levels (Isaacs & Thomson, 2013; Isbell, 2017). Given that a scale choice is a complex process, the current study underwent a series of pilot studies with potential participants in the three different countries (Korea, China, and the U.S.). After that, the 100-point scales were selected for the final use of survey responses because participants expressed their preference for this scale type and it was believed that it could help resolve the avoidance of certain level points and made data collection consistent.
Nonetheless, we acknowledge many methodological limitations regarding the use of 100-point scales in the present report. First, despite the hope that participants would fully utilise the scale, it was possible that they used them by 10-unit increments as a 10-point scale. To address this concern, a visual inspection of the data was performed. Although it is true that a few participants’ ratings were at units of 10, most of them used the scale fully as we’d hoped. This reflected the informal comments made by our piloting participants. Second, scholars expressed their concerns regarding the use of odd-numbered scales, as they allowed participants not to express their stance. To address this concern, we visually inspected our data. This inspection revealed almost no participants chose to rate ‘50’. Moreover, despite the concern of participants not expressing their stance, we believe that a mid-point can sometimes be a genuine reflection of participants’ stance on a particular phenomenon. This stance would have been methodologically avoided had we used an even-number scale. For the reasons outlined above, we reserved the use of a 100-point scale and believed that it worked reasonably effectively in the study. However, we acknowledge that the choice of scales is indeed a methodological concern in any study using Likert-scales to collect data. While scale validation extends beyond the scope of the present report, we believe that a validation study is much needed to shed light on this very under-researched area.
3.4.3 Survey of offline resources
A total of 23 scales were used to examine test-takers’ use of offline resources to prepare for IELTS alone (k = 13; e.g., complete IELTS practice exams) and with other people (k = 10; e.g., participate in a conversation group). These questions appeared on 100-point Likert scales (0 = never, 100 = very frequent). To ensure these questions were representative and systematic, many of them were taken from recent studies on IELTS (e.g., Kang et al., 2021; Liu, 2013). Moreover, the research team informally approached experienced IELTS instructors and test-takers about some IELTS preparation methods which were particularly popular in their context and introduced many new items to be included in the current version of the survey accordingly. For the development of these items, IELTS IDP in Australia was consulted.
3.4.4 Survey of test-takers’ attitudes towards technology-based IELTS assessment
Five items were used to investigate IELTS test-takers’ perceptions towards technology-based assessment regarding the IELTS test. They appeared on 100-point Likert scales (0 = not comfortable at all, 100 = extremely comfortable). The questions asked how comfortable they would feel when taking: a) a paper-based test at a test centre; b) a computer-based test at a test centre; c) a computer-based test at home; d) the speaking section on a computer at a testing centre; and e) the speaking section on a computer at home.
3.4.5 Survey of pandemic-related questions
Eight items were used to investigate the effect of the global pandemic on IELTS test-takers’ test experience. They appeared on 100-point Likert scales (0 = completely disagree, 100 = completely agree). Participants had the opportunity to check ‘not applicable’ if they believed that the statement was irrelevant. Sample statements included ‘I had to change my IELTS testing centre’. Additionally, participants had the opportunity to verbally describe other ways in which the pandemic influenced their experience with IELTS in terms of attending or preparing for the test.
3.5 Data collection procedure
To recruit participants in China and South Korea, the project was introduced to a designated coordinator in each country. In the U.S., participants were recruited through personal contacts at various universities of the research team. Moreover, this recruitment was greatly supported by IELTS USA which distributed posters advertising the study to IELTS test-takers at their local testing / learning centres. For U.S. participants specifically, a screening questionnaire was developed to ensure that the participants had met the inclusion criteria via self-report. The team checked each participant’s information before sending the main questionnaire link to eligible participants.
All participants were informed of the length of the online questionnaire (approximately 60-75 minutes). They were recommended to complete the survey in one setting. There was a brief instruction about the purpose of the study and compensation procedures before participants moved on to the main questionnaire. All participants had the opportunity to use their first language in completing the qualitative parts to ensure maximum input from them. Participants who completed all survey responses were compensated with a gift card in the value of US$40 (or equivalent). Upon completion of the questionnaire, a follow-up email was sent to participants whose answers were unclear or ambiguous for clarifications.
3.6 Data analysis
In order to address the research questions, a number of statistical approaches were employed. Descriptive statistics, including response tabulations and item response mean and standard deviations were calculated. Proficiency was converted into a two-level categorical variable (high, low) using a cut point established by comparing participant reported IELTS results and self-reported proficiency scores. A level equivalent of the IELTS 7.0 band was chosen because: a) according to IELTS (n.d.), an overall score of 7.0 is a benchmark for good users who handle complex language generally well; and b) many universities set 7.0 as their benchmark for functional proficiency in academic setting. In addition, the cut-off of this band score 7.0 created a meaningful and relatively balanced distribution between two groups in the current study (96 high proficiency, 145 low proficiency). Note that proficiency was intentionally treated as a categorical variable to examine any interaction effects with country and task type variables.
For research question one (i.e., resource type in relation to participant country, test type, and proficiency), separate analyses were conducted for online resources, offline resources alone, and offline resources with peers. To give an overview of online resource use, tabulations were calculated for type of resource by country, participant test type (IELTS Academic, General Training, both/unsure), and proficiency (high and low). Chi-squared tests with Kramer’s V effect size calculation were used to indicate significant differences between groups of participants and the types of online resources they reported. Post-hoc comparisons with Bonferroni adjustments were also conducted to indicate the extent to which the group-by-group comparisons varied.
For the online resource items, data were transformed into a long form as each participant reported on and provided their perceptions of three different online resources. In order to examine interaction effects for participant type amongst the constructs by reducing the number of variables, raw response scores were subjected to an Exploratory Factor Analysis (EFA) with a ProMax rotation for Principal Axis extraction by subsection of the survey (i.e., separate factor analyses for offline resources accessed alone, offline resources with peers, online resources, technology, and pandemic-related items).
Mean imputation was used for partially missing item response data (i.e., the participant selected N/A when indicating the impact of the pandemic resulted in them changing their intended IELTS testing centre). Each subsection of the survey was subjected to the Kaiser-Meyer-Olkin measure of sampling adequacy and Bartlett’s test of sphericity in order to examine the sampling and factorability of the data. The resulting factor scores were appended to the participants’ records and served as a dependent variable for comparison of country, test type, and proficiency. Then, factorial ANOVAs were run setting the factor loading(s) as the dependent variable and the country (China, Korea, the U.S.), test type (General, Academic, or other/unsure), and proficiency (high, low) as independent variables. Post-hoc comparisons were made with Tukey HSD adjustments.
To compare perceptions of the online resources across country, test type, and proficiency (i.e., high or low), factor scores served as the dependent variable for factorial ANOVA comparisons. Item-level descriptive statistics of the significant predictors were calculated to provide the granularity of group differences. Similar analyses were conducted of offline resources alone, which resulted in a different factor structure than offline resources done with peers.
For research questions two (i.e., use of technology in testing) and three (i.e., the effect of the global pandemic), similar analyses were conducted with EFAs and factorial ANOVAs comparing the factor loading scores for each section with the predictors of country, test type, and proficiency. Item-level data were similarly presented to allow for granularity of interpretation of group differences.
Qualitative data were additionally analysed as supporting evidence to elaborate and help explain the quantitative data results (Creswell & Clark, 2007). The participants’ open-ended comments were investigated for trends that might indicate the reasons behind their responses or perspectives on resource use in IELTS preparation, technology use, and global pandemic impact. Note that the open-ended comment excerpts provided in the results section below were selective and subjective and therefore should not be generalised in a quantitative sense.
3.7 Ethical considerations
All participants were informed of the purpose of the study, and all volunteered to participate. Prospective participants had the opportunity to ask clarification questions before participation. Participants could withdraw from the study at any point without penalty and a gift card was given to incentivise completion of the survey and follow-up questions. Participant identities were protected throughout the analysis and reporting process through the de-identification of participants’ responses.
4 RESULTS
4.1 Research question 1: Resources use for test preparation
Research question one contained three sections: (1) test-takers’ perceptions and reported use of three participant-determined online resources as well as their reported use of offline resources across different geographic locations; (2) test types; and (3) test-taker’s proficiency. The sections are discussed separately below. General patterns regarding participants’ online resource use are first described with overall statistical comparisons followed by descriptive comparisons of item-level responses.
4.1.1 Online resources
All participants (241) each reported on three online resources they used for their IELTS preparation. However, 34 resources were deemed not to be online (e.g., preparation books, literature, in-person courses) and were removed from subsequent analyses. The resulting 689 different resources were tabulated by type and purpose of the resources. Overall, websites were the most frequent (k = 251), followed by mobile apps (k = 204) and social media (k = 165). The other categories of online courses and social video games were rare (k = 60).
When comparing across countries, significant differences in their use of online resources were found between the three groups using a chi-square test, , , V = 0.33 (medium effect size). Post-hoc comparisons by country with Bonferroni adjustments indicated significant differences amongst all group comparisons. Chinese compared to Korean participants (, 95% C.I. = [0.21, 0.37]) and Chinese compared to U.S. participants (, 95% C.I. = [0.24, 0.41]) were significant at similar levels. Korean and U.S. participants were different but to a lesser degree (, 95% C.I. = [0.04, 0.22]). See columns 2, 3, and 4 in Table 2 for comparisons and see overall distributions in Figure 1. Note that the Chi-square tests were computed by setting the country as the observation and types of online resources as variables. They allow overall country differences to be examined for statistical differences.
When comparing each type of resource, U.S. participants reported using websites (k = 113) more than Chinese (k = 55) and Korean (k = 83) participants. The most frequently reported websites were ielts.org and several news sites (e.g., BBC, CNN, VOA). Fewer than five participants reported using services that are identifiably fee-based (e.g., Magoosh, Udemy). Chinese participants reported using mobile apps (k = 135) more than Korean (k = 40) and U.S. (k = 29) participants. The most commonly used mobile apps were language specific for IELTS preparation (e.g., 小站雅思, 雅思哥) as well as the official IELTS app. This difference may be due to the availability of IELTS-specific mobile apps within different markets. Fewer participants overall used social media, online courses, video games, and others. Social media resources were used slightly more by Korean participants (k = 84) than U.S. (k = 50) or Chinese (k = 31) participants. These results almost entirely consist of references to video-based social media platforms (e.g., YouTube channels, WeChat subscriptions).
When comparing across IELTS types, significant differences were found between the three groups using a chi-square test, , , (medium effect size). Post-hoc comparisons by country with Bonferroni adjustments indicate significant differences amongst all group comparisons. Participants who had taken or intended to take IELTS Academic used online resources differently from those interested in IELTS General Training (, 95% C.I. = [0.16, 0.30]). Smaller differences were detected between participants who had taken or intended to take IELTS Academic and weren’t sure or were interested in both tests (, 95% C.I. = [0.03, 0.20]), as well as those who weren’t sure or were interested in both tests and the General Training test group (, 95% C.I. = [0.06, 0.30]).
When comparing online resource types amongst participants interested in IELTS Academic or IELTS General Training, caution must be taken as the groups are not equal in size. More than twice as many resources were identified by the Academic group (k = 436) than the General group (k = 184) and fewer yet by the Both / Unsure group (k = 69), which is in proportion to their group size (n = 151, 66, 24, respectively). The group interested or who had taken the IELTS Academic preferred mobile apps (k = 183) over websites (k = 143) with a much smaller number including social media (k = 71) and online courses (k = 34). However, those interested in the IELTS General Training reported much more use of websites (k = 114), the large part of which were YouTube channels, and relatively equal and low rates of mobile apps, social media, and online courses (k = 21, 27, 21, respectively). Those interested in both tests or unsure of which IELTS type indicated similar preferences for websites (k = 28) over mobile apps (k = 15) and social media (k = 18). The remaining figures for online courses, social video games, and other, were rare (k < 5). See Table 2 for tabulation results.
When broken down by proficiency, no significant differences were detected between the high and low group, , , V=0.12 (small effect size). See Table 2 for tabulation results.
Table 2: Tabulations of online resources by country, type, and proficiency
| Type | Country China | Country Korea | Country U.S. | IELTS type Academic | IELTS type General | IELTS type Both / Unsure | Proficiency High | Proficiency Low |
|---|---|---|---|---|---|---|---|---|
| Website | 55 | 83 | 113 | 143 | 114 | 28 | 111 | 174 |
| Mobile app | 135 | 40 | 29 | 183 | 21 | 15 | 83 | 136 |
| Social media | 31 | 84 | 50 | 71 | 27 | 18 | 57 | 59 |
| Online course | 13 | 22 | 25 | 34 | 21 | 5 | 17 | 43 |
| Other | 2 | 2 | 2 | 3 | 1 | 2 | 4 | 2 |
| Social video games | 2 | 1 | 0 | 2 | 0 | 1 | 1 | 2 |
| (total) | 238 | 232 | 219 | 436 | 184 | 69 | 273 | 416 |
Note. Chi-squared multiple-comparison results: country comparisons China-Korea ***, China-U.S. ***, Korea-U.S. *; IELTS type comparisons Academic-General ***, Academic-Both / Unsure *, General-Both / Unsure *; ***p < .001, **p < .01, *p < .05, . p < .10.
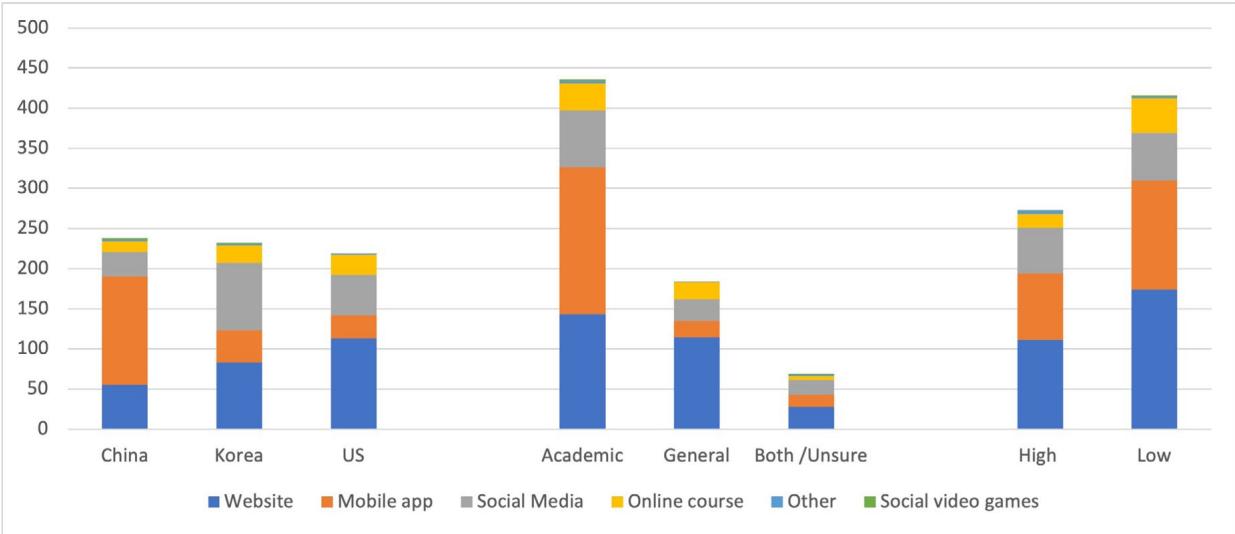
Figure 1: Frequency distribution of online resource by country, type, and proficiency
As seen from Figure 1, mobile apps (orange) were used much more frequently by participants in China and by those in the test type of IELTS Academic. U.S. participants used websites (blue) more than Chinese and Korean. This figure provides an additional visual representation about participants’ use of online resources.
4.1.1.1 Self-perception of online resources
We also examined participant’s evaluation on their online resource use in terms of the frequency, perceived effectiveness, perceived value, and valence by using 100-point Likert scales with 14 items. In order to examine any group differences among three variables (country, test type, and proficiency), we conducted a factor analysis to reduce the number of variables. The sample size of the online resource items were considered marvellous (KMO = .92) and met Bartlett’s test of sphericity (). The EFA resulted in a single factor with an eigenvalue of 5.96 that explained 43% of the variance. Item factor loadings were between .43 and .85 and can be seen in Appendix B.
The highest factor item loadings included questions about participants liking the way they learn, wanting to recommend the online resource to others, and the resource satisfying their learning needs. Together, these indicate a factor that encompasses use and overall satisfaction with online resources. Factorial ANOVA results comparing the participant-level factor scores to the country, test type, and proficiency indicate that there was no interaction effect among any of the variables. However, the country variable indicated a significant main effect , meaning that there were differences in online resource use and overall satisfaction across three different geographic locations. See Table 3 for complete results.
Table 3: Factorial ANOVA of online resources EFA single factor results on self-perception ratings on online resource use
| Predictor | Sum Sq | df | Mean Sq | F | p | |
|---|---|---|---|---|---|---|
| country | 13.76 | 2 | 6.88 | 7.57 | <.001*** | .02 |
| test type | 1.92 | 2 | 0.96 | 1.05 | .349 | .00 |
| proficiency | 0.77 | 1 | 0.77 | 0.85 | .358 | .00 |
| country * test type | 3.48 | 4 | 0.87 | 0.96 | .430 | .00 |
| country * proficiency | 0.58 | 2 | 0.29 | 0.32 | .729 | .00 |
| test type * proficiency | 0.21 | 2 | 0.10 | 0.12 | .891 | .00 |
| country * test type * proficiency | 5.03 | 3 | 1.68 | 1.84 | .138 | .01 |
A post hoc comparison using Tukey HSD adjustments was conducted to examine differences within the predictor of the country. The results indicated a higher factor score (i.e., more inclined to use and be satisfied by online resources) was found for participants from China as compared to Korea ( , 95% C.I. = [-0.53, -0.12]) and to a lesser extent from the U.S. participants to Korean participants ( , 95% C.I. = [0.04, 0.46]). However, no differences were found between participants from China and the U.S. ( ).
To further understand the differences by country, item-level descriptive statistics are reported below (see Table 4) to identify commonalities and differences between participants in their use and perception of online resources by country. Participants in all three countries were equally likely to use the online resource every day, and all countries were near the 50-mark on the 100-point Likert scale. When asked to choose their tendency of using online resources for several hours when they are accessing it, Korean participants reported their preference with a mean value of 44, i.e., lower than 50-mark points. That is, they were less likely to use an online resource for several hours (M = 44.20, SD = 24.71) than were Chinese (M = 57.49, SD = 28.29) and U.S. participants (M = 55.93, SD = 28.86).
When considering English skill improvement with online resources, responses were similar between participants in all countries for listening or speaking, which were also near the 50-point mark on the scales. Korean participants thought the online resources helped with their writing (M = 41.45, SD = 27.08) and reading (M = 46.57, SD = 28.67) skills somewhat at a lower rate than did Chinese participants on their writing (M = 52.64, SD = 27.71) and reading (M = 74.28, SD = 21.19) skills or U.S. participants on their writing (M = 51.34, SD = 32.21) and reading (M = 55.79, SD = 33.68) skills. These differences are somewhat surprising in that Chinese and U.S. participants seem more consistent in their perceptions (as indicated by their small standard deviations) than do Korean participants despite the fact that the overwhelming majority of U.S. participants were interested in the General Training version of IELTS while Korean and Chinese participants were interested in academic endeavours.
Despite several skill-improvement item ratings being below the 50-point mark, most participants reported a higher level of willingness to recommend a resource to others. U.S. participants were the most likely to want to recommend an online resource (M = 72.32, SD = 27.71) as compared to Chinese (M = 63.24, SD = 25.67) or Korean (M = 63.98, SD = 25.02) participants. Similarly, perceptions of their learning needs being satisfied by the online resources were higher, near the 60-point mark across the three countries. The difference between the lower perceptions of skill improvement (i.e., reading, writing, listening, speaking) and higher willingness to recommend such resources may be due to the perception of the ability of the online resource to increase motivation to study for IELTS, which was near the 70-point mark for participants from all countries.
The item seeking general impressions of the online resources were high but varied amongst the three groups of participants: lowest were Korean participants (M = 66.29, SD = 22.61) as compared to U.S. (M = 74.50, SD = 25.08) and Chinese (M = 73.19, SD = 19.86), which may be due to the availability of IELTS-specific online resources in each country. The ‘fun’ factor of an online resource might explain some of this difference in general impressions of the resource. U.S. participants were more likely to find the online resource fun for people of their age (M = 67.20, SD = 27.92) than Korean (M = 64.57, SD = 23.42) or Chinese (M = 62.62, SD = 24.27) participants. Participants also varied in their perceptions of liking the way they learn using the resource where Chinese participants were most likely to report this (M = 66.28, SD = 26.12) as compared to U.S. (M = 62.88, SD = 29.07) and Korean (M = 55.26, SD = 28.96) participants. All of these differences are likely due to the context-specific resources available for each participant group. In other words, the use of IELTS-specific resources, which was greater for Chinese and U.S. participants, likely influenced their general perceptions, perceptions of fun, and preference for the way they learn using the online resource.
Two other items were consistent amongst all participants. Despite some differences in general perceptions between the participant groups, all participants found the resources equally contained helpful exercises, near the 60-point mark. It is notable that these scores are lower than general impressions and perceptions of motivation, indicating that features and factors other than exercises are important to participants in online resource use. Finally, just above the 50-point mark and consistent for participants in their view on the resource offering practice that was not available elsewhere, indicating that the participants were somewhat aware of other online resource options and chose to continue with the resource at hand.
Overall, it is notable that the online resources were rated near the 50-point mark on a 100-point scale for their perceived impact on listening, writing, and speaking skills, and only slightly higher for perceptions of unique types of practice, indicating the need for continued development in the online resource sphere to meet the needs of test-takers. Complete descriptive statistics are given in Table 4.
Table 4: Item-level descriptive statistics by country for online resources
| Item | China M(SD) | Korea M(SD) | U.S. M(SD) |
|---|---|---|---|
| I use / used this resource every day | 49.67(25.47) | 55.24(26.24) | 56.58(31.46) |
| I use / used this resource for several hours when I access it | 57.49(28.29) | 44.20(24.71) | 55.93(28.86) |
| I think that I improved my listening with this resource | 45.00(26.49) | 52.13(30.51) | 56.25(33.56) |
| I think I improved my writing with this resource | 52.64(27.71) | 41.45(27.08) | 51.34(32.21) |
| I think that I improved my speaking with this resource | 50.47(27.40) | 49.61(27.29) | 49.75(32.71) |
| I think I improved my reading with this resource | 74.28(21.19) | 46.57(28.67) | 55.79(33.68) |
| I would recommend this resource for preparing for the IELTS | 63.24(25.67) | 63.98(25.02) | 72.32(27.71) |
| I think this resource can satisfy my learning needs | 67.10(21.69) | 59.19(27.00) | 63.07(29.61) |
| This resource motivates / motivated me to study for the IELTS | 77.44(18.10) | 61.45(22.24) | 63.39(29.59) |
| My general impressions of this resource are positive | 73.19(19.86) | 66.29(22.61) | 74.50(25.08) |
| This resource is fun for people my age | 62.62(24.27) | 64.57(23.42) | 67.20(27.92) |
| I like the way I learn using this resource | 66.28(26.12) | 55.26(28.96) | 62.88(29.07) |
| This resource has helpful exercises | 56.69(27.90) | 64.06(24.92) | 67.33(30.92) |
| This resource offers practice that I cannot find in other resources | 49.67(25.47) | 55.24(26.24) | 56.44(32.83) |
4.1.2 Offline resources alone
The group of items related to offline resources used alone was subjected to factor analyses and sample size was deemed meritorious (KMO = .84) for EFA and met Bartlett’s test of sphericity ( ). A two-factor solution emerged where Factor 1 explained 27% of the variance (eigenvalue = 3.53) and Factor 2 explained 16% of the variance (eigenvalue = 2.09). Together, the EFA explained 43% of the variance and the two factors were moderately correlated (r = 0.53). Factor 1 was related to items that were IELTS specific preparation (completing IELTS practice exams, studying IELTS materials) and Factor 2 was associated with general English study / preparation items (consuming media in English). See item factor loadings in Appendix B. Factor scores were subjected to two separate factorial ANOVAs which resulted in differing patterns amongst participant groups.
4.1.2.1 Factor 1: IELTS specific preparation
The ANOVA result for Factor 1 (IELTS-specific resources) indicated a significant main effect of country ( , ) but also a significant interaction term of the country by test type ( , ). Therefore, both test type and country are discussed below. However, effects were not found with the predictors of proficiency; subsequently, proficiency-related findings are not described. See Table 5 for complete factorial ANOVA results.
Table 5: Factorial ANOVA of offline resources (alone) EFA results - Factor 1 (IELTS specific preparation resources)
| Predictor | Sum Sq | df | Mean Sq | F | p | |
|---|---|---|---|---|---|---|
| country | 23.48 | 2 | 11.74 | 12.20 | < .001*** | .10 |
| test type | 2.29 | 2 | 1.15 | 1.19 | .306 | .01 |
| proficiency | 0.90 | 1 | 0.90 | 0.94 | .334 | .00 |
| country * test type | 11.25 | 4 | 2.81 | 2.92 | .022* | .05 |
| country * proficiency | 2.68 | 2 | 1.34 | 1.39 | .250 | .01 |
| test type * proficiency | 4.60 | 2 | 2.30 | 2.39 | .094 | .02 |
| country * test type * proficiency | 0.50 | 3 | 0.25 | 0.26 | .773 | .00 |
Test type by country interactions were analysed using Tukey HSD comparisons. Significant differences were found between U.S. participants taking the IELTS General Training and Chinese participants taking IELTS Academic (p < .001, 95% C.I. = [-1.35, -0.27]) as well as Korean participants unsure of which test type they would take and Chinese participants taking IELTS Academic (p = .001, 95% C.I. = [-2.04, -0.29]). In each case, the Chinese participants interested in the IELTS Academic test were more likely to use the IELTS-specific offline resources compared to those in Korea and the U.S.
As for the main effect for country as additional information, post-hoc Tukey HSD tests indicate that offline resources used alone by participants were more frequent amongst test-takers in China as compared to those in Korea (p = .002, 95% C.I. = [0.53, 0.89]) and China compared to the U.S. (p < .001, 95% C.I. = [0.74, 1.11]). However, no differences were found between Korean and U.S. participants (p = .339).
Item-level analyses of offline resources done by participants alone and IELTS-specific indicated several trends. Chinese participants interested in the IELTS Academic test reported completing IELTS practice exams (M = 74.00, SD = 24.14) more than Korean (M = 53.25, SD = 28.82) and U.S. (M = 67.65, SD = 32.32) participants when they prepared for their IELTS tests. They were also more likely to study with an IELTS preparation book (M = 72.03, SD = 23.08) than were Korean (M = 56.15, SD = 28.70) and U.S. participants (M = 48.05, SD = 32.69). Similar trends were found with studying IELTS rubrics / criteria for writing amongst Chinese participants (M = 56.45, SD = 26.04) as compared to Korean (M = 42.95, SD = 26.83 and U.S. (M = 47.42, SD = 35.77) participants as well as rubrics / criteria for speaking, in which Chinese participants (M = 55.06 SD = 26.14) reported more than Korean (M = 42.60, SD = 26.16) and U.S. (M = 48.81, SD = 34.18) participants. Together, these results indicated a more strategic approach by Chinese participants to target IELTS-specific features.
Four other items regarding reading or memorising sample essays or speaking task responses also indicated some differences between countries as well. Primarily, U.S. participants reported memorisation of possible speaking task responses at a lower rate (M = 35.13, SD = 34.38) than did Chinese (M = 58.89, SD = 28.17) or Korean (M = 52.96, SD = 28.17) participants. This means that Chinese and Korean participants reported a tendency to memorise their speaking task responses when they prepared for speaking skills (i.e., more than 50-points on the 100-point scale). Similarly, U.S. participants reported being very unlikely to memorise sample IELTS essays (M = 24.32, SD = 31.68) than were Chinese (M = 42.11, SD = 29.52) or Korean (M = 37.14, SD = 26.15) participants.
It is of particular note that the U.S. participant score for memorising sample IELTS essays is the lowest within any score of the item block, perhaps indicating either lack of familiarity with the practice, a conscious decision to not use such techniques, or an unwillingness to indicate its use on the present survey.
When comparing across participant groups interested in IELTS Academic, General Training, and both / unsure, additional trends emerge. IELTS both / unsure participants reported completing practice exams at a lower rate (M = 49.00, SD = 32.60) than did Academic (M = 66.11, SD = 32.57) and General Training (M = 66.86, SD = 27.48) participants. Interestingly, IELTS Academic participants were the least likely to report using IELTS preparation books (M = 45.41, SD = 33.07) as compared to General Training (M = 64.66, SD = 26.38) and those that were interested in both or unsure (M = 57.42, SD = 32.26). Rates were relatively similar between all groups for studying IELTS rubrics / criteria for writing (45.50 < M < 50.14) and speaking (42.42 < M < 50.24). However, all participants were roughly 10 points higher in reporting their use of watching videos online of teachers’ tips (58.25 < M < 62.56).
Larger trends were found when comparing survey results of memorising possible speaking responses. IELTS Academic test-takers report this at a higher rate (M = 55.75, SD = 30.05) similar to those interested in both or unsure (M = 49.67, SD = 28.84). Only those who had taken or were interested in IELTS General Training were lower (M = 33.24, SD = 32.32). Similar rates of reading sample IELTS essays by teachers / examiners were reported between the Academic (M = 58.41, SD = 28.82) and both/unsure group (M = 58.62, SD = 30.84) but a slightly lower rate amongst those interested in General Training (M = 42.75, SD = 35.13). However, rates were similar for reading IELTS essays by students across all three groups (50.91 < M < 55.00). The final item in this section asked about participant practices of memorising sample IELTS essays. Those who indicated both / unsure were the highest (M = 49.58, SD = 28.79) and those interested in IELTS General Training were the lowest (M = 20.87, SD = 27.93). The IELTS Academic group was in between (M = 38.18, SD = 28.93). See Table 6 for descriptive statistics of offline resources (alone) used by country and test type.
Table 6: Item-level descriptive statistics by country and test type for offline resources (alone): Factor 1 (IELTS-specific)
| Item | China M(SD) | Korea M(SD) | U.S. M(SD) | IELTS Academic M(SD) | IELTS General M(SD) | IELTS both/unsure M(SD) |
|---|---|---|---|---|---|---|
| Complete IELTS practice exams | 74.00(24.14) | 53.25(28.82) | 67.65(32.32) | 66.11(32.57) | 66.86(27.48) | 49.00(32.60) |
| Study with IELTS preparation books by myself (e.g., vocabulary for IELTS) | 72.03(23.08) | 56.15(28.70) | 48.05(32.69) | 45.41(33.07) | 64.66(26.38) | 57.42(32.26) |
| Study IELTS grading rubrics / criteria for writing | 56.45(26.04) | 42.95(26.83) | 47.42(35.77) | 50.14(28.53) | 47.36(33.31) | 45.50(32.73) |
| Study IELTS grading rubrics / criteria for speaking | 55.06(26.14) | 42.60(26.16) | 48.81(34.18) | 50.24(27.80) | 47.80(32.78) | 42.42(29.49) |
| Watch videos online of teachers’ tips | 65.46(25.49) | 51.99(31.40) | 63.37(33.09) | 59.53(29.34) | 62.56(31.17) | 58.25(37.38) |
| Prepare for IELTS speaking topics by memorising possible responses | 58.89(28.61) | 52.96(28.17) | 35.13(34.38) | 55.74(30.05) | 33.24(32.32) | 49.67(28.84) |
| Read sample IELTS essays written by IELTS teachers / examiners | 62.48(25.92) | 54.17(30.63) | 54.06(34.95) | 58.41(28.82) | 42.75(35.13) | 58.62(30.84) |
| Read sample IELTS essays written by proficient IELTS students | 56.20(26.80) | 45.17(30.93) | 54.86(34.53) | 50.91(29.72) | 53.55(34.77) | 55.00(30.73) |
| Memorise sample IELTS essays | 42.11(29.52) | 37.14(26.15) | 24.32(31.68) | 38.18(28.93) | 20.87(27.93) | 49.58(28.79) |
4.1.2.2 Factor 2: general English study / preparation
The second factor that emerged from offline resources used by participants alone included consuming media for general English practice and were not specific to IELTS preparation. Four items to this end indicated factor loading scores above .5 and are discussed individually below. Factorial ANOVA results indicate only a significant main effect (p < .001, ) for country in Factor 2 scores. None of the interaction effects revealed statistical significance. See Table 7 for complete results.
Table 7: Factorial ANOVA of offline resources (alone) EFA results: Factor 2 (general English study/preparation)
| Predictor | Sum Sq | df | Mean Sq | F | p | |
|---|---|---|---|---|---|---|
| country | 13.68 | 2 | 6.84 | 6.80 | .001** | .06 |
| test type | 3.73 | 2 | 1.86 | 1.85 | .159 | .02 |
| proficiency | 1.92 | 1 | 1.92 | 1.91 | .169 | .01 |
| country * test type | 1.47 | 4 | 0.37 | 0.36 | .834 | .01 |
| country * proficiency | 0.88 | 2 | 0.44 | 0.44 | .647 | .00 |
| test type * proficiency | 1.13 | 2 | 0.57 | 0.56 | .571 | .00 |
| country * test type * proficiency | 2.41 | 3 | 1.20 | 1.20 | .304 | .01 |
Tukey HSD analyses resulted in a significant difference between U.S. and Chinese participants (p = .004, 95% C.I. = [0.13, 0.88]) as well as U.S. and Korean participants (p = .005, 95% C.I. = [0.13, 0.87]). However, no differences were found between Korean and Chinese participants (p = .998). Taken together, these indicate the higher use of English media (books, film, television, and radio) of U.S. test-takers that is not shared by Korean or Chinese participants.
Four items asked about test-taker consumption of media in their preparation efforts. U.S. participants reported reading books (M = 56.02, SD = 34.03) more than Korean (M = 43.40, SD = 27.33) and Chinese (M = 48.67, SD = 29.10) participants. However, this item did not distinguish general reading books (e.g., fiction) from language learning or test preparation books. Similar rates of consuming newspapers and magazines were reported for participants from all three countries (just below the 50-point mark). Larger differences were found amongst the three countries for the consumption of English-language radio. Chinese participants reported listening to radio in English (M = 61.81, SD = 27.95) more than U.S. (M = 52.68, SD = 36.07) or Korean (M = 42.58, SD = 30.19) participants. Overall, all participants reported watching TV or movies in English the most frequently with minimal differences between the three countries. However, there was a significant difference in watching videos online of teachers’ tips where Chinese (M = 65.46, SD = 25.49) and U.S. (M = 63.37, SD = 33.09) reported viewing such videos somewhat more frequently than Korean participants (M = 51.99, SD = 31.40). These findings add depth to the video and social media-based resources mentioned in the online resource section above, indicating that such resources are popular, with some differing trends, across participants in the countries included in this study. See Table 8 for descriptive statistics results.
Table 8: Item-level descriptive statistics by country for offline resources (alone): Factor 2 (general English study/preparation)
| Item | China M(SD) | Korea M(SD) | U.S. M(SD) |
|---|---|---|---|
| Read books in English | 48.67 (29.10) | 43.40 (27.33) | 56.02 (34.03) |
| Read newspapers and magazines in English | 45.23 (28.50) | 43.49 (28.55) | 53.05 (33.62) |
| Listen to English-language radio | 61.81 (27.95) | 42.58 (30.19) | 52.68 (36.07) |
| Watch TV / movies / videos in English | 69.70 (27.70) | 70.74 (25.30) | 72.88 (31.30) |
4.1.3 Offline resources with peers
The section of items relating to offline resources done with peers was subjected to sample size analyses which results in an acceptable but middling score (KMO = .78). The data met Bartlett’s test of sphericity () and EFA resulted in three factors. Factor 1 explained 21% of the variance (eigenvalue = 2.07) and was associated with items related to IELTS-specific, academic, and general English courses as well as speaking with a non-native speaker. Factor 2 also explained 21% of the variance (eigenvalue = 2.12) and was associated with using opportunities to speak English at work and with family. Factor 3 explained 12% of the variance (eigenvalue = 1.25) with items related to social conversation loading the highest. Together, the EFA explained 54% of the variance of the item responses. Factors 1 and 2 were minimally correlated (r = 0.21), Factors 2 and 3 were moderately correlated (r = 0.55), and Factors 1 and 3 were moderately correlated (r = 0.63), indicating some overlap between the underlying factor structure within the section.
4.1.3.1 Factor 1: Academic and IELTS-specific social resources
The factorial ANOVA for Factor 1 scores indicates main effect differences between groups by country (p < .001, ) and test type (p = .021, ). Additionally, there was a significant interaction term for country by test type (p = .005, ), indicating both test type and country moderate Academic and IELTS-specific social resource use. See Table 9 for ANOVA results.
Table 9: Factorial ANOVA of offline resources (with peers) EFA results: Factor 1 (Academic and IELTS-specific social resources)
| Predictor | Sum Sq | df | Mean Sq | F | p | |
|---|---|---|---|---|---|---|
| country | 43.33 | 2 | 21.67 | 25.72 | < .001*** | .19 |
| test type | 6.63 | 2 | 3.32 | 3.94 | .021* | .03 |
| proficiency | 0.24 | 1 | 0.24 | 0.29 | .590 | .00 |
| country * test type | 12.91 | 4 | 3.23 | 3.83 | .005* | .06 |
| country * proficiency | 0.52 | 2 | 0.26 | 0.31 | .735 | .00 |
| test type * proficiency | 3.18 | 2 | 1.59 | 1.89 | .154 | .02 |
| country * test type * proficiency | 2.00 | 2 | 1.00 | 1.19 | .307 | .01 |
Tukey HSD post-hoc analyses were computed for pair-wise differences. Several interaction group comparisons indicated strong differences in Factor 1. U.S. participants taking the IELTS General had lower Factor 1 scores than participants from China taking the IELTS Academic (p < .001, 95% C.I. = [-1.68, -0.69]) and Korean participants taking the IELTS Academic (p < .001, 95% C.I. = [-1.60, -0.54]). Similarly, Korean participants who were unsure of which IELTS test type they will take were lower in Factor 1 scores than participants from China taking the IELTS Academic (p = .016, 95% C.I. = [-1.73, -0.09]). Overall, these results indicated that participants from the U.S. who prepared for the IELTS General were much less likely to engage in Academic and IELTS-specific activities with peers.
As additional info, post-hoc analyses for the main effects were added. Results showed a significant difference between U.S. and Chinese participants (p < .001, 95% C.I. = [-1.36, -0.67]) as well as U.S. and Korean participants (p < .001, 95% C.I. = [-1.05, -0.37]). No differences were found between Korean and Chinese participants (p = .088). None of the pairwise comparisons of test type were significant.
Item-level analyses also indicated strong differences by country and task type. Korean participants were the most likely to have reported attending an IELTS preparation course (M = 61.28, SD = 30.80) and Chinese participants were less likely (M = 52.58, SD = 33.36). Despite this apparent difference, both groups of participants indicated their likelihood to have attended an IELTS preparation course with their mean value of 52 and higher on the 100-point scale. On the other hand, U.S. participants were much less likely to have reported attending an IELTS preparation course (M = 30.26, SD = 34.81). Similarly, the U.S. participants were the least likely to have taken a general English course (M = 23.73, SD = 30.48) but Chinese (M = 45.14, SD = 37.46) and Korean (M = 37.46, SD = 32.37) participants reported attending such courses at a higher rate. Academic English courses were similarly split, in that U.S. participant raters were lower (M = 22.96, SD = 30.48) than those of Chinese (M = 52.00, SD = 33.47) or Korean (M = 49.81, SD = 32.40) participants. However, these results must be interpreted with the motivation of participants’ test-taking purpose in mind in that both Korean and Chinese participants were preparing for the IELTS Academic tests and U.S. participants were mostly interested in IELTS General.
Practising speaking English with a non-native speaker was more common amongst Chinese participants (M = 55.34, SD = 27.56), less so with Korean participants (M = 46.05, SD = 29.89), and minimal with U.S. participants (M = 36.99, SD = 36.19). As such, this finding may not represent IELTS test-takers’ overall patterns in each location in terms of their IELTS preparation course experience. Finally, all participants consistently reported rarely exchanging IELTS writing with other IELTS students (near the 30-point mark).
When comparing across test types, marked differences are seen in those who report attending an IELTS preparation course. IELTS Academic participants rated this item above the 50-point mark (M = 56.29, SD = 34.24). Those that were interested in Both / Unsure were less (M = 43.42, SD = 28.69) and finally those interested in General Training were the lowest (M = 32.06, SD = 34.55). However, it should be noted that the Korean participants were recruited from IELTS preparation courses and were targeting IELTS Academic to a greater extent as compared to other groups, reflecting the interaction term of country by test type detected in the factor score ANOVA comparisons. Lower rates for all groups of test types were indicated for taking a general English course (26.51 < M < 40.78).
Unsurprisingly, General Training test-takers were least likely to attend an academic English course (M = 22.64, SD = 28.34) and the Both / Unsure group was lower (M = 37.50, SD = 27.39) than the Academic group (M = 50.73, SD = 34.78). It is of note that slightly more than half of the participants reported taking Academic or IELTS-specific courses to prepare for the IELTS Academic, given its close connection with university learning. Practising with a non-native speaker varied by group as well. IELTS Academic participants reported using this resource the most (M = 51.70, SD = 30.59) and General Training participants the least (M = 25.70, SD = 31.48). Those who were interested in Both / Unsure were between the two (M = 33.84, SD = 34.52). These differences are likely due to geographic differences in access to native speakers which is addressed in Factor 3. Finally, few reported exchanging IELTS writing with other IELTS students (25.70 < M < 32.60). See Table 10 for results.
Table 10: Item-level descriptive statistics for offline resources with peers Factor 1 (Academic and IELTS-specific social resources)
| Item | China M(SD) | Korea M(SD) | U.S. M(SD) | IELTS Academic M(SD) | IELTS General M(SD) | IELTS Both / Unsure M(SD) |
|---|---|---|---|---|---|---|
| Attend an IELTS preparation course | 52.58(33.36) | 61.28(30.80) | 30.26(34.81) | 56.29(34.24) | 32.06(34.55) | 43.42(28.69) |
| Take a general English course (i.e., one that does not target IELTS preparation) | 45.14(33.59) | 37.46(32.37) | 23.73(30.48) | 38.55(34.34) | 26.51(31.57) | 40.78(26.41) |
| Take an academic English course | 52.00(33.47) | 49.81(32.40) | 22.96(30.48) | 50.73(34.78) | 22.64(28.34) | 37.50(27.39) |
| Practice speaking English with a non-native speaker | 55.35(27.56) | 46.05(29.89) | 36.99(36.19) | 51.70(30.59) | 33.84(34.52) | 44.79(26.00) |
| Exchange IELTS writing with other IELTS students | 32.48(31.87) | 29.21(29.07) | 29.23(34.56) | 32.60(31.76) | 25.70(31.48) | 27.87(31.89) |
4.1.3.2 Factor 2: Family and work
Items associated with Factor 2 (family and work) included using English at work and at home. The factorial ANOVA analyses for Factor 2 scores yielded main effects between country (p < .001, ) and proficiency (p = .035, ). There was no interaction effect found among variables. See Table 11 for ANOVA results.
Table 11: Factorial ANOVA of offline resources (with peers) EFA results: Factor 2 (family and work)
| Predictor | Sum Sq | df | Mean Sq | F | p | |
|---|---|---|---|---|---|---|
| country | 88.96 | 2 | 44.48 | 52.58 | < .001*** | .32 |
| test type | 1.07 | 2 | 0.53 | 0.63 | .533 | .00 |
| proficiency | 3.82 | 1 | 3.82 | 4.52 | .035* | .02 |
| country * test type | 1.41 | 4 | 0.35 | 0.42 | .798 | .01 |
| country * proficiency | 0.67 | 2 | 0.33 | 0.39 | .674 | .00 |
| test type * proficiency | 1.66 | 2 | 0.83 | 0.98 | .376 | .01 |
| country * test type * proficiency | 3.09 | 2 | 1.54 | 1.83 | .163 | .02 |
Tukey HSD post-hoc analyses for offline resources in Factor 2 indicated significant differences between all groups. U.S. participants scored higher than Chinese participants (p < .001, 95% C.I. = [0.65, 1.33]) and higher than Korean participants (p < .001, 95% C.I. = [1.11, 1.80]). Furthermore, the Chinese participants were higher than Korean participants (p = .004, 95% C.I. = [-0.81, -0.12]). The high proficiency participants also reported using English more at work and at home (p = .008, 95% C.I. = [-0.45, 0.03]).
U.S. participants reported practicing speaking English more frequently with a family member (M = 44.01, SD = 38.60) than Chinese (M = 13.57, SD = 19.08) or Korean (M = 19.60, SD = 26.11) participants. Similarly, U.S. participants were much more likely to speak English at work (M = 69.27, SD = 34.65) than were Chinese (M = 30.06, SD = 28.02) or Korean (M = 25.54, SD = 28.82) participants. While the status of English as a common or foreign language in the three locations is likely the primary explanatory factor of these differences, it is notable that the scores for Korean and Chinese participants do not report a zero for these questions. In other words, some of the non-U.S. participants indeed use English to speak to family members and / or at their place of employment.
Proficiency also played a role in participant responses for these items. Both high and low proficiency participants report relatively low rates of practising English with their family and , respectively). However, the high proficiency group was much more likely to report Speaking English at work than the low proficiency group . A similar trend was found for writing in English at work where high proficiency participants reported higher rates than low proficiency ones . See Table 12 for descriptive statistics of Factor 2 items.
Table 12: Item-level descriptive statistics for offline resources with peers: Factor 2 (family and work)
| Item | China M(SD) | Korea M(SD) | U.S. M(SD) | High prof. M(SD) | Low prof. M(SD) |
|---|---|---|---|---|---|
| Practice speaking English with my family | 13.57 (19.08) | 19.63 (26.11) | 44.01 (38.60) | 31.06 (35.40) | 22.37 (28.86) |
| Speak in English at work | 30.06 (28.02) | 25.54 (28.82) | 69.27 (34.65) | 59.61 (37.09) | 29.13 (30.28) |
| Write in English at work | 40.54 (28.92) | 25.43 (25.58) | 69.99 (33.81) | 63.38 (35.66) | 32.31 (28.20) |
4.1.3.3 Factor 3: social conversation
Only two items had factor loading scores above 0.50 for Factor 3: participation in a conversation group and speaking with a native speaker. The factorial ANOVA for Factor 3 scores indicated a main effect for country (p = .006, ) but no other main or interaction effects. See Table 13 for ANOVA results.
Table 13: Factorial ANOVA of offline resources (with peers) EFA results: Factor 3 (social conversation)
| Predictor | Sum Sq | df | Mean Sq | F | p | |
|---|---|---|---|---|---|---|
| country | 13.24 | 2 | 6.62 | 5.31 | .006*** | .05 |
| test type | 2.88 | 2 | 1.44 | 1.15 | .317 | .01 |
| proficiency | 0.46 | 1 | 0.46 | 0.37 | .546 | .00 |
| country * test type | 1.45 | 4 | 0.36 | 0.29 | .883 | .01 |
| country * proficiency | 2.28 | 2 | 1.14 | 0.91 | .402 | .01 |
| test type * proficiency | 0.94 | 2 | 0.47 | 0.38 | .687 | .00 |
| country * test type * proficiency | 0.37 | 2 | 0.18 | 0.15 | .862 | .00 |
Tukey HSD post-hoc comparisons for social offline resources in Factor 3 indicated a significant difference only between Korean and Chinese participants (p = .004, 95% C.I. = [0.16, 0.99]). U.S. and Chinese participants and U.S. and Korean participants were not significantly different (p = .250 and p = .224, respectively). This indicates that the U.S. participants serve as a mid-point in the Factor 3 scores whereas participants from China scored lower, and participants from Korea scored higher.
Item-level analyses indicate that participation in a conversation group were largely below or near the 40-mark on the 100 point scale, indicating several moderately common resources that were used similarly by participants in all three countries. Likewise, only Chinese participants reported a lower frequency of practising English with a native speaker (M = 38.47, SD = 31.27) than did Korean (M = 47.05, SD = 32.62) or U.S. participants (M = 49.01, SD = 37.88). See Table 14 for item statistics by country.
Table 14: Item-level descriptive statistics for offline resources with peers: Factor 3 (social conversation)
| Item | China M(SD) | Korea M(SD) | U.S. M(SD) |
|---|---|---|---|
| Participate in a conversation group | 38.19(29.55) | 42.60(32.44) | 35.47(35.40) |
| Practice speaking English with a native speaker | 38.47(31.27) | 47.05(32.62) | 49.01(37.88) |
4.1.4 Qualitative comments
Several open-ended questions also asked about participants’ favourite and least favourite resource, preferences for online vs. offline resources, and recommendations for future test-takers. The results indicated a large variety of beliefs, perceptions, and evaluations of preparation techniques between participants. It is clear from participants’ responses that their preference for either online or offline resources depended on individuals. Participants who preferred offline resources mentioned that they were less distracting than portable devices and could be used without constraints from the internet connections. Moreover, they argued for the effectiveness of IELTS preparation courses and for the possibility of note-taking.
Participant #76 (China, low-proficiency, IELTS Academic)
I think off-line materials were more helpful. With electronic materials, you have to have battery and connections. These are many restrictions. But with paper materials, you could easily take it out and study which is more convenient. Moreover, studying paper-based materials reduced the distractions and temptations.
Participant #110 (South Korea, high-proficiency, IELTS Academic)
Offline preparation resource, specifically, in-person courses are the most helpful.
I can receive direct and detailed feedback offline, and it helps preparing IELTS a lot.
Participant #222 (South Korea, high-proficiency, IELTS General)
I think offline resource is most helpful. When I doing the reading and listening part, I like highlighting many information of the sentences or paragraphs, which is hard to realize online.
Participants who preferred online resources generally mentioned that they were convenient and contained a wider range of materials.
Participant #12 (China, high-proficiency, IELTS Academic)
For me, my preparation process is main online using my ipad, because i dont want to carry books to libraries and classrooms everyday
Participant #100 (South Korea, low-proficiency, IELTS Academic)
Although I’m more familiar with offline course, I think online is getting more and more helpful because it’s a test that is taken by people all around the world, so there are plenty of materials available on the Internet, practice websites, even Youtube. So I guess once people get the hang of what the test is, they can study hard enough by themselves at home.
Participant #183 (U.S., high-proficiency, IELTS Academic)
The most helpful resource was Youtube Videos which were online.
It helped me prepare very well for my IELTS exam and helped me score better.
It has listening tests where you can listening the audio and answer questions in your book and then at the end once the test is done you can verify your answers.
It also has reading tests examples where you can read the questions on the screen and answer in your book and then once test is completed verify your answers.
Similarly, it has other videos which explains speaking and writing tests.
Furthermore, participants mentioned several variables that might influence the way they chose and used online and offline resources, such as the match between the chosen test format and the modality of preparation, the current proficiency and familiarity with the test format, and the different sections that one prepares for.
Participant #15 (China, low-proficiency, IELTS Academic)
I think the most useful resource is the online website I mentioned previously. Although it is basically an online version of the IELTS exercise book, It is very convenient and I don’t have to spend time calculating my scores because it will automatically check my answers and explain where the right answers come from. Besides, since I signed up for computer testing, doing exercises on a online website helped me get use to the computer testing module.
Participant #51 (China, low-proficiency, IELTS Academic)
In the beginning I am more used to offline teaching, because teachers and fellow students could help me familiarize myself with the testing format quickly. But if it is in the later stages, I am more inclined to use online resources because it is time saving and can improve my efficiency.
Participant #186 (U.S., high-proficiency, IELTS General)
For my listening and reading skills, I preferred to use my offline resources, because I could practice the time I was spending on each part of the test, in the same way I would do in the day of my exam. However, for my writing and speaking, online resources gave me more confidence, as I could understand how the test could be performed.
4.2 Research question 2: Perspectives on technology use
Research question two investigated test-takers’ perspectives on their use of technologies (i.e., computer-based assessment) for language testing and any differences in their responses across three countries. Five items asked participants about their comfort with paper-based and computer-based testing in different locations. Parallel to previous analyses, factor analyses were conducted and the sample size was considered acceptable but mediocre (KMO = .63) although it met Bartlett’s test of sphericity (). The EFA resulted in one factor that explained 37% of variance (eigenvalue = 1.86). Item factor loading scores were above 0.40 for all items except the first item, which was -0.26. This indicated a factor in which participants’ interest in taking a computer-based test is in somewhat, but not complete, opposition to taking a paper-based test. See Appendix B for factor loading scores.
Factorial ANOVA comparisons paralleled to those conducted for Research Question #1 above. The results yielded a significant difference in the main effects of country (p < .001, ) and proficiency (p = .045, ), but no interaction effects. See Table 15 for ANOVA results.
Table 15: Factorial ANOVA of use of technologies for testing EFA results
| Predictor | Sum Sq | df | Mean Sq | F | p | |
|---|---|---|---|---|---|---|
| country | 31.65 | 2 | 15.82 | 22.30 | < .001*** | .17 |
| test type | 1.96 | 2 | 0.98 | 1.38 | .254 | .01 |
| proficiency | 2.88 | 1 | 2.88 | 4.05 | .045* | .02 |
| country * test type | 0.75 | 4 | 0.19 | 0.26 | .901 | .00 |
| country * proficiency | 0.60 | 2 | 0.30 | 0.42 | .657 | .00 |
| test type * proficiency | 0.74 | 2 | 0.37 | 0.52 | .594 | .00 |
| country * test type * proficiency | 0.41 | 2 | 0.21 | 0.29 | .748 | .00 |
Tukey HSD post-hoc comparisons for use of technologies in testing indicated a significant difference between U.S. and Chinese participants (p < .001, 95% C.I. = [0.48, 1.11]) as well as U.S. and Korean participants (p < .001, 95% C.I. = [0.43, 1.05]). Chinese and Korean participants were not significantly different (p = .900). This indicates that the U.S. participants were much more interested in computer-based testing than were Chinese and Korean participants. Post-hoc comparisons for proficiency did not indicate significant differences once the p value adjustment was made (p = .103), meaning that in terms of inclinations towards computer-based testing, the difference between high proficiency and low proficiency groups was weak.
Item-level results showed similar preferences for a paper-based test at a test centre. There were no significant differences for this first item about their comfort with a paper-based test at a testing centre; participants on average marked 65 on the 100-point scale. However, for the second item regarding the computer-based test, the U.S. participants were by far the most comfortable with a computer-based test at a testing centre (M = 72.39, SD = 30.31). Chinese participants were the least comfortable with such an arrangement (M = 44.69, SD = 32.96) and Korean participants were slightly higher (M = 51.78, SD = 29.14). An even greater difference was found between the comfort of the U.S. participants taking a computer-based test at home (M = 76.61, SD = 31.23). Korean (M = 47.43, SD = 32.63) and Chinese (M = 45.83, SD = 33.97) participants were less comfortable with this option. Although these results could be possibly related to the test-type difference (IELTS General Training vs. Academic), it is uncertain at this point what causes these geographic differences.
Furthermore, no differences between participants from the three countries were detected when asked about test-takers’ comfort with completing a speaking section on a computer at a testing centre. On average, participants were somewhat comfortable with this option with the mean mark near 60 points on a 100-point scale. However, U.S. participants were the most comfortable with taking the speaking section of the test at home on a computer (M = 69.03, SD = 34.75). Both Chinese (M = 48.80, SD = 34.71) and Korean (M = 50.67, SD = 30.58) participants were near the centre point (50 on a 100-point scale) for this item, likely indicating a moderate acceptance of such an option. Additionally, it should be noted the U.S. participants had diverse views about a paper-based test at a testing centre, and the speaking section in any configuration as indicated by a larger Standard Deviation. These findings should be considered in light of the differential impact of the pandemic on at-home working and learning in each country, and with the notable difference of the U.S. participants’ interest in the General Training IELTS whereas Chinese and Korean participants were interested in the Academic IELTS.
Interestingly, high proficiency participants seem more comfortable with using computer technology for testing than do low ones overall. Except for the first item relating to the paper-based test, the high proficiency group marked 10 or more points higher on nearly all related items. They responded more favourably to taking the test on a computer at a test centre (M = 70.21, SD = 31.48) than did low proficiency participants (M = 47.03, SD = 30.54). High proficiency participants were also more interested in a computer-based test at home (M = 69.95, SD = 34.52) than were low proficiency ones (M = 47.74, SD = 33.32). However, the differences were less marked for speaking-related items where the high proficiency was favourable using a computer at a testing centre (M = 63.80, SD = 32.11) but so were the low proficiency participants (M = 56.93, SD = 30.26). Similar ratings were found for computer-based speaking tests at home for high (M = 63.32, SD = 35.84) and low (M = 51.39, SD = 32.82) proficiency participants. See Table 16 for complete descriptive statistics.
Table 16: Item-level descriptive statistics for perspectives on technology in testing by country and proficiency
| Item | China M(SD) | Korea M(SD) | U.S. M(SD) | High prof. M(SD) | Low prof. M(SD) |
|---|---|---|---|---|---|
| Comfort with a paper-based test at a test centre | 71.62 (25.71) | 61.94 (27.81) | 59.44 (36.38) | 58.84 (35.32) | 67.95 (26.61) |
| Comfort with a computer-based test at a test centre | 44.69 (32.96) | 51.78 (29.14) | 72.39 (30.31) | 70.21 (31.48) | 47.03 (30.54) |
| Comfort with a computer-based test at home | 45.83 (33.97) | 47.43 (32.63) | 76.61 (31.23) | 69.95 (34.52) | 47.74 (33.32) |
| Comfort with speaking section on a computer at testing centre | 61.31 (29.25) | 55.32 (29.44) | 62.42 (34.36) | 63.80 (32.11) | 56.93 (30.26) |
| Comfort with speaking section on a computer at home | 48.8 (34.71) | 50.67 (30.58) | 69.03 (34.75) | 63.32 (35.84) | 51.39 (32.82) |
4.3 Research question 3: Perspectives on IELTS practice in the global pandemic
The impact of the COVID-19 pandemic on test-taking plans and preparation habits were also captured with eight scale items and one open-ended question. The scale items were subjected to sample size factorability analysis, resulting in an adequate but middling score (KMO = 0.74). However, the data met Bartlett’s test of sphericity (28) = 589.01, p < .001) and the EFA resulted in one factor that explained 34% of the variance (eigenvalue = 2.71). The highest loading items include ‘I searched for an online option for IELTS’ (0.84) and ‘I thought about delaying my IELTS test date’ (0.84). However, the item, ‘I had to delay or cancel my IELTS’, resulted in a loading score of -0.05, indicating responses to this item may have had little to do with the pandemic. See Appendix B for complete factor loading scores.
The factor scores were appended to participant records and subjected to a factorial ANOVA. The results indicated no significant interaction or main effects, suggesting that the pandemic impacted all types of test-takers in similar magnitude despite potentially different individual cases. Post-hoc analyses were not examined as the overall ANOVA model did not detect differences. See Table 17 for complete ANOVA results.
Table 17: Factorial ANOVA of impact of pandemic EFA results
| Predictor | Sum Sq | df | Mean Sq | F | p | |
|---|---|---|---|---|---|---|
| country | 4.51 | 2 | 2.25 | 2.37 | .095 | .02 |
| test type | 0.53 | 2 | 0.27 | 0.28 | .756 | .00 |
| proficiency | 0.37 | 1 | 0.37 | 0.39 | .532 | .00 |
| country * test type | 0.46 | 4 | 0.12 | 0.12 | .975 | .00 |
| country * proficiency | 2.29 | 2 | 1.14 | 1.20 | .302 | .01 |
| test type * proficiency | 0.87 | 2 | 0.43 | 0.46 | .634 | .00 |
| country * test type * proficiency | 0.08 | 2 | 0.04 | 0.04 | .958 | .00 |
Item-level analyses indicated a wide diversity of types of impacts on the participants, as evidenced by larger standard deviations on these items in comparison with all other items and in the open-ended question results. Overall, scores for ‘thinking about delaying IELTS’ or ‘having to delay / cancel IELTS’ were near the midpoint (50 on the 100-point scale). Participants in all countries report that, due the pandemic, they changed their study intensity to study more (M = 44.77, SD = 34.01) with fewer reporting the pandemic resulted in them studying less (M = 38.17, SD = 34.38).
A similarly relatively low rate indicated that the pandemic resulted in them being ‘unsure if they should take the IELTS at all’ (M = 38.80, SD = 32.50). The highest scores within the section were associated with the item asking participants if they had ‘searched for an online IELTS option’ (M = 60.75, SD = 34.02). However, several were required to ‘change their IELTS testing centre’ (M = 39.14, SD = 37.62). The final item, which was inversely related to high factor loading items, indicated that roughly half of the participants reported that their IELTS plans were not impacted by the pandemic. See Table 18 for descriptive statistics for pandemic-related items.
Table 18: Overall item-level descriptive statistics for the impact of pandemic
| Item | All participantsM(SD) |
|---|---|
| 1. I thought about delaying my IELTS test date | 48.48 (35.32) |
| 2. I had to delay or cancel my IELTS | 44.11 (36.92) |
| 3. I studied more* | 44.77 (34.01) |
| 4. I studied less | 38.17 (34.38) |
| 5. I was unsure if I should take the IELTS | 38.80 (32.50) |
| 6. I searched for an online option for the IELTS | 60.75 (34.02) |
| 7. I had to change my IELTS testing centre | 39.14 (37.62) |
| 8. The pandemic did not affect my IELTS plan | 48.03 (38.55) |
*Item 3 had a low inverse item factor loading score within the factor structure
Further itemised analyses for each country revealed some informative findings, although the overall one-factor analysis did not yield any differences in participants’ responses to the global pandemic impact. We added this additional analysis intentionally to share how participants in each country shared their experiences about the pandemic impact in more detail. As seen below in Table 19, Chinese participants especially were less unsure about taking the IELTS (M = 30.02, SD = 30.45) than were Korean (M = 40.32, SD = 27.61) and U.S. (M = 47.32, SD = 37.47) participants.
Additionally, U.S. (M = 72.32, SD = 33.20) participants were more likely to search for an online IELTS option than were Korean (M = 57.72, SD = 29.75) or Chinese participants (M = 53.13, SD = 36.63). In terms of logistical impacts, U.S. (M = 59.78, SD = 40.87) participants were much more likely to change their IELTS testing centre than were Chinese (M = 33.37, SD = 37.53) or Korean participants (M = 27.98, SD = 27.01). No differences were detected between the three countries in reporting that the pandemic did not affect IELTS plans (below the 50-point mark). See Table 19 for complete descriptive statistics.
Table 19: Item-level descriptive statistics by country for impact of pandemic
| Item | China M(SD) | Korea M(SD) | U.S. M(SD) | H | p |
|---|---|---|---|---|---|
| 1. I thought about delaying my IELTS test date | 45.98 (37.69) | 49.08 (31.73) | 50.81 (36.92) | 0.82 | .664 |
| 2. I had to delay or cancel my IELTS | 38.35 (39.01) | 45.41 (30.53) | 49.40 (40.50) | 2.71 | .259 |
| 3. I studied more | 40.63 (33.40) | 46.26 (33.35) | 47.78 (35.57) | 1.62 | .444 |
| 4. I studied less | 33.59 (33.29) | 41.97 (33.35) | 39.24 (36.78) | 2.19 | .335 |
| 5. I was unsure if I should take the IELTS | 30.02 (30.45) | 40.32 (27.61) | 47.32 (37.47) | 7.47 | .024* |
| 6. I searched for an online option for the IELTS | 53.13 (36.63) | 57.72 (29.75) | 72.32 (33.20) | 13.83 | <.001*** |
| 7. I had to change my IELTS testing centre | 33.37 (37.53) | 27.98 (27.01) | 59.78 (40.87) | 17.64 | <.001*** |
| 8. The pandemic did not affect my IELTS plan | 49.81 (39.14) | 50.9 (35.64) | 42.73 (41.05) | 2.86 | .240 |
Note: Kruskal-Wallis results ***p < .001, **p < .01, *p < .05.
4.3.1 Qualitative comments
4.3.1.1 Negative impact
The diversity in the impacts of the COVID-19 pandemic was also illustrated by the open-ended responses. Several participants reported negative impacts in their test preparation efforts. While some comments pertained to test administration (i.e., booking a test), others pertained to the actual testing experience. For example, several mentioned that the pandemic led to frequent changes of test dates, cancellations of tests, and the increasing prices associated with travel.
Participant #232 (U.S., low-proficiency, IELTS General)
I live in City X and the test center has been closed for a year now. The nearest center is City X which isn’t offering dates for General IELTS. I might have to fly to City X or City X which would be both cost and time prohibitive.
Participant #100 (South Korea, low-proficiency, IELTS Academic)
I don’t want to recall this, but yes. Right a week before my first test, my brother got covid, so I couldn’t attend my academy for a while and of course I had to be in quarantine for 15 days. Because of that, I couldn’t concentrate on my studies and I had no choice but to cancel and put off the test day.
Participant #7 (China, high-proficiency, IELTS Academic)
I think I become lazy to study IELTS because the test date was delayed. And I am still not sure whether I will go abroad to study.
Some test-takers mentioned that the pandemic resulted in the change of the testing procedures in speaking, which might have influenced their test performance. This seemed to be especially relevant in cities where some centres remained open but test formats (e.g., speaking) changed.
Participant #195 (U.S., high-proficiency, IELTS General)
Yes, wearing face mask during exam is also very uncomfortable and causes stress for speaking part as I’m soft spoken.
Participant #20 (China, low-proficiency, IELTS Academic)
I needed to wear a mask and speak from the other side of a glass pane in my last IELTS speaking test, which made it harder for me to communicate with my examiner (both to hear the examiner clearly and to make myself understood).
Participant #108 (South Korea, low-proficiency, IELTS Academic)
Not really but made me difficult to understand what examiners are saying during mock speaking exams because of the masks.
4.3.1.2 Positive impact
In contrast, some test-takers mentioned the positive effects the pandemic offered on their test preparation. Many test-takers suggested that they had more free time to prepare for the test during the pandemic (as seen from Item#3, ‘I studied more’, in Table 17 above). Their positive response was 44 on the 100-point scale.
Participant #238 (U.S., low-proficiency, IELTS General)
With the pandemic and work from home option, i got more time to study. The amount of time spent in travel, picking kids and running their extra curricular activities was saved and I was able to use it for my IELTS studies.
Participant #10 (China, low-proficiency, IELTS Academic)
During the pandemic I rarely had the opportunity to go outside the campus.
Therefore, most of the time I stayed in the library studying. I could study for 6 hours a day and sometimes even 8. My city was coping well with the pandemic so the negative effects were limited.
Participant #99 (South Korea, high-proficiency, IELTS Academic)
COVID hasn’t affected my plan. It is true that the worrying level gets higher, however there are still offline classes going on and online live classes are also available.
On the contrary to this idea, i think that as covid let people stay at home, this makes them be able to focus on their study, instead of going out and meeting friends outside.
Besides the additional time associated with the pandemic, some strategically used online resources to prepare for their test independently and with peers (i.e., almost 67 on the 100-point scale in Table 17).
Participant #59 (China, low-proficiency, IELTS Academic)
The pandemic changed the class delivery format. Now everything is online and I prefer online classes to offline classes.
Participant #90 (South Korea, low-proficiency, IELTS Academic)
Due to the pandemic, I often have virtual meetings through ZOOM and Goole MEET for practicing speaking with other people. It is really good to save my time and money.
Some also mentioned that because of the online format provided by IELTS during the pandemic, they felt less nervous and were able to release their full potential during the test.
Participant #26 (China, low-proficiency, IELTS Academic)
Because of the pandemic, the speaking test was video call. This to some extent made people feel less nervous compared to when we talk to an examiner in-person.
Participant #74 (China, high-proficiency, IELTS Academic & General)
The speaking part turned into video call. I quite like this format and I did not feel as nervous which was good for my test performance.
Overall, these examples illustrated the wide variety of the impacts of the COVID-19 pandemic on test-takers in the three countries represented in the present study.
6. Discussion
This study aimed to investigate IELTS test-takers’ use of online and offline resources in their test preparation efforts, test-takers’ perceptions of technology-based tests, and report on the impact of the COVID-19 pandemic on their IELTS plans. Prior to discussing the findings, it should be noted that participants from only three countries are represented and those participants were interested in different types of IELTS (i.e., Academic vs. General Training). The results have been discussed with these contextual factors in mind.
6.1 Resource use for test preparation
Examining IELTS test-takers’ preparation practices can offer advice and suggestions to prospective test-takers regarding how to prepare for IELTS. Also, different types of practice can have a great impact on test-takers’ scores (Winke & Lim, 2014). Test-takers’ access to resources in their circumstances, including online and offline resources, can shape their IELTS test preparation practices (Chappell et al., 2019). Test-takers’ attitudes can also be formed by their prior experiences of language learning and test-taking, and by other available input through their everyday lives. In this study, we examined participants’ use of online and offline resources separately for any differences based on geographic locations, test types, and proficiency level.
As for the online resources, 241 participants reported their use of over 689 different resources to prepare for their IELTS tests. Online resources were examined by both frequency and perception of resource use. Offline resources were analysed through the modes of self-study and social interactivity with others.
6.2 Types of online resources
The results of the survey pertaining to online resources revealed several novel findings of the types and perceptions of the resources in the three different countries. Overall, websites, social media, and mobile were the most common types of online resources when aggregated between the three countries. However, when separated by country, there were significant differences across three geographic locations. Chinese participants tended to use mobile apps much more frequently than did Korean and U.S.-based participants. When the individual app names were reviewed, Chinese participants identified several IELTS-specific apps that targeted the Chinese market. This finding is somewhat different from that of O’Sullivan et al. (2019) as their study showed that participants’ preferences and activities did not differ substantially in the different regions (i.e., the Middle East, East and Southeast Asia, and Central and South America). Even though the regional differences could be a factor in creating this difference, the lack of availability of such apps could be what likely resulted in Korean and U.S.-based participants to use social media and websites more frequently. However, the survey did not capture the device with which participants were using to access such social media and websites. It is plausible that participants in all countries were using mobile devices frequently to study, but in the current study, Chinese participants showed more benefits of the app affordances such as on-the-go access, notifications, and the potential of use while not connected to the internet.
When we further examined participants’ use of test preparation practice for different countries, test types, and proficiency, participants who had taken or intended to take IELTS Academic used online resources differently from those interested in IELTS General Training. That is, the group interested or who had taken IELTS Academic preferred mobile apps over websites. However, those interested in the IELTS General Training reported much more use of websites, the large part of which was YouTube channels, and relatively equal and low rates of mobile apps, social media, and online courses. Language skills often develop through interaction between learners and the language resources they encounter in their everyday lives (van Lier, 2004). Indeed, language learning environments can be situation- and context-specific. It is possible that some resources may be potentially available to a learner in a particular location (Chappell et al., 2019) while other resources may not be actually available and accessible day-to-day (e.g., YouTube not available in China). Such disparity could generate these differences in participants’ use of resources.
6.3 Self-perception of online resources
When comparing differences in perception (i.e., self-evaluation on 100-point Likert scales) between the countries, interesting differences emerged. These different results were largely due to the nature of the online resource (e.g., does it target IELTS preparation and is it a mobile app), the perceived need of such resources (e.g., U.S.-based participants self-reported a higher proficiency than did Chinese or Korean resources), the degree to which the resource targeted the learner (e.g., an app for graduate-school bound Chinese learner vs. a news website for a U.S.-based participant from a Spanish-speaking background), or other unmeasured factors. However, the similarity of the online nature of the resource can assist in forming some generalisations.
Firstly, participants from all three countries used resources on a daily basis in a consistent manner but the amount of time spent varied between countries. This is notable because, despite the different reasons for taking the test, IELTS test-takers seem to use online resources with similar frequency. Participants in all three countries were equally likely to use the online resource every day, and all countries were near the 50-point mark on the 100-point Likert scale. Participants found online resources useful because they were often specific to individual learners in their own activity (Kashiwa & Benson, 2018). Although our study did not examine the exact length of resource use and its relationship with participants’ actual needs, the perceived amount of practice needed for each learner could play a role in learning practice (Chappell et al., 2019).
The perceived usefulness and effects of such resources were also revealing.
Participants reported that all online resources equally contained helpful exercises, near the 60-point mark out of 100-point Likert scales. They were perceived to be especially helpful for reading skill improvement and least helpful for speaking improvement, although there were some differences between countries on these perceptions.
This finding is promising, as Kang et al. (2021) showed that the use of online resources (e.g., social media or online gaming) was not necessarily related to IELTS test-takers’ score improvement. Aside from English skill improvement, however, a portion of the positive perception of the online resources is related to increased motivation to study for IELTS. Motivation to continue studying is an important factor that may result in positive effects of resource use (Kang et al., 2021). For resource developers and those offering guidance to IELTS test-takers in their preparation efforts, motivation should not be overlooked.
While several differences were detected between participants from the three countries in regard to general impressions as well as perceptions of enjoyment and appropriate pedagogy, the trends largely did not differ across test types and proficiency. In other words, participants interested in either the Academic or General Training form of IELTS as well as those taking it for multiple reasons with varying proficiency levels seem to have generally positive impressions of online resources. This positive reaction was supported by participants’ open-ended comments (e.g. ‘I think the most useful resource is the online website’, Chinese #15, or ‘Online resources gave me more confidence, as I could understand how the test could be performed’, U.S. participant#186, or ‘I am more inclined to use online resources because it is time saving and can improve my efficiency’, Chinese #51). Overall, for the participants in the study especially during the pandemic situation, the use of online resources seemed to be perceived more positively and efficiently than before (e.g., Chappell et al., 2019).
6.4 Offline resource use
Offline resource use was captured in two sections: resources used to prepare for IELTS alone and resources for studying with peers. Overall, as for the IELTS specific preparation, there was a significant interaction effect for country and test type (i.e., IELTS Academic and IELTS General Training). That is, the Chinese participants interested in the IELTS Academic test used the IELTS-specific offline resources more as compared to those in Korea and the U.S. The difference was especially strong between U.S. participants taking the IELTS General Training and Chinese participants taking IELTS Academic. When we closely examined the item-level responses of offline resources, it was found that Chinese participants, when preparing for the IELTS Academic tests, tended to complete more IELTS practice exams and to study more with IELTS preparation books than Korean participants studying the IELTS Academic and U.S. students studying the IELTS General. That is, Chinese participants who were interested in the IELTS Academic test seemed to have taken more strategic approaches to target IELTS-specific features than Korean and U.S. participants in this study by completing more IELTS practice exams and studying with IELTS preparation books.
The findings regarding differences in IELTS candidates’ test preparation practices concur with that of previous research (Mickan et al., 2006) in which most IELTS candidates prepared for their tests by using practice materials, in particular published tests, although in their case study, the majority of the respondents sat for the IELTS General Training module, but not for the IELTS Academic.
In terms of offline study styles, Chinese and Korean participants who prepared for the IELTS Academic reported a stronger tendency to memorise their speaking task responses than U.S. participants. This memorisation technique of speaking task responses was particularly low with U.S.-based participants. This pattern was not found in IELTS essay writing, however. This pattern can perhaps be explained by EFL learners’ (i.e., Korean and Chinese participants) limited opportunities for English speaking. Test-takers’ access to language learning resources can be shaped by their living and studying contexts, as well as by the way they spend their time in their daily life (Benson et al., 2018). Due to such lack of opportunity or the limited quality of the opportunities (Chappell et al., 2019) that participants might have in the EFL contexts, it can be speculated that learners in China might develop their test-preparation strategies by memorising responses, particularly in speaking. Additional studies can be conducted regarding test-takers’ learning styles and test preparation strategies in relation to their access to learning materials and resources.
U.S. participants reported practising speaking English more frequently with a family member than Chinese or Korean participants. There were some potential differences found across proficiency levels; i.e., the high self-reported proficiency participants reported using English more at work and at home than the low proficiency ones. What is interesting is that some of the non-U.S. participants still seemed to use English to speak to family members and/or at their place of employment at times. This phenomenon was also detected in the case of Kang et al. (2021) in which Korean IELTS students shared their experience in practising English outside of their IELTS courses. This means that EFL learners could still practise their English in their daily life, although opportunities could be limited.
One important note is that we should consider test-takers’ personality differences in their test preparation practice (McNamara, 1987; Qian, 2009). Even though this topic is beyond the scope of the project, participants’ English practice at work or at home can vary from individual to individual. Such individual differences can have the potential to improve equality within language testing specific to different personality traits. Further research is needed on this matter.
The interaction effect between test type and country for participants’ use of offline resources can also be explained by the participants’ own reasoning for taking an IELTS test. The U.S.-based participants in this study were largely interested in the IELTS General Training for their immigration, work, and travel purposes; accordingly, they were more likely to need an IELTS score result as part of an application process. As such, they had high rates of using and reading general English books to prepare for their IELTS tests. Relatedly, U.S. participants reported they used English media (books, film, television, and radio) more frequently than Korean or Chinese participants, when they were asked about their general English practice. Additionally, those U.S. learners who prepared for the IELTS General reported that they were much less likely to engage in Academic and IELTS-specific activities with peers, and were much less likely to have reported attending an IELTS preparation course. On the other hand, most Korean and Chinese participants’ interest was the IELTS Academic for tertiary studies. Their goal might be to integrate IELTS preparation into a larger program of English language study for their success in studying in English. For this reason, their resource focus was primarily on IELTS preparation books, and they also indicated their likelihood to have attended an IELTS preparation course with their mean value of 52 and higher on the 100-point scale.
In fact, further research could examine the extent to which these different types of test preparations could affect IELTS candidates’ test scores, as this preparation process itself is quite complex (Chappell et al., 2019).
In addition, the differences across countries in the use of resources to prepare for IELTS with other people seem to be further moderated by the availability of such social resources in each locale. For example, U.S.-based test-takers were unsurprisingly more likely to speak and write in English for work and with their families. Accordingly, U.S. participants were less likely to take an IELTS preparation, in general, or academic English course than were Korean or Chinese participants. Previous studies demonstrated that attending IELTS preparation courses showed no benefit (Celestine & Ming, 1999), especially for those who were already in the workforce, may lack the time, awareness, and/or financial resources to attend formal courses (Ngyuen, 2007).
It is of particular note that all participants equally expressed their interest in participating in a conversation group, practicing with a native or non-native speaker, or exchanging IELTS writing practice with others. The similarity of the frequency of use amongst these social exchange resources indicated their relatively common willingness in these activities, despite the potential challenges in finding a conversation group, conversation partner, or other IELTS students in the three countries represented in the study. In the EFL countries (i.e., China and Korea), participants seemed to still utilise this resource by practising their English with another non-native speaker. This finding confirms the concept of interaction-based language learning in which learning happens from the interaction between the learner and interlocutors and other resources of affordance (Barron, 2006; van Lier, 2004). In sum, IELTS test-takers seem to prepare their tests by accessing available resources in their environment and circumstances of their everyday life.
In other cases, U.S. participants were not the outliers. They were no more or less likely to complete practice exams, study IELTS rubrics, listen to English-language radio, or watch videos online of teachers’ tips as compared to participants from China or Korea, hinting at some potentially universal practices for IELTS preparation. This complex picture of preparation resources and their relationship to test-taker types cannot be fully described with the design of the present study. As mentioned in the online resource discussion above, several participant comments indicated that geographical differences emerged in resource use because of the availability of internet, books, offline courses, and the cost of such resources as likely sources of country-level differences.
6.5 Test-takers’ perspectives on technology-based IELTS test
Findings from the survey section on perceptions of technology-based testing, although limited to three countries, can assist in understanding current perceptions of using technology to deliver IELTS. The EFA and factorial ANOVA results showed that there was a significant main effect found for country and proficiency but no interaction effect for country, test type, and proficiency. Group comparison analyses indicated that U.S. participants were much more interested in computer-based testing and were by far the most comfortable with a computer-based test at a testing centre, in comparison to participants in China and Korea. In addition, high proficiency participants seemed more comfortable with using computer technology for testing than did low ones overall.
Generally, all participant groups indicated a preference for a paper-based test at a test centre (i.e., all mean values were above the 50-point mark on a 100-point scale). However, some groups expressed equal amounts of interest in some forms of computer-based assessment, and seemed particularly uninterested in computer-based speaking testing.
This finding is in line with that of Kiddle and Kormos (2011) where test-takers generally seem to prefer in-person speaking assessment compared to computer-based speaking assessment. Similar to that of Fan and Ji’s (2014) finding, participants in the current study also preferred computer-based assessment of other skills rather than speaking; i.e., speaking was the least comfortable skill for computer-based assessment. It has been known that test-takers tend to prefer person-to-person interaction during the speaking exam, especially because of the interaction embedded in the test format and its relevant experience (McNamara, 1987; Qian, 2009). Testing centres may take note of these findings as they adjust their IELTS options during the ongoing COVID-19 pandemic.
However, large differences in comfort with computer-based testing at home (as well as completing the speaking section at home) were found between the three countries included in this study. U.S. participants were much more accepting of these options than Chinese or Korean participants. While the design of this study does not allow us to address these questions holistically, a comparison of the participant-related factors in the differences between these groups could provide insights into these findings. That is, Korean and Chinese participants’ acceptance rate for the computer-based test at home was around the 50-point mark or lower, which means that participants in these two countries were generally cautious about taking the computer-based IELTS tests at home. Indeed, factors such as home living arrangements can affect the quality of IELTS test-takers’ interactions in English (Chappell et al., 2019). Chinese and Korean participants in the EFL contexts might feel less secure about their test environment at home (Barron, 2010). However, other factors, such as test-taker expectations or anxiety, may also moderate perceptions of at-home testing.
Given the overall trend of U.S.-based participants and technology use for preparation and testing, the U.S. participants in this study, or perhaps a subset of them, may have been more accepting of technology overall. An examination of the U.S. participants’ interest revealed that for those who indicated they were taking IELTS for a career, 50% indicated a career in Engineering or IT. This interest in technology was also reflected in the highest group of general impressions and willingness to recommend online resources, despite average or lower perceptions of usefulness or positive effects of the same resources. Technology-oriented trends were found in the pandemic-related questions in which U.S.-participants were much more likely to search for an online IELTS option. Finally, U.S. participants were least likely to have taken courses, and therefore may be more inclined to study independently using technologies of all kinds. Again, this result could be related to IELTS candidates’ ESL environments in which English learning resources are more available in their living contexts (Chappell et al., 2019; Toohey et al., 2015). It also supports an argument that candidates’ contextual factors can determine their access to language learning resources (Benson et al., 2018). While these findings are far from conclusive, the differential results in comfort with technology-based testing specific to those who take IELTS in the U.S. merits additional investigation.
Finally, high proficiency participants were more interested in a computer-based test at a testing centre or at home than were low proficiency ones, a finding yet unseen in previous literature. While concrete evidence to establish this link is weak, it has been known that higher proficiency learners tend to maintain more strategic behaviours (Green & Oxford, 1995; Vandergrif & Goh, 2012) or utilise more effective strategies (Chen, 1990) than lower proficiency learners. It is possible that the high proficiency participants in this study might have found computer-based IELTS tests more strategically effective than the low proficiency participants. However, it should be noted that the U.S. participants in this study had higher IELTS scores than those from China and Korea. Given that U.S. participants indicated a higher preference for computer-based tests in general, this pattern might have emerged simply because of U.S. participants expressing their strong preference. Accordingly, this finding should not be generalised to other contexts.
6.6 Impacts of the COVID-19 pandemic
It is not surprising to see the varying influence of the COVID-19 pandemic on IELTS test-takers’ practices as the global pandemic has challenged the test administration of English proficiency tests (Harding & Winke, 2021; Muhammed & Ockey, 2021), as well as test-takers of many types (Ockey, 2021). Both the quantitative and open-ended comments on the impacts of the COVID-19 pandemic on test-takers’ plans and test preparation revealed the wide variety of severity and results of the pandemic on test-takers as individuals. However, no significant main effects or interactions were found for country, test type, and proficiency. This indicates that the pandemic impacted all groups of test-takers to a similar degree when considering impacts as a group. On average, most of the participants mentioned that they thought about delaying IELTS or had to delay / cancel IELTS at some point, i.e., near the midpoint (50 on the 100-point scale), as seen from participant #100 (Korean), who had to cancel the test date because their brother got Covid and they had to be in quarantine for 15 days. This pandemic certainly impacted IELTS test-takers at various levels.
While many had to change their testing plans throughout the three countries in this study, some reported that the pandemic had only minor impacts in their lives due to low infection rates in their locale, or even positive impacts. Participants in all three countries report they ended up studying more as they had to stay home more, e.g., participant #10, China, ‘During the pandemic I rarely had the opportunity to go outside the campus. Therefore, most of the time I stayed in the library studying. I could study for 6 hours a day and sometimes even 8.’
Additionally, others found that the lockdowns provided time and motivation for additional study, perhaps providing a silver lining to those engaged in test preparation during the pandemic. The only impacts that were different between countries captured in this study were the participants being unsure about taking the test, searching for an online option, and changing test centres, throughout all of which the U.S. had the highest rate. These differences may be due to the aforementioned trend of U.S. participants potentially having a higher acceptance of technology and the unpredictability of IELTS test-takers in the U.S. during the several waves of the COVID-19 pandemic.
In sum, the impacts of the COVID-19 on IELTS preparation and planning were likely felt by most test-takers throughout the world. Factors that drove the intensity and type of impacts of the pandemic are likely more context-specific to the individual (e.g., family / living situation, education / work stoppages). To better understand this pattern, however, further research is needed to identify what causes these changes and the differences among learners in various contexts.
7. Conclusion
The current project examined test-takers’ IELTS preparation as well as their attitudes towards their current IELTS practices and the use of technologies in the global pandemic. However, the study had a number of limitations. First, the geographic locations selected were limited to only three countries including two East Asian countries (South Korea and China) and the U.S. The study did not include test-takers’ responses from European, Middle Eastern, or African locations. The data collection contexts should be considered before any interpretation, and any generalisation of the findings should be made with caution.
Second, the reasons or motivation for taking IELTS differed across the participant groups. The participants in South Korea and China were interested in taking IELTS Academic while those in the U.S. were largely involved in General Training. This test type difference could affect test-takers’ responses and attitudes towards IELTS. Accordingly, confounding effects can occur from the interaction between geographic location and test type difference, although the current study tried to address this issue through the factorial ANOVA approach.
Third, participants’ proficiency was measured via their self-reports. For the purpose of examining any interaction effect with proficiency, the study treated this as a categorical variable. Yet, participants’ proficiency was different across groups with U.S. participants reporting being the most proficient, followed by those in China and South Korea. It is possible that this proficiency difference could lead to different preparation practices and styles.
Fourth, the study used the 100-point Likert scale for participants’ perceptual judgments. This approach can be controversial although we chose this particular scale after a series of pilot studies. This measurement method can be further validated by additional studies in the future.
Finally, all survey and interview responses were collected cross-sectionally from October 2020 to May 2021. This particular time restriction could influence the characteristics of participants and their responses. Context-specific interpretation of the findings is required. Future research can examine test-taker related issues from a longitudinal perspective in a more task-controlled context with a wider range of populations.
Despite these limitations, we believe that the findings can offer important implications to IELTS test-takers and teachers. They can also promote IELTS test development and administration, and technology-assisted language assessment and learning. First, listening to test-takers’ voices about their IELTS preparation (online vs. offline resources) and their current practices can inform prospective IELTS users, test developers, and practitioners to make informed decisions about tests in the target language use community. For example, websites, social media, and mobile were the most common types of online resources for current IELTS test-takers. Although there was a tendency for Chinese participants to use more mobile apps and U.S. participants to use more websites, participants from all three countries seemed to use online resources every day and find them useful. Based on these findings, perhaps IELTS can consider making more online resources available to support prospective IELTS test-takers in the future.
Next, when it comes to participants’ use of offline resources, there were differences in geographic locations and learners’ proficiency levels. Their IELTS test preparation style was also different (e.g., Chinese participants tried to memorise speaking responses more than U.S. participants). This information informs IELTS and other testing companies to better prepare test preparation materials and resources.
Third, as technological devices become increasingly part of daily life and as the global pandemic situations may arise unpredictably, the use of such technologies may be necessary for test administration. Technology-based assessment can increase test-taker friendly options such as interactivity, self-paced item presentation, or leveraging of the affordance of touchscreen technology. In this study, we found that participants (over 60%) still preferred in-person IELTS tests to computer-based ones. Then, when it comes to computer-based assessment, most of them felt less comfortable with the speaking exam than with other skills.
Knowing how test-takers respond to such a paper-based vs. computer-based assessment mode can be informative as IELTS can make an informed decision about the future test development and design. The findings of English learners’ perception of computer-based language assessment can also be of use to curriculum development and instructional planning in the field of teaching English as a second language.
Finally, the study attempted to offer empirical evidence for a better understanding of how different groups of IELTS test-takers across different geographic locations could be influenced by the global pandemic. Unsurprisingly, the pandemic seemed to have impacted all participants regardless of where they lived, but the impacts were both positive and negative. This result offers important implications for IELTS as it can customise its test delivery and administration in light of the ongoing pandemic. This information also provides insights for IELTS to increase its adaptability for unexpected situations.
References
- Bachman, L., & Palmer, A. (2010). Language assessment in practice. Oxford: Oxford University Press.
- Barron, B. (2006). Interest and self-sustained learning as catalysts of development: A learning ecology perspective. Human Development, 49, 193-224.
- Benson, P., Chappell, P. J., & Yates, L. (2018). A day in the life: Mapping international students’ language learning environments in Multilingual Sydney. Australian Journal of Applied Linguistics, 1(1), 20-32. https://doi.org/10.29140/ajal.v1n1.21
- Celestine, C. & Ming, C. S. (1999). The effect of background disciplines on IELTS scores. IELTS Research Reports, Volume 2, 36-51. IELTS Australia, Canberra and British Council, London. Available at https://www.ielts.org/-/media/research-reports/online-series-2021-2.ashx
- Chappell, P. J., Benson, P., & Yates, L. (2018). ELICOS students’ out-of-class language learning experiences: An emerging research agenda. English Australia Journal, 33(2), 43-48. Available at https://research-management.mq.edu.au/ws/portalfiles/portal/89466859/89416387.pdf
- Chappell, P., Yates, L., and Benson, P. (2019). Investigating test preparation practices: Reducing risks. IELTS Research Reports Online Series, No. 3. British Council, Cambridge Assessment English and IDP: IELTS Australia. Available at https://www.ielts.org/-/media/research-reports/2019-3-chappell_et_al_layout.ashx
- Chen, S. (1990). A study of communication strategies in interlanguage production by Chinese EFL learners. Language Learning, 40, 155-187.
- https://doi.org/10.1111/j.1467-1770.1990.tb01332.x
- Chou, P.-N., Chang, C.-C., & Lin, C.-H. (2017). BYOD or not: A comparison of two assessment strategies for student learning. Computers in Human Behavior, 74, 63-71. https://doi.org/10.1016/j.chb.2017.04.024
- Clark, T., Spiby, R. & Tasviri, R. (2021). Crisis, collaboration, recovery: IELTS and COVID-19. Language Assessment Quarterly, 18(1), 17-25.
- https://doi.org/10.1080/15434303.2020.1866575
- Creswell, J. W., & Clark, V. L. P. (2007). Designing and conducting mixed methods research. Sage Publications, Inc.
- Green, A. (2007). Washback to learning outcomes: A comparative study of IELTS preparation and university pre-sessional language courses. Assessment in Education Principles Policy and Practice, 14(1), 75-97 https://doi.org/10.1080/09695940701272880
- Fan, J. S., & Ji, P. Y. (2014). Test candidates’ attitudes and their test performance: The case of the Fudan English test. University of Sydney Papers in TESOL, 9, 1-35. Retrieved from http://faculty.edfac.usyd.edu.au/projects/usp_in_tesol/pdf/volume09/Article01.pdf
- Flowerdew, J., & Miller, L. (2005). Second language listening: Theory and practice. Cambridge: Cambridge University Press.
- Gan, Z. (2009). IELTS preparation course and student IELTS performance: A case study in Hong Kong. RELC journal, 40(1), 23-41. https://doi.org/10.1177/0033688208101449
- Gardiner, J., & Howlett, S. (2016). Student perceptions of four university gateway tests. University of Sydney Papers in TESOL, 11, 67-96. Available at https://faculty.edfac.usyd.edu.au/projects/usp_in_tesol/pdf/volume11/Article03.pdf
- Green, B. A. & Lung, Y. S. M. (2021). English language placement testing at BYU-Hawaii in the time of COVID-19. Language Assessment Quarterly, 18(1), 6-11.
- https://doi.org/10.1080/15434303.2020.1863966
- Green, J. M. & Oxford, R. (1995). A closer look at learning strategies, L2 Proficiency, and gender. TESOL Quarterly, 29(2), 261-297. https://doi.org/10.2307/3587625
- Hamid, M. O. (2014). World Englishes in international proficiency tests. World Englishes, 33(2), 263-277. https://doi.org/10.1111/weng.12084
- Hamid, M. O., Hardy, I., & Reyes, V. (2019). Test-takers’ perspectives on a global test of English: Questions of fairness, justice, and validity. Language Testing in Asia, 9, 1-20. https://doi.org/10.1186/s40468-019-0092-9
- Harding, L., & Winke, P. (2021). Editorial 2021. Language Testing, 38(1), 3-5. https://doi.org/10.1177/0265532220965757
- Isaacs, T., & Thomson, R. I. (2013). Rater experience, rating scale length, and judgments of L2 pronunciation: Revisiting research conventions. Language Assessment Quarterly, 10, 135-159. https://doi.org/10.1080/15434303.2013.769545
- Isbell, D. R. (2017). Assessing pronunciation for research purposes with listener-based numerical scales. In O. Kang & A. Ginther (Eds.), Assessment in Second Language Pronunciation (pp. 89-111). Routledge.
- Isbell, D. R., & Kremmel, B. (2020). Test Review: Current options in at-home language proficiency tests for making high-stakes decisions. Language Testing, 37(4), 600-619. https://doi.org/10.1177/0265532220943483
- Kane, M. T. (2006). Validation. In R. L. Brennan (Ed.), Educational measurement (4th ed., pp. 17-64). Washington, DC: American Council on Education/Praeger.
- Kang, O., Ahn, H. Yaw, K., & Chung, S-Y. (2021). Investigation of relationships among learner background, linguistic progression, and score gain on IELTS. IELTS Research Reports Online Series, No. 1. British Council, Cambridge Assessment English and IDP: IELTS Australia. Available at https://www.ielts.org/teaching-and-research/research-reports
- Kashiwa, M., & Benson, P. (2018). A road and a forest: Conceptions of the relationship between in-class and out-of-class learning at home and abroad. TESOL Quarterly, 52(4), 725-747.
- Khaldieh. (2000). Learning strategies and writing processes of proficient vs. less-proficient learners of Arabic. Foreign Language Annals, 33(5), 522-534. https://doi.org/10.1111/j.1944-9720.2000.tb01996.x
- Kiddle, T., & Kormos, J. (2011). The effect of mode of response on a semi-direct test of oral proficiency. Language Assessment Quarterly, 8(4), 342-360.
- https://doi.org/10.1080/15434303.2011.613503
- Liu, O. (2014). Investigating the relationship between test preparation and TOEFL iBT performance. ETS Research Report No RR-14-15. Hoboken, NJ: Wiley. https://doi.org.10.1002/ets2.12016
- Mackey, A., & Gass, S. M. (2021). Second language research: Methodology and design. Lawrence Erlbaum.
- McNamara, T. F. (1987). Assessing the language proficiency of health professionals. Recommendations for the reform of the Occupational English Test, Melbourne, Australia: Department of Russian and Language Studies, University of Melbourne. Report submitted to the Council of Overseas Professional Qualifications.
- Messick, S. (1989). Validity. In R. L. Linn (Ed.), Educational measurement (3rd ed., pp. 13-103). New York: Macmillan.
- Mickan, P., & Motteram, J. (2006). The preparation practices of IELTS candidates: Case studies. IELTS Research Reports, Volume 10, pp. 223-243. IELTS Australia, Canberra and British Council, London. Available at https://www.ielts.org/-/media/research-reports/ielts_rr_volume10_report5.ashx
- Muhammad, A. A., & Ockey, G. J. (2021). Upholding language assessment quality during the COVID-19 pandemic: Some final thoughts and questions. Language Assessment Quarterly, 18(1), 51-55. https://doi.org/10.1080/15434303.2020.1867555
- Nguyen, T. N. H. (2007). Effects of Test Preparation on Test Performance - the case of the IELTS and TOEFL iBT Listening Tests. Melbourne Papers in Language Testing, 1-24. Available at https://arts.unimelb.edu.au/_data/assets/pdf_file/0008/3518684/12_1_1_Nguyen.pdf
- O’Sullivan, B., Dunn, K., & Berry, V. (2019). Test preparation: an international comparison of test-takers’ preferences. Assessment in Education: Principles, Policy & Practice, 28(1), 13-36. https://doi.org/10.1080/0969594X.2019.1637820
- Ockey, G. J. (2021). An overview of COVID-19’s impact on English language university admissions and placement tests. Language Assessment Quarterly, 18(1), 1-5. https://doi.org/10.1080/15434303.2020.1866576
- Ockey, G. J., Muhammad, A. A., Prasetyo, A. H., Elnegahy, S., Kochem, T., Neiriz, R., Kim, H., & Beck, J. (2021). Iowa State University’s English placement test of oral communication in times of COVID-19. Language Assessment Quarterly, 18(1), 26-35. https://doi.org/10.1080/15434303.2020.1862122
- Papageorgiou, S., & Manna, V. F. (2021). Maintaining access to a large-scale test of academic language proficiency during the pandemic: The launch of TOEFL iBT Home Edition. Language Assessment Quarterly, 18(1), 36-41.
- https://doi.org/10.1080/15434303.2020.1864376
- Purpura, J. E., Davoodifard, M., & Voss, E. (2021). Conversion to remote proctoring of the Community English Language Program Online Placement Exam at Teachers College, Columbia University, Language Assessment Quarterly, 18(1), 42-50.
- https://doi.org/10.1080/15434303.2020.1867145
- Qian, D. D. (2009). Comparing direct and semi-direct modes for speaking assessment: Affective effects on test-takers. Language Assessment Quarterly, 6(2), 113-125. https://doi.org/10.1080/15434300902800059
- Rose, H., McKinley, J., & Briggs Baffoe-Djan, J. (2020). Data collection research methods in applied linguistics. London: Bloomsbury.
- Stankov, L., Lee, J., Luo, W., & Hogan, D. J. (2012). Confidence: A better predictor of academic achievement than self-efficacy, self-concept and anxiety? Learning and Individual Differences, 22(6), 747-758. https://doi.org/10.1016/j.lindif.2012.05.013
- Toohey, K., Dagenais, D., Fodor, A., Hof, L., Nunez, O., & Singh, A. (2015). “That sounds so cool”: Digital tools and literacy practices. TESOL Quarterly, 49 (3), 461-485. https://doi.org/10.1002/tesq.236
- van Lier, L. (2004). The ecology and semiotics of language learning: A sociocultural perspective. Boston, MS: Kluwer.
- Vandergrift, L., & Goh, C. C. M. (2012). Teaching and Learning Second Language Listening. New York, NY: Routledge, Taylor & Francis Group.
- Wagner, E., & Krylova, A. (2021). Temple University’s ITA Placement Test in times of COVID-19. Language Assessment Quarterly, 18(1), 12-16.
- https://doi.org/10.1080/15434303.2020.1862849
- Wagner, E., & Kunnan, A. J. (2015). The Duolingo English test. Language Assessment Quarterly, 12(3), 320-331. https://doi.org/10.1080/15434303.2015.1061530
- Wharton. (2000). Language learning strategy use of bilingual foreign language learners in Singapore. Language Learning, 50(2), 203-243.
- https://doi.org/10.1111/0023-8333.00117
- Winke, P., & Lim, H. (2014). Effects of test-wiseness and test-taking anxiety on L2 listening test performance: A visual (eye-tracking) and attentional investigation. IELTS Research Reports, No. 3. IELTS Partners: British Council, Cambridge English Language Assessment and IDP: IELTS Australia. Available at https://www.ielts.org/-/media/research-reports/ielts_online_rr_2014-3.ashx
- Yan, X., & Ginther, A. (2017). Listeners and raters: Similarities and differences in evaluation of accented speech. In O. Kang & A. Ginther (Eds.), Assessment in Second Language Pronunciation (pp. 67-88). Taylor and Francis.
- Yu, G., He, L., Rea-Dickens, P., Kiely, R., Lu, Y., Zhang, J., … Fang, L. (2017). Preparing for the Speaking tasks of the TOEFL iBT test: An investigation of the journeys of Chinese test-takers. ETS TOEFL iBT Research Report No. RR-17-19. Hoboken, NJ: Wiley. https://doi.org/10.1002/ets2.12145
Appendix A: Online questionnaire
1. Informed consent
You are being invited to participate in a research study titled ‘Test-takers’ Attitudes and Perceptions Towards IELTS and the Use of Mobile-assisted Technologies in Test Preparation’. This study is being done by Okim Kang from Northern Arizona University.
The purpose of this research study is to determine the resources used to prepare for the IELTS and test-taker perceptions of these resources, particularly considering available internet-based resources. If you agree to take part in this study, you will be asked to complete an online questionnaire. This questionnaire will ask about your test preparation practices and your views of possible delivery changes of the IELTS. It will also provide a short, simulated test. Overall, it will take you approximately 60 minutes to complete. After the online questionnaire, you will be contacted once for an optional email follow-up survey.
You may not directly benefit from this research; however, we hope that your participation in the study may increase our scientific understanding of IELTS preparation practices. We believe there are no known risks associated with this research study; however, as with any online-related activity, the risk of a breach of confidentiality is always possible. To the best of our ability, your answers in this study will remain confidential. We will minimize any risks by removing your personally identifiable information as soon as the compensation process is complete.
Your participation in this study is completely voluntary and you can withdraw at any time. You are free to skip any question that you choose. If you choose not to participate, it will not affect your relationship with Northern Arizona University or result in any other penalty or loss of benefits to which you are otherwise entitled. For participants who complete all questions on the online questionnaire, you will be compensated with an Amazon gift card in the value of $40 USD. You are not required to complete the optional follow-up email survey to receive your gift card.
If you have questions about this project or if you have a research-related problem, you may contact the researcher(s), Okim Kang at XXX-XXXX. If you have any questions concerning your rights as a research subject, you may contact Northern Arizona University IRB Office at irb@nau.edu or XXX-XXXX.
By submitting this survey, I affirm that I am at least 18 years of age and agree that the information may be used in the research project described above.
□ Agree and continue
□ I do not agree
2. Pre-study screening questionnaire
Instructions: Please answer the following questions as carefully as possible.
a) Are you currently studying for IELTS?
□ Yes □ No
b) Do you plan on taking IELTS in the next 12 months?
□ Yes □ No
c) Have you taken IELTS within the past 24 months?
□ Yes □ No
Thank you for your interest in this survey. Before you continue, we would like to verify your eligibility. Please contact XXX at XXX with information about your intention to take IELTS or history taking IELTS.
3. Background questionnaire
This survey may take up to an hour. It is better to complete it all at once. However, you may use the same link on the same device and browser to return to the survey and continue. The survey must be completed within 24 hours. We need some background information from you in order to compensate you and to contact you one time about the survey. Please answer the following questions as carefully as possible.
a) What is your first (given) name?
b) What is your last (family) name?
c) What is your email address?
d) Which city / town are you currently in?
e) Which country are you currently in?
f) What is your first / native language(s)?
g) What other language(s) do you speak?
h) What is your gender? □ Female □ Male □ Prefer not to share
i) On a scale of 1 to 5, how do you currently rate your abilities in English in listening, reading, speaking, and writing?
Listening (1 = low proficiency, 5 = high proficiency)
Reading (1 = low proficiency, 5 = high proficiency)
Speaking (1 = low proficiency, 5 = high proficiency)
Writing (1 = low proficiency, 5 = high proficiency)
low proficiency high proficiency
j) Which IELTS test do you plan to take / did you take?
□ Academic □ General Training □ Both □ I’m not sure yet
k) Are / were you planning on taking the IELTS to travel to another country? □ Yes □ No
l) Are / were you taking the IELTS for … (select all that apply)
□ An undergraduate degree program □ A graduate degree program
□ Job / work immigration □ Other (please explain in detail)
m) You indicated that you are taking IELTS for immigration purposes.
Which country / countries require IELTS?
n) You indicated that you are taking IELTS for job / work purposes.
Which career(s) / job(s)?
o) How many times have you taken IELTS before?
□ 0 □ 1 □ 2 □ 3 □ 4 □ 5 and/or more
p) When did you last take IELTS? (day / month / year)
q) Did you take the IELTS Indicator online test? □ Yes □ No
r) Please report your most recent test scores
(if you have not received your scores, please write N/A).
Listening Reading Writing Speaking s) How much time do you spend / were you spending online just to prepare for IELTS every day on average?
□ 0 - 15 minutes
□ 15 - 30 minutes
□ 30 minutes - 1 hour
□ 1 - 2 hours
□ 2 or more hours
t) The IELTS test has four sections: listening, reading, writing, and speaking.
How much time do you / did you plan to study for …
Listening (1 = very little time, 5 = a great amount of time)
Reading (1 = very little time, 5 = a great amount of time)
Writing (1 = very little time, 5 = a great amount of time)
Speaking (1 = very little time, 5 = a great amount of time)
Very little time                                                  A great amount of time
0    10         20      30        40    50      60    70     80      90    100
u) How frequently do you / did you plan to study IELTS in each skill?
| Item | Every day | 3-6 times/week | 1-3 times/w | less than once /w |
|---|---|---|---|---|
| Listening | □ | □ | □ | □ |
| Reading | □ | □ | □ | □ |
| Writing | □ | □ | □ | □ |
| Speaking | □ | □ | □ | □ |
4. Online resource list
Instructions: Please make a list of the online resources you are / were using to practice your English or prepare for IELTS, including social media pages, websites, mobile apps, games, or other internet-based resources. Be specific in your responses.
For example, you may indicate: An IELTS-related mobile app (雅思哥 or the IELTS App) IELTS preparation website (ielts.org), a social video game in English (Second Life), online videos or news in English (BBC, CNN, or a specific YouTube channel) an English language website (learningenglish.voanews.com, Dave’s ESL café, National Geographic), and a social media page (IELTS preparation Facebook group). Please provide the names of three online resources in order for you to proceed with this survey.
a) Most frequently used online resource #1 b) Most frequently used online resource #2 c) Most frequently used online resource #3
5. Resource Evaluation #1, #2, and #3 (with same questions)
a) What kind of resource is ‘Most frequently used online resource #1’? Choose one:
□ Mobile app □ Website
□ Social Media
□ Online course
□ Social video games
□ Other (explain)
b) What does ‘Most frequently used online resource #1’ target?
What is this resource for?
□ IELTS preparation □ Other high-stakes English test preparation □ General English skills ☐ It does not target English, but I learn English when I use it
c) What do you like best about ‘Most frequently used online resource #1’? (Please feel free to answer this question in your first language/s.) d) What could make ‘Most frequently used online resource #1’better? (Please feel free to answer this question in your first language/s.)
Instructions: Please answer the following questions about your experience with ‘Most frequently used online resource #1’ by moving the slider.
e) I use / used this resource every day f) I use / used this resource for several hours when I access it g) I think that I improved my listening with this resource h) I think I improved my writing with this resource i) I think that I improved my speaking with this resource j) I think I improved my reading with this resource k) I would recommend this resource for preparing for IELTS l) This resource motivates / motivated me to study for IELTS m) I think this resource can satisfy my learning needs n) My general impressions of this resource are positive o) I like the way I learn using this resource p) This resource is fun for people my age q) This resource has helpful exercises r) This resource offers practice that I cannot find in other resources
not at all                                                            very much
0    10       20        30     40       50    60      70     80      90 100
6. Offline resource survey
Instructions: Please answer the following questions as carefully as possible.
What other ways do / did you prepare for the IELTS alone?
a) complete IELTS practice exams b) study with IELTS preparation books by myself (e.g., vocabulary for IELTS) c) study IELTS grading rubrics / criteria for writing d) study IELTS grading rubrics / criteria for speaking e) read books in English
f) read newspapers and magazines in English
g) listen to English-language radio
h) watch TV / movies / videos in English
i) watch videos online of teachers’ tips j) prepare for IELTS speaking topics by memorizing possible responses k) read sample IELTS essays written by IELTS teachers / examiners
l) read sample IELTS essays written by proficient IELTS students
m) memorise sample IELTS essays
| Score | Anchor |
|---|---|
| 0 | Never |
| 10 | |
| 20 | |
| 30 | |
| 40 | |
| 50 | |
| 60 | |
| 70 | |
| 80 | Very frequently |
| 90 | |
| 100 |
What other ways do you prepare for the IELTS with other people?
n) attend an IELTS preparation course o) take a general English course (i.e., one that does not target IELTS preparation) p) take an academic English course q) participate in a conversation group r) practice speaking English with a native speaker s) practice speaking English with a non-native speaker t) practice speaking English with my family u) speak in English at work v) write in English at work w) exchange IELTS writing with other IELTS students
| Score | Anchor |
|---|---|
| 0 | Never |
| 10 | |
| 20 | |
| 30 | |
| 40 | |
| 50 | |
| 60 | |
| 70 | |
| 80 | |
| 90 | |
| 100 | Very frequently |
7. Reflection survey questions
When you prepare for IELTS, what is the best approach to using resource?
a) I prefer to keep using the online resources I know b) I prefer to find new online resources c) I prefer to keep using the offline (books, papers, in-person courses) that I know d) I prefer to find new offline resources e) I like to use 1-2 resources that I am familiar with f) I like to use many resources g) I like to use both online and offline resources
| Score | Anchor |
|---|---|
| 0 | Strongly disagree |
| 10 | |
| 20 | |
| 30 | |
| 40 | |
| 50 | |
| 60 | |
| 70 | |
| 80 | |
| 90 | Strongly agree |
| 100 |
Instructions: We would like you to reflect on the resources you told us about. Please answer as completely as possible and do not worry about your grammar and vocabulary.
h) Which preparation resource seems the most helpful? Is it online or offline?
(Please feel free to answer this question in your first language/s.)
i) Considering all resources you have used, which resource seems the least helpful? Is it offline or online?
(Please feel free to answer this question in your first language/s.)
j) Do you use any other test preparation strategies besides those mentioned?
(Please feel free to answer this question in your first language/s.)
k) What advice would you give to other IELTS test-takers to better prepare?
(Please feel free to answer this question in your first language/s.)
8. Pandemic-related questions
In this part, we would like to know how your IELTS study was influenced by the COVID-19 pandemic.
How has the pandemic impacted your IELTS plans?
a) I searched for an online option for IELTS (or not applicable) b) I thought about delaying my IELTS test date (or not applicable) c) I had to delay or cancel my IELTS (or not applicable) d) The pandemic did not affect my IELTS plan (or not applicable) e) I was unsure if I should take IELTS (or not applicable) f) I had to change my IELTS testing centre (or not applicable) g) I studied less (or not applicable) h) I studied more (or not applicable)
| Score | Anchor |
|---|---|
| 0 | completely disagree |
| 10 | |
| 20 | |
| 30 | |
| 40 | |
| 50 | |
| 60 | |
| 70 | |
| 80 | completely agree |
| 90 | |
| 100 |
i) Has the pandemic impacted your IELTS plans in any other ways?
(Please feel free to answer this question in your first language/s.)
9. Attitudes about an online IELTS option
Instructions: Please answer the questions below about your comfort with taking IELTS online.
How comfortable would you feel taking IELTS …
a) with a paper-based test at a test centre? b) with a computer-based test at a test centre? c) with a computer-based test at home? d) speaking section on a computer at testing centre? e) speaking section on a computer at home?
| Score | Anchor |
|---|---|
| 0 | Not comfortable at all |
| 10 | |
| 20 | |
| 30 | |
| 40 | |
| 50 | |
| 60 | |
| 70 | |
| 80 | Extremely comfortable |
| 90 | |
| 100 |
10. Attitudes about WE & fairness
Instructions: The IELTS listening and speaking sections typically contain accents from the UK, Canada, USA, or Australia. Given that other countries also speak English (India, Singapore, Malaysia, etc.), we would like to ask you about your thoughts on whether IELTS should include other accents and varieties/types of English. Please answer the following questions as carefully as possible.
Do you think IELTS listening should include…
a) Native English accents only? b) Native and Non-Native English accents?
| Score | Anchor |
|---|---|
| 0 | strongly disagree |
| 10 | |
| 20 | |
| 30 | |
| 40 | |
| 50 | |
| 60 | |
| 70 | |
| 80 | |
| 90 | strongly agree |
| 100 |
c) Why do you think that? (Please feel free to answer this question in your first language/s.)
In an IELTS listening test, do you think the following accents are acceptable?
d) Indian
e) Singaporean
f) ‘Participants’ first language
g) Korean
h) Chinese
i) Egyptian
j) Japanese British (U.K.)
k) American (U.S.)
I) Australian
| Score | Anchor |
|---|---|
| 0 | Not acceptable at all |
| 10 | |
| 20 | |
| 30 | |
| 40 | |
| 50 | |
| 60 | |
| 70 | |
| 80 | |
| 90 | Very acceptable |
| 100 |
m) How happy would you be to hear an accent similar to yours in the IELTS listening section?
| Score | Anchor |
|---|---|
| 0 | Very unhappy |
| 10 | |
| 20 | |
| 30 | |
| 40 | |
| 50 | |
| 60 | |
| 70 | |
| 80 | |
| 90 | Very happy |
| 100 |
n) Why or why not? (Please feel free to answer this question in your first language/s.)
11. Final question
a) Do you have any final comments about the survey?
RQ#1: Online resource item factor loading scores (1 factor solution)
| Item | Factor 1 |
|---|---|
| 1. I use / used this resource every day | 0.60 |
| 2. I use / used this resource for several hours when I access it | 0.58 |
| 3. I think that I improved my listening with this resource | 0.57 |
| 4. I think I improved my writing with this resource | 0.43 |
| 5. I think that I improved my speaking with this resource | 0.53 |
| 6. I think I improved my reading with this resource | 0.49 |
| 7. I would recommend this resource for preparing for IELTS | 0.78 |
| 8. This resource motivates / motivated me to study for IELTS | 0.77 |
| 9. I think this resource can satisfy my learning needs | 0.79 |
| 10. My general impressions of this resource are positive | 0.76 |
| 11. I like the way I learn using this resource | 0.85 |
| 12. This resource is fun for people my age | 0.61 |
| 13. This resource has helpful exercises | 0.64 |
| 14. This resource offers practice that I cannot find in other resources | 0.59 |
RQ#2: Offline resource (alone) item factor loading scores (2 factor solution)
| Item | Factor 1 | Factor 2 |
|---|---|---|
| 1. Complete IELTS practice exams | 0.52 | -0.01 |
| 2. Study with IELTS preparation books by myself (e.g., vocabulary for IELTS) | 0.58 | -0.02 |
| 3. Study IELTS grading rubrics/criteria for writing | 0.72 | 0.02 |
| 4. Study IELTS grading rubrics/criteria for speaking | 0.70 | 0.08 |
| 5. Read books in English | -0.05 | 0.80 |
| 6. Read newspapers and magazines in English | -0.13 | 0.86 |
| 7. Listen to English-language radio | 0.17 | 0.52 |
| 8. Watch TV / movies / videos in English | 0.00 | 0.61 |
| 9. Watch videos online of teachers’ tips | 0.46 | 0.15 |
| 10. Prepare for IELTS speaking topics by memorizing possible responses | 0.72 | -0.14 |
| 11. Read sample IELTS essays written by IELTS teachers / examiners | 0.72 | -0.04 |
| 12. Read sample IELTS essays written by proficient IELTS students | 0.56 | 0.14 |
| 13. Memorise sample IELTS essays | 0.56 | -0.04 |
RQ#2: Offline resource (with peers) item factor loading scores (3 factor solution)
| Item | Factor 1 | Factor 2 | Factor 3 | |
|---|---|---|---|---|
| 1. | Take an IELTS course | 0.55 | -0.13 | 0.01 |
| 2. | Take a general English course | 0.71 | 0.03 | -0.02 |
| 3. | Take an academic English course | 0.83 | -0.10 | -0.06 |
| 4. | Participate in a conversation group | 0.17 | -0.09 | 0.74 |
| 5. | Practice speaking English with a native speaker | -0.08 | 0.03 | 0.81 |
| 6. | Practice speaking English with a non-native speaker | 0.57 | 0.04 | 0.05 |
| 7. | Practice speaking English with my family | 0.04 | 0.42 | 0.21 |
| 8. | Speak in English at work | -0.13 | 0.98 | -0.04 |
| 9. | Write in English at work | 0.00 | 0.95 | -0.12 |
| 10. | Exchange IELTS writing with other IELTS students | 0.50 | 0.24 | 0.02 |
RQ#2: Testing technology item factor loading scores (1 factor solution)
| Item | Factor 1 |
|---|---|
| 1. with a paper-based test at a test centre? | -0.26 |
| 2. with a computer-based test at a test centre? | 0.57 |
| 3. with a computer-based test at home? | 0.86 |
| 4. speaking section on a computer at testing centre? | 0.44 |
| 5. speaking section on a computer at home? | 0.72 |
RQ#3: Impact of pandemic item factor loading scores (1 factor solution)
| Item | Factor 1 |
|---|---|
| 1. I searched for an online option for IELTS (or not applicable) | 0.84 |
| 2. I thought about delaying my IELTS test date (or not applicable) | 0.84 |
| 3. I had to delay or cancel my IELTS (or not applicable) | -0.05 |
| 4. The pandemic did not affect my IELTS plan (or not applicable) | 0.58 |
| 5. I was unsure if I should take IELTS (or not applicable) | 0.57 |
| 6. I had to change my IELTS testing centre (or not applicable) | 0.41 |
| 7. I studied less (or not applicable) | 0.50 |
| 8. I studied more (or not applicable) | -0.48 |