
Task design in IELTS Academic Writing Task 1: The effect of quantity and manner of presentation of information on candidate writing
Official IELTS research report on IELTS Test - Writing, published in 2003.
Abstract
This paper reports on a study into task difficulty in the IELTS Academic writing Task 1. The study examined firstly, the extent to which the difficulty of the task is affected by the amount of information provided to the candidate and secondly, the extent to which the difficulty of the task is affected by the presentation of the information to the candidate.
In the Academic Writing Task 1 candidates are required to examine a diagram or table, and to present the information in their own words (IELTS 2000). Four tasks, which differed in terms of the amount of information the candidates were required to process to complete the task, were developed for the study. Two of the tasks included less information on which candidates could base their responses and the other two included more information. Within each of these two types of tasks, one was designated as the control, and the other was designated as the experimental task. Five different versions of each of the two experimental tasks were developed. These versions differed in the way the stimulus material was presented to candidates. The control tasks were designed as benchmark tasks and administered to all candidates. The experimental tasks were administered to selected subgroups of the cohort.
Two hundred and ten students, who were enrolled in English for Academic Purposes (EAP) courses in Melbourne or Sydney, completed four of the writing tasks (the two control tasks and two other experimental tasks). All scripts were double rated by trained and qualified IELTS raters. Analyses of the test scores and the scripts themselves were then undertaken.
Introduction
Written assessment tasks are designed with a view to providing an adequate sample of written discourse to make appropriate and reliable assessments of the linguistic skill of the candidate. In high stakes tests, such as IELTS, where important decisions are made on the test results, it is critical that the tasks are all comparably difficult. Thus, one of the goals in developing assessment tasks must be to ensure comparability across different administrations. In order to do this it is essential that we know much more about the tasks, how candidates approach them, and what makes a task more or less difficult. This study was designed to investigate these issues.
Previous research into the impact of task variability in oral language has suggested that relatively small variations in task design can influence the linguistic output of learners (Foster 1996, Foster & Skehan 1996, Skehan & Foster 1997, Mehnert 1998, Ortega 1999). As has been the case with much investigation of the effects of task design, for the most part these studies have been carried out in the classroom context. The focus of these studies has been on how different tasks can influence different aspects of learner language - for example, do particular task types promote more fluent language, or more accurate language? To shed insight onto these questions, these studies have involved highly detailed analyses of the oral linguistic output of the learners. A range of measures have been used to examine these differences, and while general conclusions may be drawn, the necessarily small scale of such studies, and the lack of comparability of measures (see Foster, Tonkyn & Wigglesworth 2000 for further discussion of this issue), has limited the conclusions which may be drawn.
Recent investigation of these phenomena in the testing situation, however, have allowed a different approach. Because most testing situations allow substantial numbers, it has sometimes been possible to examine both rater perceptions of differences according to task, and to include a more detailed analysis at the discoursal level. These recent studies have suggested that, once again, relatively small-scale variations in the task can influence the output (see for example, Wigglesworth 1997, 2001). To date, however, these studies have investigated oral language, rather than written language.
The question of the extent to which the specific task prompt affects second language writing is a vexed one. In the first language literature there have been studies which have argued that both the quality and quantity of an essay’s content can be influenced by the topic, although other studies have argued that the topic has little effect on scores (Hamp-Lyons 1990). The large and much cited study by Carlson, Bridgeman, Camp & Waanders (1985) which investigated the Test of Written English (TWE) and looked at the effect of topic on scores, claimed that the correlations suggested no significant differences in how the different topics and task types were ranking students. However, Carlson (1986 cited in Polio & Glew 1996) found that there were significant differences in the means of scores on different types of writing tasks but not on different topics.
One of the problems with the assessment of productive language skills, and the ability to determine which type of task is more or less difficult is that there are a series of interactions which take place. Firstly, the test taker, or candidate, interacts with the task. Thus, there may be an issue of familiarity with the content of the task. There may be more or less supporting material provided with the task. There may be a choice of which task to choose. The second major interaction which takes place is the rater’s interaction with the candidate’s writing. The rater approaches the writing using either a holistic or an analytic scale or a mixture of the two. But the rater does not only interact with the student’s writing; the rater also interacts with the task itself. The rater may consider the task to be more or less difficult than another task, and may compensate for this in applying the score to the writing. As Polio and Glew (1996) point out, this raises a problem for studies which investigate how the prompt affects writing. This is because conclusions about writing quality are almost invariably based on the score provided by the rater which has not taken into account the way in which the rater may or may not compensate for the perceived difficulty of the task.
Kroll (1998) has argued that a great deal more research needs to be conducted in the writing assessment area on a number of critical variables, of which she identifies the writing task as one. She suggests that we need to develop a greater understanding of both how to control the range of variables, and of what to assess.
Investigations into whether different task prompts elicit language which is different in quantity and quality have been controversial (Hamp-Lyons & Kroll 1996). A number of studies have claimed that the topic does affect language differentially, while other have argued that there are no significant differences as a result of topic content. However, these studies have not examined the written output of the candidate at the level of the language - thus ratings have been conducted but there has to date been little investigation of the actual writing itself.
Various studies have examined the discourse of learner writing, and the focus of some has been the investigation of linguistic accuracy. These have included studies which have examined the written output of learners to determine whether the writer’s accuracy changes under different conditions (e.g. Koyabashi & Rinnert 1992, Kroll 1990). However, these studies have looked only at the written output and the essays have not been rated.
In a recent study, Wigglesworth (1999) undertook a detailed examination of four different tasks administered to the same fifteen candidates where each was rated by two independent raters as part of a larger batch of assessed scripts (so as to ensure that the raters would not recognise the same candidates from their scripts). Of the four tasks, two required the learners to write a report, whilst two required them to write a recount of a recent event. In addition, an analysis was undertaken which identified error-free T units and clauses. The analyses suggested that in the report tasks, candidates used more complex, but less accurate language, whereas in the recount tasks the language was less complex but more accurate. This concords with the now substantial investigations of the language used in oral tasks, where it has been argued that there is a trade-off effect between accuracy and complexity (Skehan 1998). This conclusion has resulted from a substantial number of studies which have been carried out in second language classrooms although many of these have focused on oral language.
The brief findings reported above indicate that there is a need for further in-depth investigation of a variety of aspects of the testing situation and that these may make important contributions to our understanding of the testing process. Quantitative analyses are required for the purposes of determining reliability and validity of the testing instrument. However, more detailed qualitative analyses of the discourse are also necessary. These can inform our understanding of how candidates approach the task and of the extent to which different variables in tasks can be manipulated to affect different outcomes for candidates. Additionally they will contribute to the process of task development through providing insights into how the language produced by the candidates may vary with the task. This project was designed to investigate some of these issues in relation to Academic Writing Task 1 in IELTS, in a study which addresses the issues from both a quantitative and a qualitative point of view.
Two specific research questions were addressed in this study:
To what extent is the difficulty of the task affected by the amount of information provided to the candidate?
To what extent is difficulty of the task affected by the presentation of the information to the candidate?
Methodology
Phase 1: Task Development
Four tasks were developed which met the criteria for Academic Writing Task 1 where candidates are required to examine a diagram or table, and to present the information in their own words (IELTS 2000). These were based on topics and task designs used in the academic writing module over the last five years. Permission to do this was granted by IELTS and the tasks were submitted to IELTS test development personnel for comment.
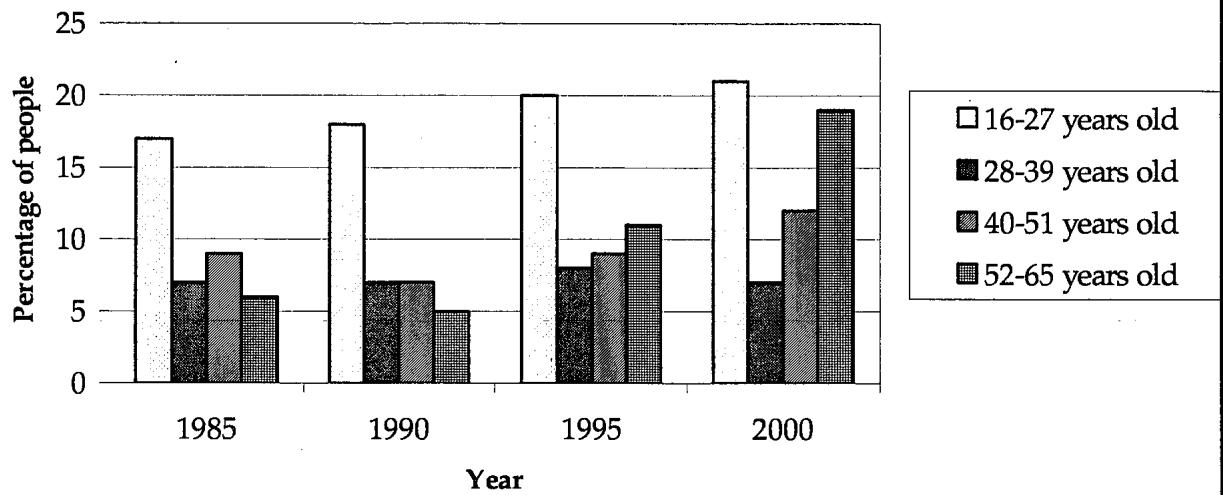
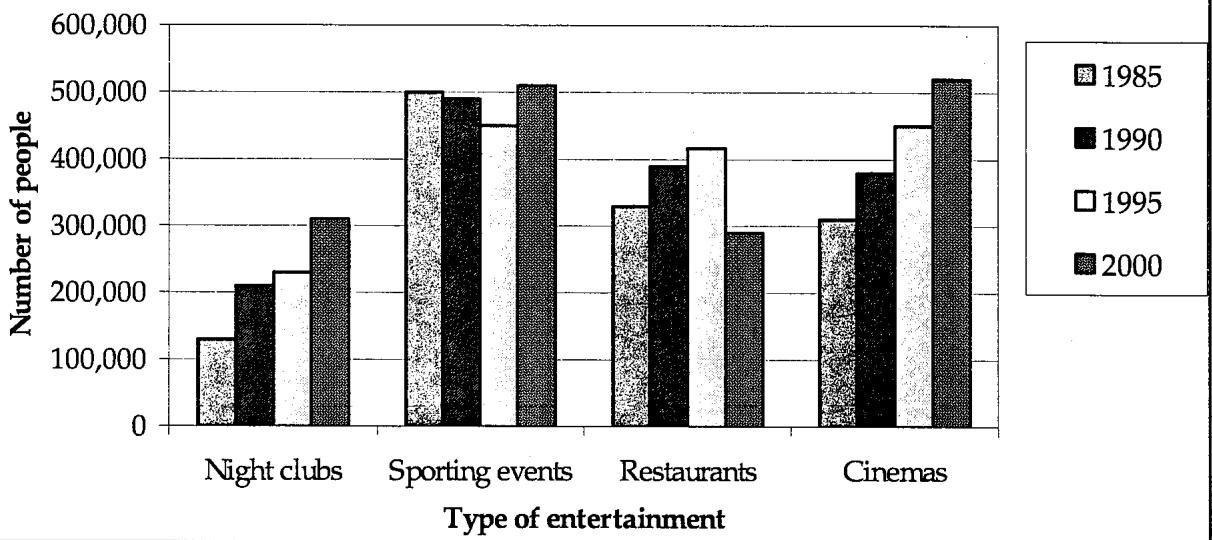
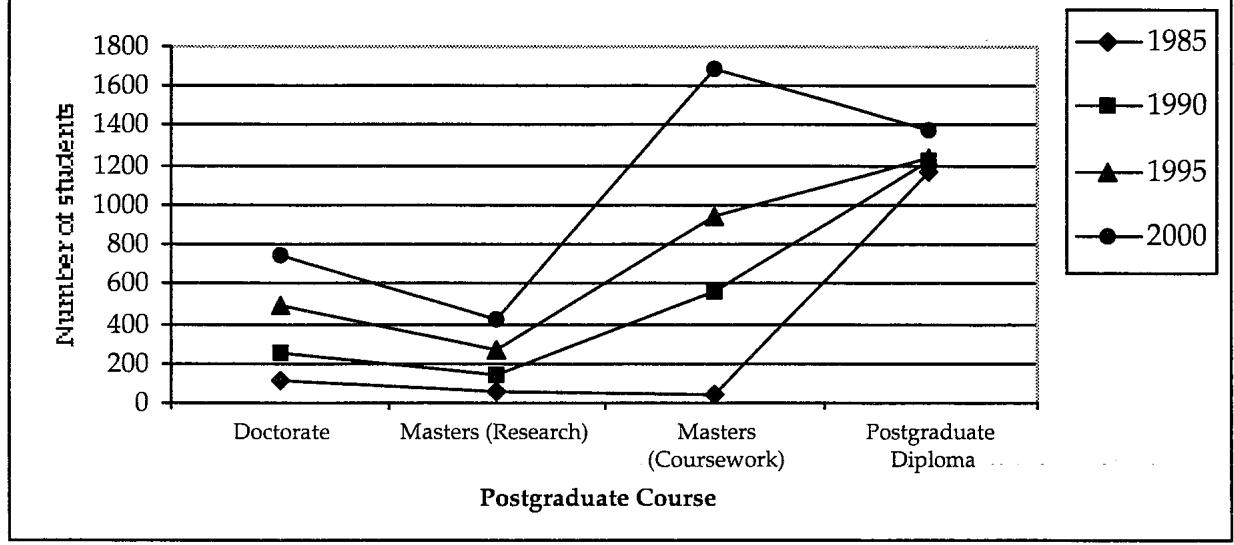
The tasks differed in terms of the amount of information the candidates were required to process to complete the task. Two of the tasks developed were less complex. This was operationalised as tasks in which the diagram or graph represented 16 pieces of information. The remaining two tasks were developed to be more complex operationalised as having 32 pieces of information. From each of these two types of task, one was designated as the control, and the other was designated as the experimental task. The control tasks are provided in Appendix 3.1.
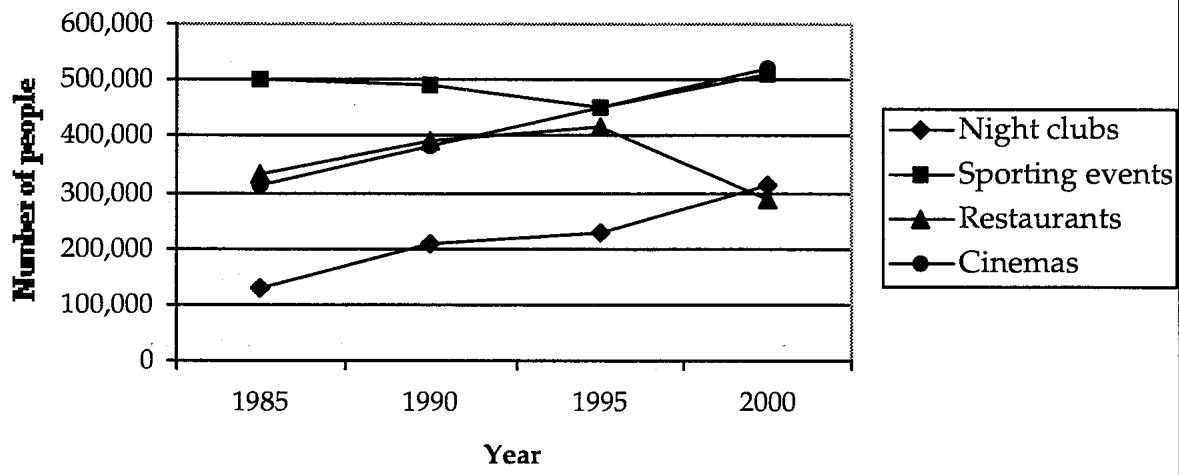
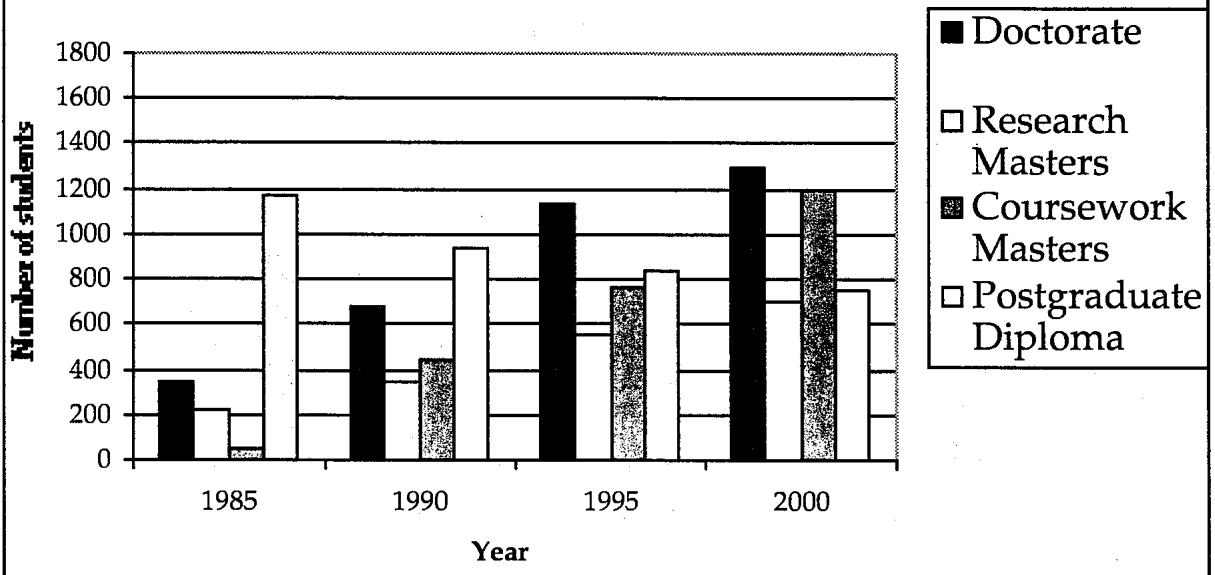
Five different versions of each of the two experimental tasks were developed. The input material was in the form of graphs or tables. The different versions varied along the following dimensions:
Bar graph/dates on x axis
Reverse bar graph/dates on y axis
Line graph/dates on x axis
Reverse line graph/dates on y axis
Table
Experimental tasks are provided in Appendix 3.2.
The control tasks were designed as benchmark tasks and administered to all candidates. The experimental tasks were administered to subgroups of the cohort (see diagram under “Phase 2: data collection” below).
Phase 2: Data Collection
Subjects
Data were collected from students enrolled in English for Academic Purposes (EAP) courses with the intention of undertaking tertiary studies in Australia. The students came from a range of language backgrounds and were enrolled in pre-university IELTS preparation classes at either La Trobe University Language Centre, The University of Melbourne English Language Centre (Hawthorn), the Centre for English Language Learning at the Royal Melbourne Institute of Technology University or English Language Services at the National Centre for English Language Teaching and Research, Macquarie University.
Two hundred and twenty students were recruited, approximately one third in New South Wales, and two thirds in Victoria. To ensure anonymity all students were assigned an identification number between 1 and 220. All data from any student who did not attempt all four tasks (e.g. disappeared during the break) was omitted from the data set. This left 210 students who attempted all tasks.
Ethics consent letters were provided to all students, and consent obtained, prior to participation. Ethics approval was provided by Macquarie University Ethics Committee.
Research Design
The two benchmark tasks, one more complex and one less complex, were administered to all students. Approximately forty students were administered one of the variable tasks from each of the manipulated experimental tasks. This is illustrated diagrammatically below.
1. Less complex
| Benchmark task (control 1) | 210 candidates |
|---|---|
| Experimental task 1/1 (Bar graph) | 41 candidates |
| Experimental task 1/2 (Reverse bar graph) | 40 candidates |
| Experimental task 1/3 (Line graph) | 43 candidates |
| Experimental task 1/4 (Reverse Line graph) | 43 candidates |
| Experimental task 1/5 (Table) | 43 candidates |
2. More complex
| Benchmark task (control 2) | 210 candidates |
|---|---|
| Experimental task 2/1 (Bar graph) | 41 candidates |
| Experimental task 2/2 (Reverse bar graph) | 42 candidates |
| Experimental task 2/3 (Line graph) | 41 candidates |
| Experimental task 2/4 (Reverse Line graph) | 42 candidates |
| Experimental task 2/5 (Table) | 44 candidates |
The research design is provided in greater detail in Appendix 3.4. The appendix shows for example,. Student 59 completed “less complex” task 1 and “more complex” task 1, while Student 51 completed “less complex” task 1 and “more complex” task 2.
Tasks were administered to candidates in two sessions of approximately one hour. Two tasks were administered per session. Candidates were allowed 20 minutes per task, with a 10 minute break before the next task was presented. Order of task presentation was randomised so that both control and experimental tasks occurred in all possible orders. Half the candidates did the more complex tasks first, while half did the less complex tasks first. Assignment of the various manipulated tasks was random to counteract practice and/or other effects of multiple task presentation (e.g. boredom, tiredness). This meant that of the candidates who took, for example, variable 1 in task 2, approximately 8 completed one of each of the variables for task 4.
Rating
All tasks were double rated by trained and qualified IELTS raters using both the global and analytic IELTS Profile Band Descriptors for Academic and General Training Writing Modules Task 1. This was because, for the purposes of this research, scalar measures, in addition to the global measures, of task difficulty were required which would be as sensitive as possible to the range of variation within any particular feature of performance. Thus both global band scores and analytic measures were obtained for each candidate from each rater.
Results
Analysis of test scores
The scores assigned by raters to the tasks were subjected to both classical analyses and multifaceted Rasch analyses (using the program FACETS).
Analysis of pre-existing group differences
In order to determine whether there were any pre-existing differences between the groups in terms of candidate ability, the scores obtained by the candidates on the control tasks were analysed by allocating the learners into groups according to the experimental task they had taken. There were no significant differences in the scores obtained by the groups on the control tasks, although it does appear that those learners assigned to the experimental task 1/1 variable were slightly more proficient than the remaining groups. Similarly, those assigned to the experimental tasks 2/2 and 2/3 may also have been slightly more proficient. These differences were not, however, significant. Table 1 below shows the mean scores across the two control tasks for candidates in each experimental group based including both the global and analytic scores.
| Global | Analytic (average) | |
|---|---|---|
| Less information | ||
| Experimental Task 1/1 | 5.260 | 5.239 |
| Experimental Task 1/2 | 4.896 | 4.884 |
| Experimental Task 1/3 | 4.965 | 4.980 |
| Experimental Task 1/4 | 4.728 | 4.760 |
| Experimental Task 1/5 | 4.643 | 4.627 |
| More information | ||
| Experimental Task 2/1 | 4.719 | 4.848 |
| Experimental Task 2/2 | 5.134 | 5.075 |
| Experimental Task 2/3 | 5.024 | 5.024 |
| Experimental Task 2/4 | 4.795 | 4.838 |
| Experimental Task 2/5 | 4.722 | 4.832 |
Table 1: comparison of experimental groups on control tasks
Analysis of experimental tasks
Comparison of the overall results on the experimental variations were obtained from several sources. Firstly, raw scores were available on the global measures, as well as each of the three analytic measures of (i) task fulfilment, (ii) cohesion and coherence, and (iii) vocabulary and grammar. In addition to this, a measure of task difficulty for each individual task was obtained from the facets analyses.
Raw score comparisons
Comparison of the overall results on the different experimental variations indicated that there were no substantial differences across the tasks, either in terms of the amount of information presented (the difference between the “Less information” and the “More information” tasks) or in terms of the differences in presentation of the tasks. Table 2 below shows the mean figures on the experimental tasks based on the global scores.
| Less information | More information | |
|---|---|---|
| Bar graph | 5.037 | 4.792 |
| Reverse bar graph | 5.026 | 4.915 |
| Line diagram | 4.904 | 4.850 |
| Reverse line diagram | 4.707 | 4.678 |
| Table | 4.986 | 4.884 |
Table 2: Comparison of global scores
Differences across groups were minimal on the global scores, and none were significant. Table 3 below shows the mean figures on the specified task based on the analytic scores.
| Less information | More information | |
|---|---|---|
| Bar graph | 5.057 | 4.863 |
| Reverse bar graph | 5.033 | 4.948 |
| Line diagram | 4.874 | 4.938 |
| Reverse line diagram | 4.800 | 4.745 |
| Table | 5.015 | 4.918 |
Table 3: Comparison of average analytic scores
Once again there were no significant differences on any of these measures.
Table 4 below shows the mean figures for the different experimental tasks in relation to the three analytic criteria (task fulfillment, coherence & cohesion, and vocabulary & sentence structure) according to task.
| Less information | More information | |
|---|---|---|
| Task fulfilment | ||
| Bar graph | 4.94 | 4.70 |
| Reverse bar graph | 4.99 | 4.94 |
| Line diagram | 4.62 | 4.88 |
| Reverse line diagram | 4.62 | 4.65 |
| Table | 5.02 | 4.68 |
| Cohesion and coherence | ||
| Bar graph | 5.10 | 4.88 |
| Reverse bar graph | 5.10 | 5.10 |
| Line diagram | 4.95 | 4.94 |
| Reverse line diagram | 4.83 | 4.81 |
| Table | 5.10 | 4.89 |
| Vocabulary and grammar | ||
| Bar graph | 5.02 | 4.77 |
| Reverse bar graph | 4.95 | 5.06 |
| Line diagram | 4.93 | 4.99 |
| Reverse line diagram | 4.89 | 4.74 |
| Table | 4.91 | 4.97 |
Table 4: Comparison of analytic scores by criteria
Once again there were no significant differences between the scores on any of the criteria, either across presentation types or amount of information.
In view of the lack of differences elicited by these tasks, two additional analyses of the raw score data were undertaken. Firstly, an examination was made of the 50 top scoring candidates and the 50 bottom scoring candidates to determine whether there were any differences in the scores on the experimental tasks within either of these groups. Secondly, candidates who had obtained three similar scores on the tasks, but who had one outlier score, were identified, and extracted from the data set in order to examine whether there were any systematic differences in the outlier scores.
High and low scoring candidates
The top 50 candidates, and the bottom 50 candidates, as determined by the scores from the FACETS output, were identified. An analysis of the raw scores for each of the variable tasks was conducted for the global score and the individual analytic criteria. The results of the high scoring candidates are given in Table 5, and those of the low scoring candidates in Table 6.
| Less information | More information | |
|---|---|---|
| Global | ||
| Bar graph | 5.93 | 5.91 |
| Reverse bar graph | 6.11 | 5.89 |
| Line diagram | 6.00 | 5.79 |
| Reverse line diagram | 5.73 | 5.64 |
| Table | 5.73 | 5.37 |
| Task fulfilment | ||
| Bar graph | 6.13 | 5.86 |
| Reverse bar graph | 6.25 | 5.75 |
| Line diagram | 5.83 | 5.89 |
| Reverse line diagram | 5.77 | 5.42 |
| Table | 5.77 | 5.38 |
| Cohesion and coherence | ||
| Bar graph | 5.87 | 6.00 |
| Reverse bar graph | 6.37 | 5.90 |
| Line diagram | 6.08 | 5.67 |
| Reverse line diagram | 5.68 | 5.50 |
| Table | 5.82 | 5.25 |
| Vocabulary and grammar | ||
| Bar graph | 6.00 | 5.86 |
| Reverse bar graph | 6.00 | 6.00 |
| Line diagram | 5.71 | 5.75 |
| Reverse line diagram | 5.73 | 5.64 |
| Table | 5.50 | 5.43 |
Table 5: High scoring candidates
Once again there are no significant differences between the performances on the different variables for the high scoring candidates.
| Less information | More information | |
|---|---|---|
| Global | ||
| Bar graph | 4.00 | 4.14 |
| Reverse bar graph | 4.23 | 4.16 |
| Line diagram | 3.84 | 3.55 |
| Reverse line diagram | 3.50 | 3.91 |
| Table | 4.15 | 4.14 |
| Task fulfilment | ||
| Bar graph | 3.90 | 4.00 |
| Reverse bar graph | 4.19 | 4.00 |
| Line diagram | 3.54 | 3.55 |
| Reverse line diagram | 3.45 | 3.83 |
| Table | 4.00 | 3.78 |
| Cohesion and coherence | ||
| Bar graph | 4.40 | 4.43 |
| Reverse bar graph | 4.37 | 4.39 |
| Line diagram | 4.00 | 3.72 |
| Reverse line diagram | 3.60 | 4.04 |
| Table | 4.20 | 4.28 |
| Vocabulary and grammar | ||
| Bar graph | 4.70 | 4.25 |
| Reverse bar graph | 4.31 | 4.22 |
| Line diagram | 4.15 | 3.78 |
| Reverse line diagram | 3.85 | 4.08 |
| Table | 4.30 | 4.36 |
Table 6: Low scoring candidates
Although the differences are not significant, it appears that the candidates found the line diagram presentations more difficult than the remaining types of presentation.
Outlier Score Analysis
The individual raw scores for each candidate on each of the four tasks they had taken were compared. Two criteria had to be met for a score to be identified as an outlier. Firstly, the score had to differ by 9 points or more from at least one of the other three scores; secondly it had to differ by at least 6 points from its nearest score. Thirty candidates had score patterns which matched these criteria. Of these, 14 had a score which was markedly higher than their other scores, and 16 had scores which were markedly lower than their other scores. There did not appear to be any systematicity in the patterning of these scores as shown in Table 7:
| High outlier | Low outlier | |
|---|---|---|
| Control task 1 | 3 | 3 |
| Bar graph, less info | 0 | 0 |
| Reverse bar, less info | 1 | 0 |
| Line graph, less info | 0 | 0 |
| Reverse line, less info | 1 | 2 |
| Table, less info | 1 | 0 |
| Control task 2 | 3 | 6 |
| Bar graph, more info | 1 | 0 |
| Reverse bar, more info | 1 | 0 |
| Line graph, more info | 0 | 2 |
| Reverse line, more info | 0 | 2 |
| Table, more info | 0 | 1 |
Table 7: Number of outlier scores by task
Task difficulty analysis
A FACETS analysis was conducted on all scores from all performances to obtain a measure of the task difficulty. FACETS uses a mean of zero to calculate task difficulty. Therefore measures above zero are higher than average difficulty, whereas measures below zero (i.e. minus scores) are lower than the average difficulty. These results indicated that there were three groups of tasks although none of the differences were very substantial. The two easiest ranked tasks were the less complex reverse bar graph, and the less complex table. In the next group were the bar graphs, both the more and less complex, and the more complex table. The final group consisted of the remaining tasks - the more complex reverse bar graph and both types of line graphs.
| Experimental Task | Difficulty Measure | Standard Error | Infit MnSq |
|---|---|---|---|
| 1/5 Table | -0.31 | 0.08 | 0.9 |
| 1/2 Reverse bar | -0.30 | 0.09 | 1.0 |
| 1/1 Bar | -0.05 | 0.09 | 0.8 |
| 2/1 Bar | -0.01 | 0.09 | 1.0 |
| 2/5 Table | -0.01 | 0.09 | 1.0 |
| 2/2 Reverse bar | 0.08 | 0.09 | 1.1 |
| 2/4 Reverse line | 0.10 | 0.09 | 0.8 |
| 1/3 Line | 0.11 | 0.09 | 0.9 |
| 1/4 Reverse line | 0.15 | 0.09 | 1.1 |
| 2/3 Line | 0.16 | 0.09 | 1.1 |
Table 8: FACETS measures of task difficulty
These figures suggest that the line diagrams are marginally more difficult than the other types of graphs used as indicated by the small score differences obtained on the raw score analysis.
In general, however, the results of these quantitative analyses reveal that the differences elicited by the different amounts of information provided in these tasks, and the different types of presentation are very small. This suggests that such differences as those provided here need not be of major concern in designing tasks for writing assessment.
Discourse Analysis
Given that there were only minimal score differences between the different variations in the task presentations, it was decided to examine the data from a different angle, and to try to determine whether there were any systematic differences in the written performances of candidates across different proficiency levels of candidates. Because of the large number of candidates who had taken both control task 1 and control task 2, it was possible to clearly identify different proficiency levels. Thus the scripts of the 20 top scoring candidates, the medium 20 scoring candidates and the bottom 20 candidates (as identified by the FACETS program in the previous stage of the study) were selected for further analysis. A detailed discourse analysis, outlined below, was conducted on the two control tasks that each of these candidates had completed. The total number of scripts examined therefore was 120.
A range of different measures related to the three analytic scoring criteria were identified. The three criteria were firstly, task fulfilment, secondly, coherence and cohesion and thirdly, vocabulary and sentence structure. The following measures were used to examine the quality of the written texts.
Task fulfilment
number of words
accuracy of information
Coherence & cohesion
coherence (structure and organisation of the body)
cohesion (conjunctive and referential)
Vocabulary & sentence structure
number of clauses
types of clauses (subordinate and non-finite)
number of T-units
number of error-free clauses and T-units
repetition of key words
The methodologies adopted for examining each of these categories is discussed below.
1.0 Task fulfilment
1.1 Word length
In carrying out the word count, a word was regarded as a series of letters with a space before and after it. Text titles (where used) were included in the count. The following were counted as one word: calendar years (eg, 1985), ages (eg, 16 years-old), times (eg, 12pm) and contractions (eg, it’s). The following were counted as two words: age range (eg, 16-27 years old), time span (eg, 6am-12am; 1895-1990) and words separated by a hyphen (eg, twenty-one). Symbols (eg, % or $) were not counted.
Table 9 below provides the mean and standard deviation figures for the three proficiency groups (high, medium and low) on the two benchmark tasks (control task 1 and control task 2).
Although the differences are fairly minimal, control task 2, on average, elicited fewer words from students at all three proficiency levels. However, standard deviations are considerably higher in the Medium and Low groups on control task 2 indicating a greater range of variability. The standard deviation on both tasks is very high for the High group, which suggests there is wide variation in terms of length of text produced by this group.
| Control Task 1 | Control Task 2 | |
|---|---|---|
| Number | Number | |
| High | ||
| Mean | 207.25 | 201.95 |
| Std Deviation | 53.49 | 54.66 |
| Medium | ||
| Mean | 155.15 | 134.35 |
| Std Deviation | 21.96 | 30.82 |
| Low | ||
| Mean | 109.15 | 107.00 |
| Std Deviation | 30.60 | 40.55 |
Table 9: Word count
The minimum word requirement for each task was 150 words. Table 10 shows the proportion of texts which met this minimum word requirement for each task.
| Control Task 1 number of texts | Control Task 1 % | Control Task 2 number of texts | Control Task 2 % | |
|---|---|---|---|---|
| High | ||||
| >150 words | 16 | 80 | 17 | 85 |
| <150 words | 4 | 20 | 3 | 15 |
| Medium | ||||
| >150 words | 12 | 60 | 6 | 30 |
| <150 words | 8 | 40 | 14 | 70 |
| Low | ||||
| >150 words | 3 | 15 | 3 | 15 |
| <150 words | 17 | 85 | 17 | 85 |
Table 10: Proportion of texts which met the minimum word limit of 150 words for each task
The results in this table suggest that the high groups meet this criterion well on both tasks. The medium group meets this criterion only on control task 1, the task in which there is less information to process. The low group does not meet this criterion on either control task 1 or 2. These findings suggest that there may be a constraint associated with the different levels of information that the candidates are required to process.
1.2 Accuracy of information
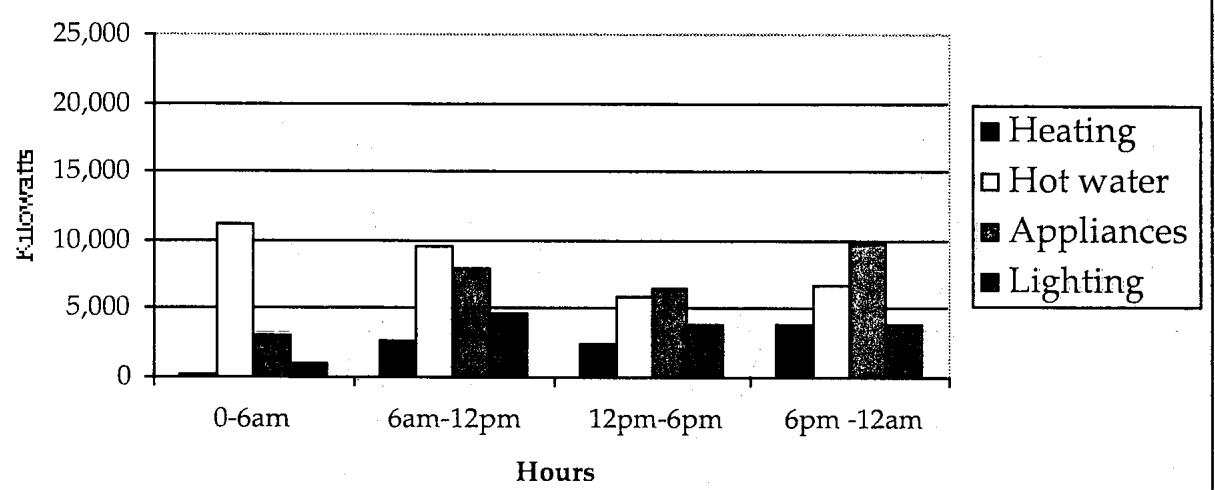
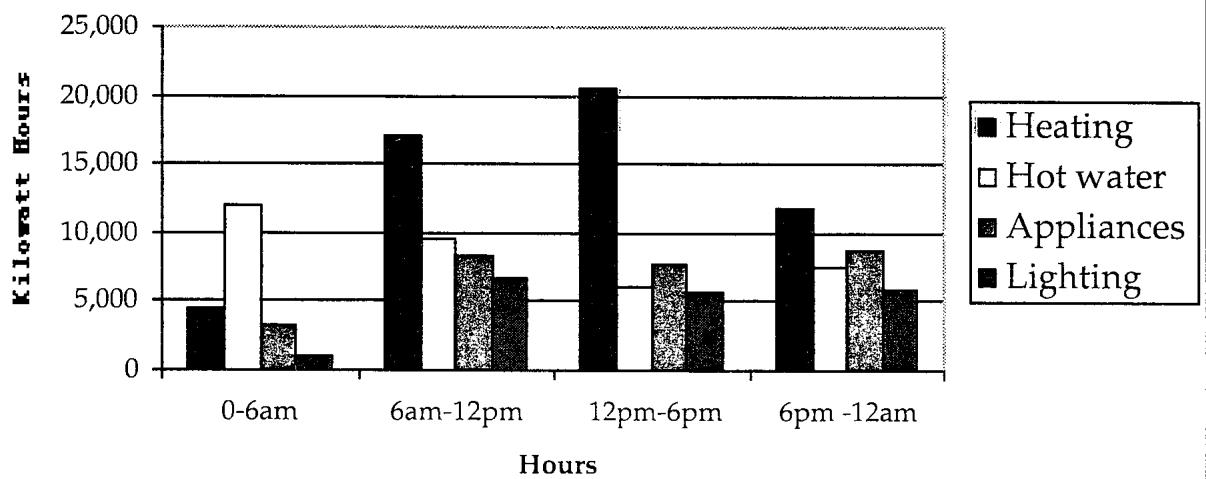
The other measure of task fulfilment adopted was the proportion of accurate information from the source material. The following method was used to make these calculations. For each task, the information that would be expected to be included in a comprehensive report was identified. Nine pieces of information were identified for control task 1 and eleven pieces for control task 2. These were:
Control task 1
| Pieces of Information | Topic Age group | Content required |
|---|---|---|
| 2 | 16-27 | highest level of unemployment in all years |
| slowly increased by about 5% over the 15 years | ||
| 1 | 28-39 | essentially stable (slight fluctuation of about 1%) |
| 2 | 40-51 | 1985-95 - drop of about 3% in 1990 |
| 1995-2000 - increase of about 5% | ||
| 2 | 52-65 | essentially stable from 1985 to 1990 (about 1% decrease) |
| sharp rise from 1990 to 2000 (rise of about 6% across 1990-5, and about 8% across 1995-2000) | ||
| 1 | Overall | 1995-2000 - greatest increase of all, with highest rates of unemployment among 16-27s and 52-65s |
| 1 | 1985-2000 - unemployment increasing, in all age groups except 28-39s |
Control Task 2
| Pieces of Information | Topic | Content required |
|---|---|---|
| 3 | Heating | highest use of heating is in winter |
| winter patterns differs from summer | ||
| times of greatest demand = 12-6pm, 6-12 am | ||
| 1 | Lighting | similar consumption patterns for summer and winter, though winter is slightly higher |
| 2 | Hot Water | similar consumption patterns for summer and winter, though winter is slightly higher |
| greatest use of electricity in summer is for hot water | ||
| 2 | Appliances | similar consumption patterns for summer and winter, though winter is slightly higher |
| 6-12pm = time when usage is greatest | ||
| 3 | Overall | more electricity is used in winter than in summer |
| usage of electricity varies with time of day | ||
| the greatest demand for electricity is for heating |
Each text was scrutinised and the proportion of the required information included in each text was calculated. There were several issues that influenced decisions about what information should be expected to occur in the responses to each of the tasks. First, for both tasks, but especially control task 2, there were a variety of possible ways of presenting the information contained in the graphs, and the basis of organisation influenced what could be expected to be mentioned. This is related to a second issue, that of the interpretation, or understanding of what the tasks required writers to do. Writing a report could be considered to involve synthesising the information presented in the graphs, not merely listing information already available to the reader from the graph. This leads to a third issue, of what is actually meant by ‘factual information’. These issues can be illustrated by considering the following constructed sentences, based on one of the tasks:
The level of unemployment for 28-39 year-olds goes from 7% in 1985 to 8% in 1990 and back to 7% in 1995.
The level of unemployment amongst 28-39 year-olds is stable from 1985-1995.
Both of these sentences are correct in relation to the graph in control task 1, although the first might be considered more ‘factual’ in that it gives percentages from the graph. The second statement does not give figures from the graph, is less specific, but reflects a higher degree of synthesis of information provided in the graph. For this analysis, both these types of sentences were considered to ‘contain accurate, factual information from the source material’.
For each script the amount of correct information was calculated and then converted to a percentage of the total number of pieces of information. Table 11 below shows the mean and standard deviation for these percentage figures.
| Control task 1 | Control task 2 | |
|---|---|---|
| High | ||
| Mean | 68.75 | 62.00 |
| Std Deviation | 12.13 | 14.27 |
| Medium | ||
| Mean | 61.75 | 53.25 |
| Std Deviation | 12.70 | 19.82 |
| Low | ||
| Mean | 44.75 | 31.50 |
| Std Deviation | 19.50 | 16.55 |
Table 11: proportion of accurate information (%)
All three proficiency groups performed better on control task 1 using this measure. This is probably partly the result of the fact that there was less information to be incorporated into the responses on control task 1 than control task 2 (i.e. nine as opposed to eleven pieces of information) which means that the task is less onerous. However, it is interesting to note that the differences between the performances on control task 1 and control task 2 become greater with decreasing proficiency, suggesting once more that the lower proficiency groups may be finding the “more information” task more challenging.
2.0 Coherence and cohesion
For the purposes of carrying out the following analyses, the overlapping concepts of ‘coherence’ and ‘cohesion’ were considered separately.
2.1 Coherence
Coherence refers to the relationships which link the meanings of sentences in a written text.
2.1.1 Text structure
Texts were coded into one of five categories according to which of the three main structural elements i.e. Introduction, Body and Conclusion, were included in the text:
| Code | Text structure |
|---|---|
| 5 | Introduction, Body and Conclusion |
| 4 | Introduction and Body only (no Conclusion) |
| 3 | Body and Conclusion only (no Introduction) |
| 2 | Body only |
| 1 | Nil |
Introduction
A text was considered to include an Introduction if it opened with a clear orienting statement as to what the text was about, and, in some cases, how it would be organised. The Introduction sometimes took the form of a metatextual statement. Some introductions were an exact or close repetition of the prompt; others provided an indication of the main theme of the report as well. For example:
I will discuss the different uses for electricity at different times of the day in kilowatt hours during winter and summer in this paper. [2/210] 1
The two graphs show the different uses for electricity at four different times a day in winter and summer. The demands for electricity in winter is higher than in summer. [2/43]
Conclusion
A text was coded as having a Conclusion if it had a final paragraph or even a sentence which provided a summary of the main idea(s) of the text, usually introduced by an overt marker of conclusion, such as In conclusion, In short, or To sum up. For example:
In short, it seems that more electricity is used winter than in summer. [2/21]
In conclusion, in winter heating during 12pm-6pm has the highest kilowatt hours. In summer, hot water is the major use for electricity. The resemblance between winter and summer is the use of appliances. [2/114]
Through the graph, I think that the demands for electricity for heating is the most obvious difference between winter and summer. [2/210]
Body
Where texts had an Introduction and/or Conclusion, the remainder of the text was considered to be the Body. Texts without an Introduction or Conclusion were coded as having a Body only.
Nil
Any text where the student had not attempted the task was coded as Nil.
Table 12 below shows the results of the text structure analysis
| Control Task 1 total scripts | Control Task 1 % of scripts | Control Task 2 total scripts | Control Task 2 % of scripts | |
|---|---|---|---|---|
| Intro/body/conclusion | ||||
| High | 16 | 80 | 9 | 45 |
| Medium | 10 | 50 | 6 | 30 |
| Low | 1 | 5 | ||
| Intro/body | ||||
| High | 4 | 20 | 9 | 45 |
| Medium | 7 | 35 | 11 | 55 |
| Low | 6 | 30 | 9 | 45 |
| Body/conclusion | ||||
| High | 0 | 0 | ||
| Medium | 0 | 0 | ||
| Low | 1 | 5 | 1 | 5 |
| Body only | ||||
| High | 0 | 2 | 10 | |
| Medium | 3 | 15 | 3 | 15 |
| Low | 12 | 60 | 9 | 45 |
| Nil | ||||
| High | 0 | 0 | ||
| Medium | 0 | 0 | ||
| Low | 0 | 1 | 5 |
Table 12: Analysis of text structure
On average, the scripts of all three proficiency groups were less complete in terms of structure on control task 2 than on control task 1. The high group also outperform the other groups on this measure, where overall, the number of elements incorporated into the texts reduces by proficiency level.
2.1.2 Organisation within the body of the texts
A further measure of coherence was whether or not there was a clear, logical principle of organisation evident in the way the information in the body of the text was presented. Texts were coded as either having, or not having a clear principle of organisation, of information in the Body of the text:
2 Yes, there was a clear basis of organisation evident
1 No, the basis of organisation was not evident
There were a number of different principles of organisation used by the participants. Some used a set of sequential organisers (e.g., firstly, secondly, thirdly to introduce successive sections). Others used sets of organisers, based on an aspect of topic. For example, for control task 1, common patterns of topical organisation were age groups (people aged 16-27 years…/ people aged 28-39 years…), or calendar year (in 1985…/ in 1990…). For control task 2, seasons (in winter/in summer), time of day (between 0 and 6am…), or when the greatest demand for different categories of electricity usage occurred were common patterns of organisation. Contrastive organisers (on the one hand/on the other hand; however) were also employed by a few writers, usually in addition to one of the other sets of organisers. Table 13 below shows the results of this analysis.
| Control Task 1 total scripts | Control Task 1 % scripts | Control Task 2 total scripts | Control Task 2 % scripts | |
|---|---|---|---|---|
| High | ||||
| Evident | 16 | 80 | 14 | 70 |
| Not Evident | 4 | 20 | 6 | 30 |
| Medium | ||||
| Evident | 12 | 60 | 11 | 55 |
| Not Evident | 8 | 40 | 9 | 45 |
| Low | ||||
| Evident | 5 | 25 | 9 | 45 |
| Not Evident | 15 | 75 | 11 | 55 |
Table 13: organisation of the body of the texts
The results of this measure are interesting. The high proficiency group perform considerably better on control task 1 than on control task 2. The medium proficiency group perform similarly on both tasks, while the low proficiency group perform better on control task 2.
2.2 Cohesion
Cohesion refers to the formal (i.e. grammatical and/or lexical) relationships between the different elements of a text.
2.2.1 Conjunctive cohesion
Halliday and Hasan (1976) identify four conjunctive categories. These additive, adversative, causal and temporal. Each category was counted to provide an indication of the range of conjunctive use.
Additive
The most common additive conjunctions in these data were: and, also, for example, in addition, and similarly.
Examples:
They occupy the big portion and increase in number steadily. Also percentage of 52-65 year old unemployed people was low in 1985. [1/131]
In 1985, only of them didn’t have a job. And it decreased a bit in 1990. [1/161]
Adversative
The most common adversative conjunctions in these data were: but, however, in fact, in contrast, on the one hand/on the other hand, on the contrary.
Examples:
With the advance technology and science, people now lead a much better life than ever before. On the other hand, much automation cause more unemployed people in the world. [1/114]
And it decreased a bit in 1990. However, since then, it rose rapidly to 18%… [1/161]
Causal
The most common causal conjunctions in these data were: as a result, so, therefore. Examples:
In fact, modern’s social is very difficult for get a good job. So many young people stay home after university. [1/35]
I think that this generation is including high school and university students. Therefore, the percentage of unemployed people is relatively low. [1/210]
Temporal
The most common temporal conjunctions in these data were: first(ly), second(ly), third(ly), finally, in conclusion, meanwhile, next, then to sum up. Examples:
Firstly, I will consider the percentage of unemployed people… Secondly the percentage of unemployed people … is low constantly. [1/210]
The number of unemployed people at the age of sixteen to twenty seven rose in 1990 with the percentage of eighteen percent. Meanwhile, the rate of unemployed people from… stayed the same as in 1985… [1/21]
The total number of inter-sentential (here inter-T-unit) conjunctions was counted. In Table 14 below the results are expressed as a percentage of the total T-units used by the three proficiency groups (high, medium and low) on each of the tasks (control tasks 1 and 2). The use of conjunctions is fairly similar within each task for the proficiency groups, but while the high and medium groups use more in control task 1, the low group uses marginally more in control task 2.
| Control Task 1 total T-units | Control Task 1 conjunctions | Control Task 1 % | Control Task 2 total T-units | Control Task 2 conjunctions | Control Task 2 % | |
|---|---|---|---|---|---|---|
| High | 227 | 77 | 33.92 | 212 | 55 | 25.94 |
| Medium | 202 | 68 | 33.66 | 181 | 45 | 24.86 |
| Low | 183 | 51 | 27.87 | 145 | 43 | 29.66 |
Table 14: Total use of conjunctions
Tables 15 and 16 below show the breakdown by percentage of total T units for the four types of conjunction used in control task 1 and control task 2 respectively.
| Additive | Adversative | Casual | Temporal | |
|---|---|---|---|---|
| High | 10.13 | 8.81 | 1.32 | 13.66 |
| Medium | 8.42 | 12.87 | 0.00 | 12.38 |
| Low | 9.29 | 9.84 | 4.92 | 3.83 |
Table 15: Use of conjunctions by type, Control task 1
| Additive | Adversative | Casual | Temporal | |
|---|---|---|---|---|
| High | 7.55 | 8.49 | 1.89 | 8.02 |
| Medium | 5.52 | 12.15 | 1.66 | 5.52 |
| Low | 9.66 | 11.03 | 4.14 | 4.83 |
Table 16: Use of conjunctions by type, Control task 2
Causal links are used very little by any of the proficiency groups in either task. Temporal links are used most by the medium and high proficiency groups in control task 1, and most by the high group in control task 2. Additive and adversative conjunctions are used most by all proficiency levels on both tasks.
2.2.2 Referential cohesion
The total number of inter-sentential (here inter-T-unit) reference connections was counted (pronominal, demonstrative, definite article and comparative). Some of the examples below are drawn from the scripts and others from Halliday and Hasan (1976).
Pronominal
The distinctive feature is 16-27 year old people. They occupy the big portion and increase in number steadily. [1/131]
Demonstrative
From 1985 to 2000 the people who are the most touch by unemployment are the 16-27 years old. In the case a slise increase in unemployment appears between those years as an irregular rate. [1/103]
Definite article
Last year we went to Devon for a holiday. The holiday we had there was the best we’ve ever had. [Halliday and Hasan, 1976, p.73]
Comparative
The little dog barked as noisily as the big one. [Halliday and Hasan, 1976, p.82] The calculations did not include the following uses of the definite article: generic, unique reference, definite noun phrase with specifying modifier, because such uses are not anaphoric. The actual number of references used in many of the texts is greater than the figures shown, but those references could not be included because they were intra-sentential, rather than inter-sentential. Table 17 below shows the results for the use of referential cohesion expressed as percentages of the total relevant number of T-units.
| Control Task 1 total references | Control Task 1 % T-units | Control Task 2 total references | Control Task 2 % T-units | |
|---|---|---|---|---|
| High | 103 | 45.37 | 61 | 28.77 |
| Medium | 42 | 20.79 | 33 | 18.23 |
| Low | 43 | 23.50 | 36 | 24.83 |
Table 17: Total use of reference
The high proficiency group exhibit much greater control of referential cohesion than the medium and low groups, particularly on control task 1. This difference is not reflected across tasks by the lower proficiency levels.
3. Vocabulary & sentence structure
3.1 Clause count
In undertaking this calculation a clause was defined as consisting of an overt subject and a finite verb (c.f. Polio 1997). Therefore:
Table 18 below provides means and standard deviations based on number of clauses in the scripts.
| Control Task 1 mean | Control Task 1 SD | Control Task 2 mean | Control Task 2 SD | |
|---|---|---|---|---|
| High | 14.90 | 6.38 | 15.30 | 4.75 |
| Medium | 13.15 | 3.28 | 11.00 | 3.03 |
| Low | 10.80 | 4.30 | 8.80 | 6.00 |
Table 18: clause count
As expected, the high group produce more clauses than the other two groups, with very similar numbers on both tasks. The medium and low groups tend to produce more clauses on control task 1.
3.2 Clause Types
Both dependent and non-finite clauses were coded and counted.
3.2.1 Dependent (or subordinate) clauses
Following Wolfe-Quintero, Inagaki and Kim (1998) no distinction was made between dependent and embedded clauses, meaning that adverbial, nominal and relative clauses were all coded as dependent (subordinate) clauses. For example:
Adverbial clauses
We use a lot of electricity for heating in winter because it is very cold in winter. Especially while we are working during the day from six am to six pm, the demand for electricity for heating is big… [7/210]
In these texts, adverbial clauses were most commonly, though not exclusively, introduced by because, while, and when.
Nominal
Through this graph, I think that the demands for electricity for heating is the most obvious difference between summer and winter. [7/210]
Relative
The percentage of people who are 16-27 years old. [1/114]
3.2.2 Non-finite
Non finite clauses were also coded.
For example:
The chart illustrates the number of unemployers grouped in age living in London between 1985 and 2000. [1/91]
In Table 19 below the number of subordinate clauses used in the texts are expressed as a percentage of total clauses. Table 19 then shows the proportion of total clauses containing a non-finite clause:
| Control Task 1 total clauses | Control Task 1 subordinate clauses | Control Task 1 % | Control Task 2 total clauses | Control Task 2 subordinate clauses | Control Task 2 % | |
|---|---|---|---|---|---|---|
| High | 308 | 77 | 25.00 | 306 | 65 | 21.24 |
| Medium | 263 | 35 | 13.31 | 220 | 35 | 15.91 |
| Low | 216 | 40 | 18.52 | 175 | 21 | 12.00 |
Table 19: Use of subordinate clauses
| Control Task 1 total clauses | Control Task 1 subordinate clauses | Control Task 1 % | Control Task 2 total clauses | Control Task 2 subordinate clauses | Control Task 2 % | |
|---|---|---|---|---|---|---|
| High | 308 | 9 | 3.92 | 306 | 4 | 1.31 |
| Medium | 263 | 0 | 0.00 | 220 | 0 | 0.00 |
| Low | 216 | 3 | 1.39 | 175 | 0 | 0.00 |
Table 20: use of non-finite clauses
In Table 18 patterns of use across the two task types are very similar for the high and medium group, with the low group using rather more subordinators in control task 1. The use of non-finite clauses, as shown in Table 20, was too restricted for a clear pattern to emerge.
3.3 T-unit count
A T-unit consists of one independent clause and any dependent clauses or sentence fragments attached to it.
For example:
Firstly, I will consider the demands for electricity for heating. [2/210]
= 1 T-unit, consisting of 1 clause (one independent, or main, clause).
We use a lot of electricity for heating in winter because it is very cold in winter. [2/210]
= 1 T-unit, consisting of 2 clauses (one independent, or main, and one dependent, or subordinate)
The graph shows that during the 0-6am, the number of kilowatt hours increases more than 10000, and reduces to 5000 during 12pm-6pm. [2/114]
= 1 T-unit, consisting of 2 clauses (one independent, or main, and one dependent, or subordinate)
Table 21 below shows the mean and standard deviation figures based on the counting of T-units in the scripts.
| Control Task 1 mean | Control Task 1 SD | Control Task 2 mean | Control Task 2 SD | |
|---|---|---|---|---|
| High | 11.35 | 4.67 | 11.80 | 3.15 |
| Medium | 10.10 | 2.15 | 9.05 | 3.32 |
| Low | 8.65 | 3.48 | 7.25 | 4.71 |
Table 21: T-unit count
This table indicates that the number of T-units used by all proficiency groups is similar across both tasks.
3.4. Error-Free Units
The number of error-free clauses and T-units in all of the texts were then calculated to obtain a measure of grammatical accuracy.
3.4.1. Error-free Clauses (EFC):
The number of clauses without errors, expressed as a proportion of total clauses. Any error excluded a clause from being classified as error-free.
3.4.2. Error-free T-units (EFT):
The number of T-units without errors, expressed as a proportion of total clauses. Any error excluded a T-unit from being classified as error-free. It is possible, and indeed common for some clauses in T-units to be error-free, but due to an error in one clause, the T-unit cannot be coded as error-free.
The focus of EFC/EFT analysis was primarily linguistic accuracy, but decisions about accuracy or correctness (e.g., lexical choice) cannot be divorced completely from context of use, that is, what is appropriate or correct in the context, and therefore the coding indirectly incorporates aspects of discourse level competence.
In carrying out this analysis fundamental decisions had to made about what would be counted as an error. For this study verb, article and lexical/ phrasal errors were included.
These are explained below:
- subject-verb agreement: use of a singular verb with a plural subject, or vice versa.
- other verb: this included incorrect participle form, incorrect tense, incorrect form of an auxiliary or modal verb.
- Article: omission of an article, or inclusion of an article when not required, as well as incorrect or inappropriate article (eg, these instead of this)
- lexical/phrasal: this category included:
- inappropriate or infelicitous choice of words or expressions (this category reflects the use of a word or expression which conveys the idea the writer appears to be seeking to communicate, ie, it makes sense in context, but is not what a NS would use (eg, no job people instead of the unemployed)
- incorrect words or phrases (eg, come instead of go) incorrect forms of idioms or fixed expressions (eg, In the other hand instead of On the other hand)
- preposition errors
- word order errors, ie, where all the correct words were present, but were not in the correct order
Tables 22 and 23 provide the figures on error-free clauses and T-units respectively.
| Control Task 1 total clauses | Control Task 1 error-free clauses | Control Task 1 % | Control Task 2 total clauses | Control Task 2 error-free clauses | Control Task 2 % | |
|---|---|---|---|---|---|---|
| High | 308 | 99 | 32.14 | 306 | 129 | 42.16 |
| Medium | 263 | 68 | 25.86 | 220 | 33 | 15.00 |
| Low | 216 | 39 | 18.06 | 175 | 29 | 16.57 |
Table 22: Error-free clauses
As would be expected, the results indicate that, overall, the high proficiency group had a higher percentage of error-free clauses than the other two groups. In addition, this group performed better on control task 2 than control task 1, whereas the reverse was true for the medium and lower groups.
| Control Task 1 total clauses | Control Task 1 error-free clauses | Control Task 1 % | Control Task 2 total clauses | Control Task 2 error-free clauses | Control Task 2 % | |
|---|---|---|---|---|---|---|
| High | 227 | 57 | 25.11 | 212 | 83 | 39.15 |
| Medium | 202 | 36 | 17.82 | 181 | 14 | 7.74 |
| Low | 183 | 15 | 8.20 | 145 | 16 | 11.04 |
Table 23: Error-free T-units
Similarly to the previous table, the high proficiency group have a greater percentage of error free clauses in control task two, and outperform the other groups on both tasks. Although the medium group have a greater percentage of error-free clauses in control task 1, for the low group, there are marginally more error-free clauses in control task two, but this difference is minimal.
3.5 Repetition of key words
This measure is adapted from the work of Lawe Davies (1998), who found that exact lexical repetition of key words from the prompt distinguished high from low rated texts.
Key words from the prompt were identified for each task (see appendices 1 and 2) as shown below:
Key words from the task prompts
| Control task 1 | Control task 2 |
|---|---|
| graph | graphs |
| percentage | differing |
| unemployed people | different |
| age | demands |
| London | uses |
| 1985 | electricity |
| 1990 | kilowatt hours |
| 1995 | winter |
| 2000 | summer |
| 16-27 years old 2 | 0-6 am |
| 28-39 years old* | 6am-12pm |
| 40-51 years old* | 12pm-6pm |
| 52-65 years old* | 6pm-12am |
| heating | |
| hot water | |
| appliances | |
| lighting | |
| time(s) of day |
Each text was then coded on the basis of whether all of the key words were used at least once in the text, or whether only some of them were repeated. For this analysis, a binary coding was used:
1 key words incomplete 2 key words complete
Table 24 below shows the results of this analysis including the percentages of texts in which use of key words was complete and incomplete in relation to the different proficiency groups and tasks.
| Control Task 1 complete N | Control Task 1 complete % | Control Task 1 incomplete N | Control Task 1 incomplete % | Control Task 2 complete N | Control Task 2 complete % | Control Task 2 incomplete N | Control Task 2 incomplete % | |
|---|---|---|---|---|---|---|---|---|
| High | 15 | 75 | 5 | 25 | 11 | 55 | 9 | 45 |
| Medium | 15 | 75 | 5 | 25 | 8 | 40 | 12 | 60 |
| Low | 2 | 10 | 18 | 90 | 0 | 0 | 20 | 100 |
Table 24: Use of key word repetition
On this final measure all three proficiency groups performed better on control task 2. This is probably because there are more keywords in this task, and therefore greater opportunity to do so.
Conclusion
The test score analyses showed no differences in task difficulty in terms the amount or presentation of information to the candidate. The fact that no significant differences were found in the scores given by the raters on the tasks may be considered to be a positive finding. This means that the types of variations in presentation incorporated into these tasks can be shown not to influence candidate outcome. This means that a variety of presentation types can be encouraged and manipulated.
On the other hand, the discourse analyses revealed some interesting differences between the two control tasks which differed in terms of the amount of information presented to candidates. The responses from all three proficiency groups to control task 1 showed greater complexity overall on most of the relevant measures (structure, organisation, cohesion, subordination and repetition of key words). The trend was less clear overall in relation to the categories for accuracy (error-free clauses and T-units). Here there was greater variability in relation to both the tasks and proficiency levels of the candidates. However, it is worth noting that the high proficiency group showed greater accuracy in response to control task 2 on most measures of accuracy.
It appears, therefore, that tasks providing less information actually elicit more complex language. Since the goal of these tasks is to produce as high a performance from the candidate as possible it can be concluded that this is best achieved through using simpler tasks.
In line with Polio and Glew (1996) the results on the complexity measures in particular also suggest that the raters may have compensated for perceiving the tasks with more information to be more difficult since the differences in the quality of the responses on the two control tasks from the discourse analytic perspective were not reflected in the test scores. This underscores the importance of combining test score and discourse analyses in investigations of task difficulty in language testing.
Bibliography
Carlson, S, Bridgeman, B, Camp, R. & J. Waanders. 1985. Relationship of admission test scores to writing performance of native and non native speakers of English. TOEFL Research Report No. 19. Princeton NJ: Educational Testing Service.
Foster, P. 1996. Doing the task better: how planning time influences students’ performance. In Willis, J. & D. Willis (eds) Challenge and change in language teaching. London: Heinemann.
Foster, P. & Skehan, P. 1996. The influence of planning and task type on second language performances. Studies in Second Language Acquisition, 18: 299-323.
Foster, Tonkyn & Wigglesworth. 2001. Measuring spoken language: a unit for all reasons. Applied Linguistics, 21,3: 354-375.
Halliday, M. A., K., and Hasan, R. (1976). Cohesion in English. London: Longman.
Hamp-Lyons, L. 1990. Second language writing: assessment issues. In B. Kroll (ed) Second language writing: Research insights for the classroom. Cambridge: Cambridge University Press.
Hamp-Lyons, L. & B. Kroll, 1996. Issues in ESL writing assessment: an overview. College ESL, 6, 1: 52-72.
IELTS (2000) IELTS handbook. Cambridge: UCLES.
Koyabashi, H. & C. Rinnert, 1992. Effects of first language on second language writing: translation versus direct-composition. Modern Language Journal, 42: 183-215.
Kroll, B. 1990. What does time buy? ESL student performance on home versus class compositions. In B. Kroll (ed) Second language writing: Research insights for the classroom. Cambridge: Cambridge University Press.
Kroll, B. 1998. Assessing writing abilities. Annual Review of Applied Linguistics. 18: 219-240.
Lawe Davies, R. (1998). Coherence in tertiary students writing. Unpublished PhD thesis, University of Western Australia, Perth, Western Australia.
Mehnert, U. 1998. The effects of different lengths of time for planning on second language performance. Studies in Second Language Acquisition 20, 1: 83-108.
Ortega, L. 1999. Planning and focus on form in L2 oral performance. Studies in Second Language Acquisition 21: 109-148.
Polio, C. 1997. Measures of linguistic accuracy in second language writing research. Language Learning. 47,1: 101-143.
Polio, C. & M. Glew 1996. ESL writing assessment prompts: how students choose. Journal of Second Language Learning, 5 (1): 35-49.
Skehan, P. & P. Foster 1997. Task type and task processing conditions as influences on foreign language performance. Language Teaching Research. 13: 185-211.
Skehan, P. 1998. A cognitive approach to language learning. Oxford: Oxford University Press.
Wigglesworth, G. 1997. An investigation of planning time and proficiency level on oral test discourse. Language Testing, 14.1:101-122.
Wigglesworth G. 1999. Rating accuracy and complexity in written scripts. Paper presented at the Japanese Association of Language Teaching conference, Tokyo, October 8-10.
Wigglesworth, G. 2001. Influences on performance in task-based oral assessments. In Bygate, M., Skehan, P. & M. Swain: Task based learning. London: Addison Wesley Longman. pp. 186-209.
Wolfe-Quintero, K., Inagaki, S., and Kim, H-Y. (1998). Second language development in writing: Measures of fluency, accuracy and complexity. Technical Report #17, Second Language Teaching and Curriculum Center, University of Hawaii at Manao. Honolulu, HI: University of Hawaii Press.
Appendix 3.1 Control Tasks
Control Task 1 (less complex)
You should spend about 20 minutes on this task.
The graph below shows the percentages of unemployed people by age living in London between 1985 and 2000.
Write a report for a university lecturer describing the information shown below.
You should write at least 150 words.
Percentage of unemployed people by age living in London between 1985 and 2000
Control task 2 (more complex)
You should spend about 20 minutes on this task.
The graphs below show the differing demand for electricity in winter and summer according to time of day.
Write a report for a university lecturer describing the information shown below.
You should write at least 150 words.
The different uses for electricity at different times of day in kilowatt hours during summer
The different uses for electricity at different times of day in kilowatt hours during winter
Appendix 3.2 Experimental Tasks
Bar graph (ET1/1) Experimental task 1 (less complex)
You should spend about 20 minutes on this task.
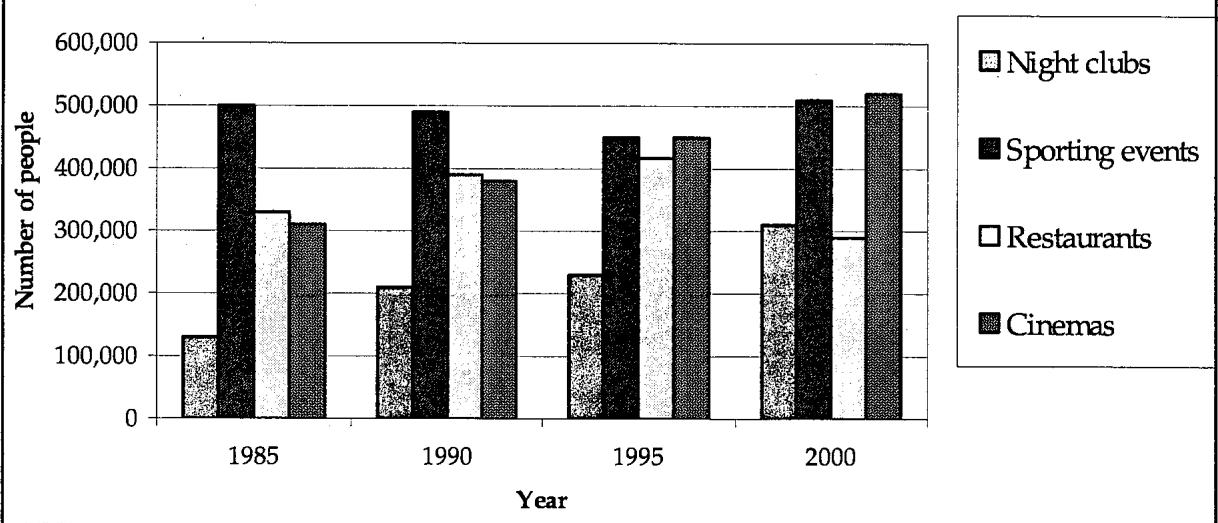
The graph below shows the number of people attending places of entertainment in Melbourne, Australia, between 1985 and 2000.
Write a report for a university lecturer describing the information shown below.
You should write at least 150 words.
Number of people attending places of entertainment in Melbourne between 1985 and 2000
Reverse bar graph (ET1/2) Experimental task 2 (less complex)
You should spend about 20 minutes on this task.
The graph below shows the number of people attending places of entertainment in Melbourne, Australia, between 1985 and 2000.
Write a report for a university lecturer describing the information shown below.
You should write at least 150 words.
Number of people attending places of entertainment in Melbourne between 1985 and 2000
Line graph (ET1/3) Experimental task 3 (less complex)
You should spend about 20 minutes on this task.
The graph below shows the number of people attending places of entertainment in Melbourne, Australia, between 1985 and 2000.
Write a report for a university lecturer describing the information shown below.
You should write at least 150 words.
Number of people attending places of entertainment in Melbourne between 1985 and 2000
Reverse line graph (ET1/4) Experimental task 4 (less complex)
You should spend about 20 minutes on this task.
The graph below shows the number of people attending places of entertainment in Melbourne, Australia, between 1985 and 2000.
Write a report for a university lecturer describing the information shown below.
You should write at least 150 words.
Number of people attending places of entertainment in Melbourne between 1985 and 2000
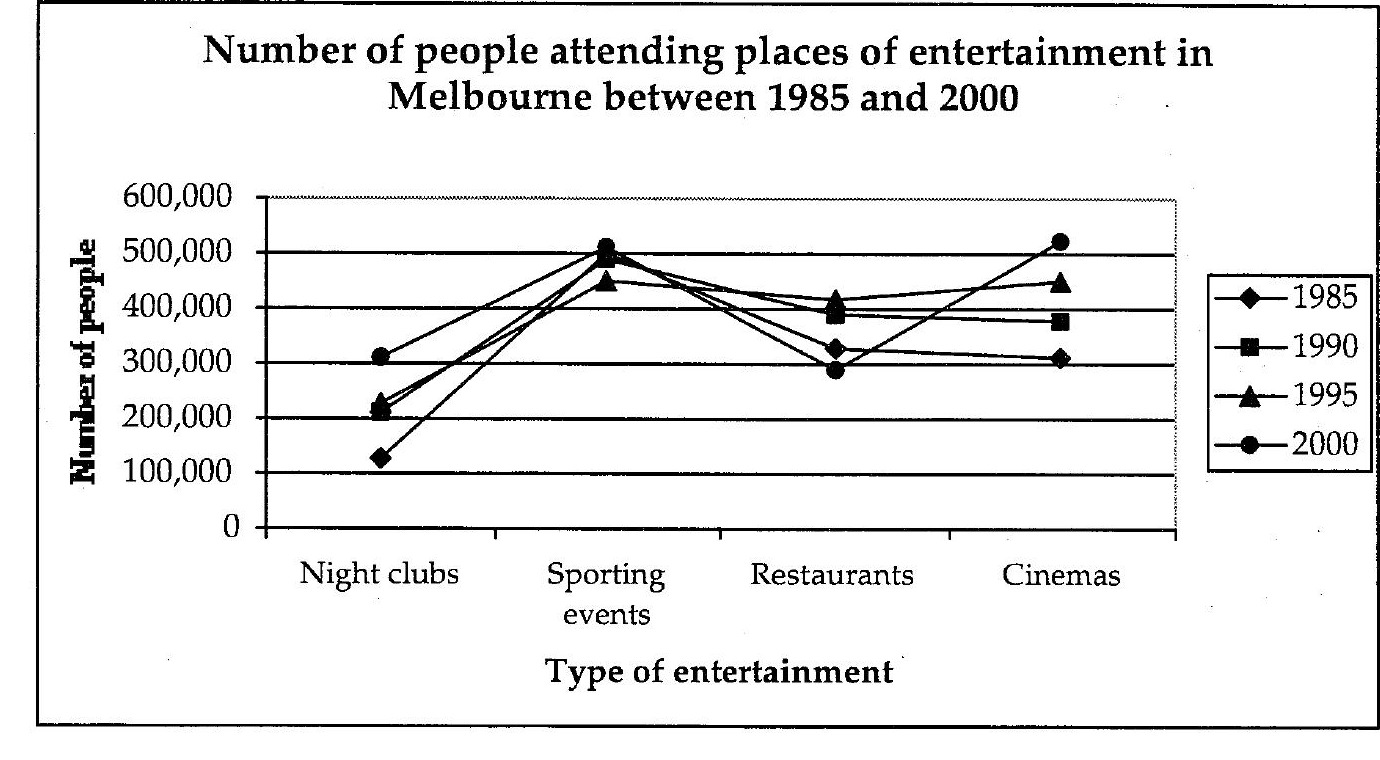
Table (ET1/5) Experimental task 5 (less complex)
You should spend about 20 minutes on this task.
The graph below shows the number of people attending places of entertainment in Melbourne, Australia, between 1985 and 2000.
Write a report for a university lecturer describing the information shown below.
You should write at least 150 words.
Number of people attending places of entertainment in Melbourne between 1985 and 2000
| 1985 | 1990 | 1995 | 2000 | |
|---|---|---|---|---|
| Night clubs | 130,000 | 210,000 | 240,000 | 320,000 |
| Sporting events | 500,000 | 490,000 | 450,000 | 510,000 |
| Restaurants | 340,000 | 390,000 | 435,000 | 290,000 |
| Cinemas | 310,000 | 370,000 | 450,000 | 530,000 |
Bar Graph (ET2/1) Experimental task 1 (more complex)
You should spend about 20 minutes on this task.
The graphs below show the numbers of women and men studying postgraduate courses in an Australian university between 1985 and 2000.
Write a report for a university lecturer describing the information shown below.
You should write at least 150 words
Women in postgraduate study 1985-2000
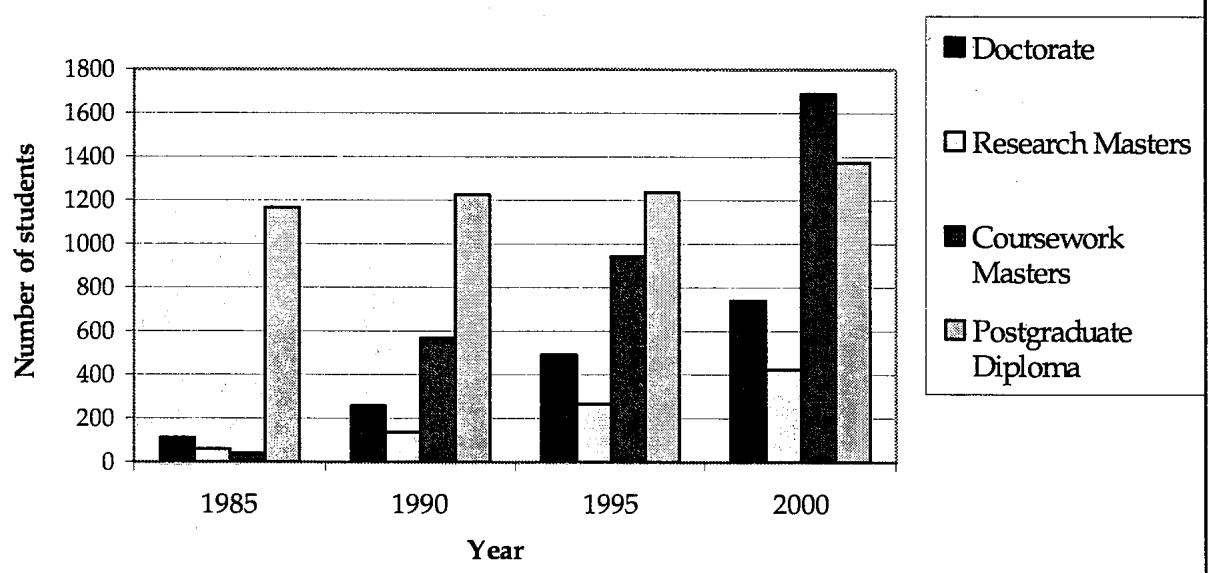
Men in postgraduate study 1985-2000
Reverse Bar Graph (ET2/2) Experimental task 2 (more complex)
You should spend about 20 minutes on this task.
The graphs below show the numbers of women and men studying postgraduate courses in an Australian university between 1985 and 2000.
Write a report for a university lecturer describing the information shown below.
You should write at least 150 words.
Women in postgraduate study 1985-2000
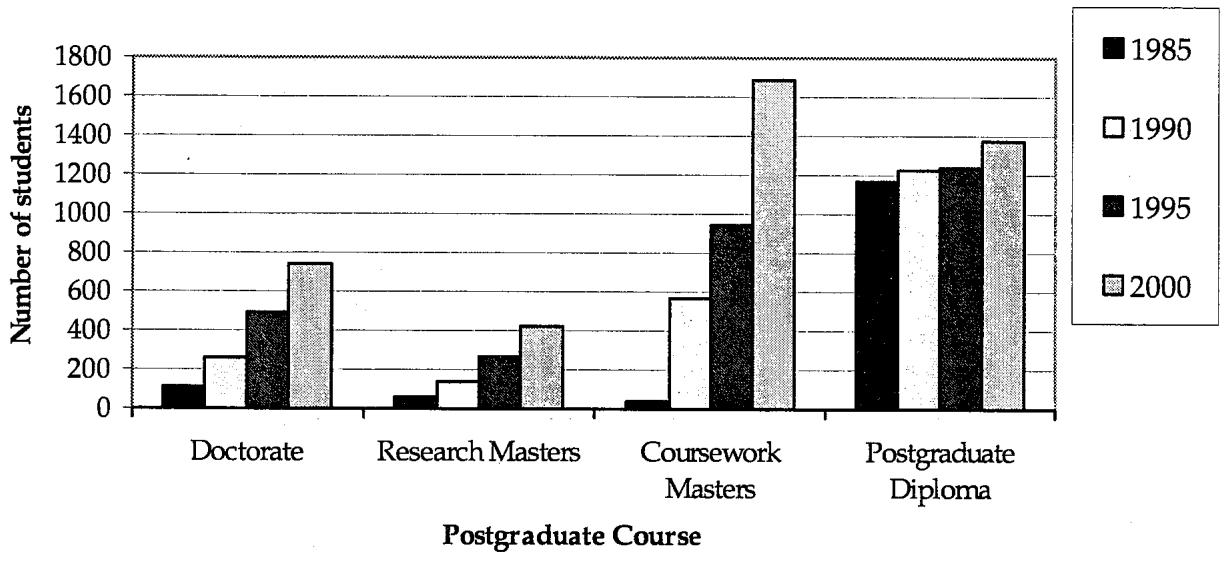
Men in postgraduate study 1985-2000

Line Graph (ET2/3) Experimental task 3 (more complex)
You should spend about 20 minutes on this task.
The graphs below show the numbers of women and men studying postgraduate courses in an Australian university between 1985 and 2000.
Write a report for a university lecturer describing the information shown below.
You should write at least 150 words
Women in postgraduate study 1985-2000
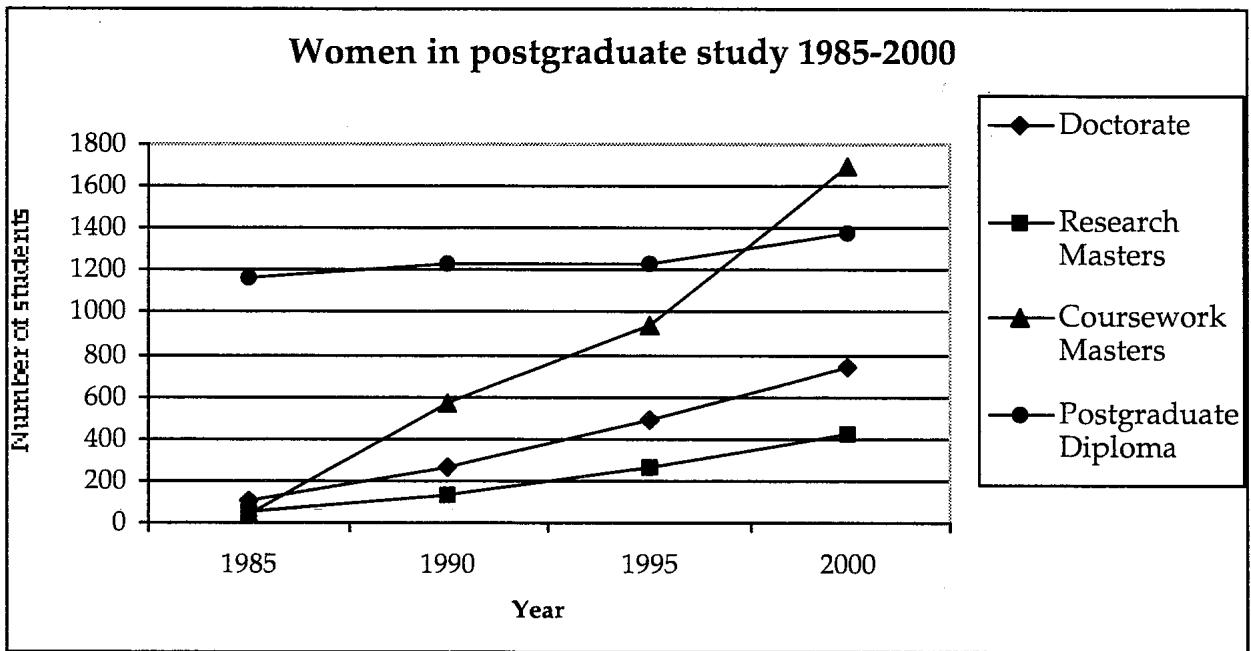
Men in postgraduate study 1985-2000
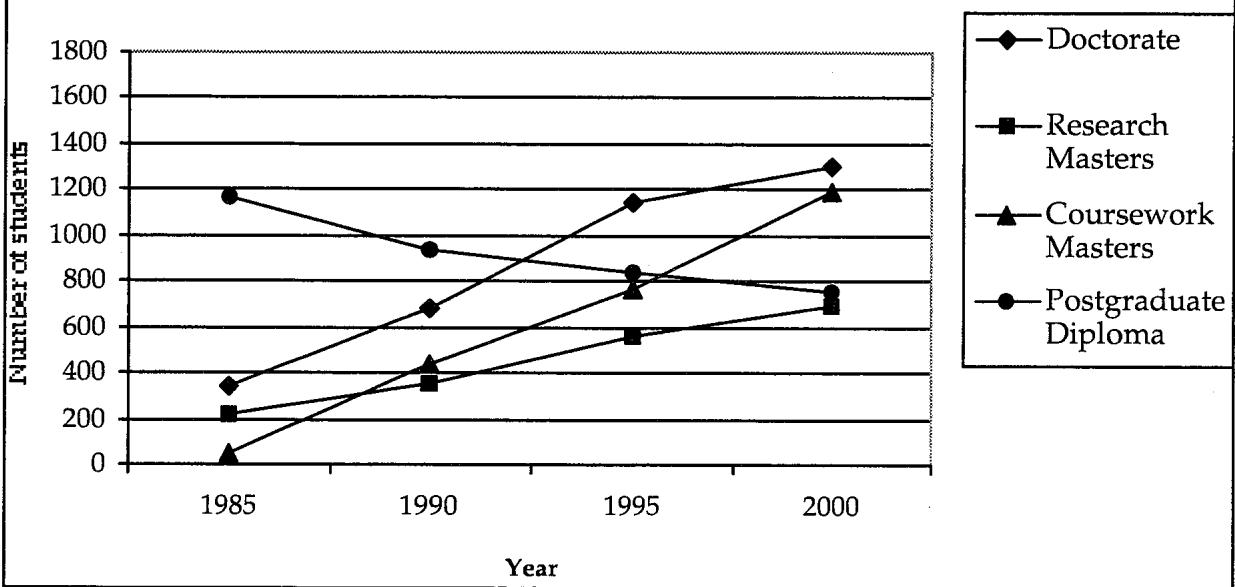
Reverse line Graph (ET2/4) Experimental task 4 (more complex)
You should spend about 20 minutes on this task.
The graphs below show the numbers of women and men studying postgraduate courses in an Australian university between 1985 and 2000.
Write a report for a university lecturer describing the information shown below.
You should write at least 150 words
Women in postgraduate study 1985-2000
Men in postgraduate study 1985-2000
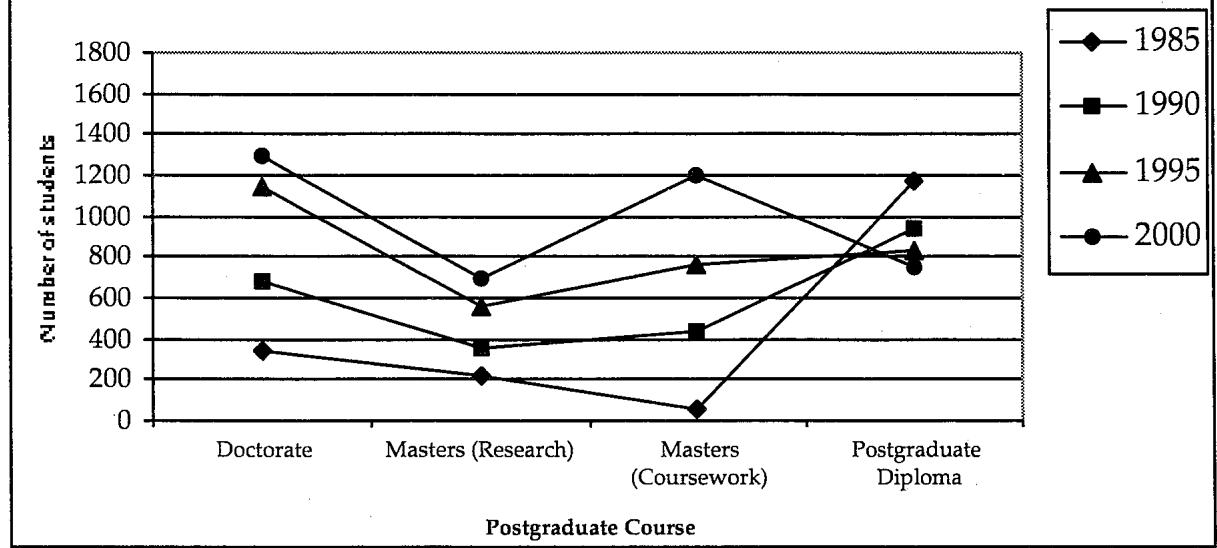
Table (ET2/5) Experimental task 5 (more complex)
You should spend about 20 minutes on this task.
The graphs below show the numbers of women and men studying postgraduate courses in an Australian university between 1985 and 2000.
Write a report for a university lecturer describing the information shown below.
You should write at least 150 words
Women in postgraduate study 1985-2000
| 1985 | 1990 | 1995 | 2000 | |
|---|---|---|---|---|
| Doctorate | 111 | 259 | 492 | 740 |
| Masters (Research) | 59 | 138 | 267 | 423 |
| Masters (Coursework) | 39 | 567 | 943 | 1688 |
| Postgraduate Diploma | 1167 | 1226 | 1237 | 1375 |
Men in postgraduate study 1985-2000
| 1985 | 1990 | 1995 | 2000 | |
|---|---|---|---|---|
| Doctorate | 341 | 681 | 1139 | 1300 |
| Masters (Research) | 222 | 349 | 557 | 697 |
| Masters (Coursework) | 54 | 438 | 763 | 1194 |
| Postgraduate Diploma | 1173 | 935 | 834 | 753 |
Appendix 3.3 Ethics Consent
Date
Dear Student,
We are conducting a study called “Task design in IELTS academic writing task 1”. We are looking at the effects on student writing of (a) the way the information is presented and (b) the amount of information that has to be included in the essay.
The research is being done by Gillian Wigglesworth, Department of Linguistics, Macquarie University (ph: 02 9850 8724) and Kieran O’Loughlin, Department of Language, Literacy & Arts Education, University of Melbourne (ph: 03 8344 8377).
You will be asked to write four short essays like those in the academic writing task 1 of IELTS. Your performance on these tasks will not influence your test results in the official IELTS examination. Neither will they be considered in assessment exercises you do for your classes. Names will be removed from the essays so that your confidentiality will be ensured. The data will be kept in a locked filing cabinet to which only the researchers have access. If you would like to find out about the results of this research, these will be available from the researchers in approximately one year from now. This research project is funded by the IELTS research program.
Please note that you have the right to withdraw from further participation in this research at any time without having to give a reason and without any negative consequences.
Yours sincerely,
Gillian Wigglesworth & Kieran O’Loughlin
I agree to participate in this research.
Signed (Participant) ________________ Date ________________
Signed (Investigators) ________________ Date ________________
The ethical aspects of this study have been approved by the Macquarie University Ethics Review Committee (Human Research). If you have any complaints or reservations about any ethical aspect of your participation in this research, you may contact the Committee through the Research Ethics Officer (telephone [02] 9850 7854, fax [02] 9850 8799, email: rachael.krinks@mq.edu.au). Any complaint you make will be treated in confidence and investigated, and you will be informed of the outcome.
Appendix 3.4 Design of Data Collection
| TASKS | 1/1 | 1/2 | 1/3 | 1/4 | 1/5 |
|---|---|---|---|---|---|
| 2/1 | 59 60 1 2 101 124 164 183 201 | 61 62 19 20 102 111 144 184 | 77 78 27 28 112 121 161 | 83 84 35 36 122 162 181 | 95 96 43 44 123 142 163 182 215 216 |
| 2/2 | 3 4 51 52 128 146 168 205 206 220 | 11 12 63 64 103 147 | 79 80 29 30 104 113 125 165 | 85 86 37 38 114 126 148 166 188 214 | 97 98 45 46 127 145 167 185 |
| 2/3 | 53 54 5 6 129 149 189 | 65 66 13 14 130 150 190 204 219 | 71 72 21 22 131 151 152 191 192 213 | 87 88 39 40 105 115 132 172 | 99 100 47 48 106 116 210 |
| 2/4 | 55 56 7 8 107 118 | 7 67 68 15 16 134 136 153 174 193 212 | 73 74 23 24 108 154 194 203 | 89 90 31 32 135 155 175 195 202 209 | 91 92 49 50 117 133 156 173 |
| 2/5 | 57 58 9 10 119 138 160 178 200 | 69 70 17 18 120 140 180 | 75 76 25 26 137 157 177 197 208 211 | 81 82 33 34 109 158 198 217 | 93 94 41 42 110 139 159 179 199 218 |