
Investigation of relationships between learner background, linguistic progression and score gain on IELTS
Official IELTS research report on IELTS Test - Speaking; Impact and Washback - Improvement in test scores; Impact and Washback - Performance data of candidates and IELTS, published in 2021.
Abstract
This project investigated to what extent IELTS test performances (i.e., overall test scores, speaking section scores, and linguistic constructs of speaking) changed over a period of three months. It further examined how learner background variables affected linguistic progress and band score gains on the IELTS.
Fifty-two Korean students, enrolled in IELTS preparation classes, participated in the study. Participants’ proficiency levels were determined by their in-house placement test scores (i.e., roughly 16 beginners, 17 intermediate and 19 advanced). After participants completed the pre-test survey, they took the pre-arranged official IELTS test. Participants’ hours of study and target language use information was collected weekly. The post-survey and online interviews were conducted at the end of the three-month period right after the official IELTS post-test. The individual long-run speaking responses from the pre- and post-tests were used for speech analysis (i.e., pronunciation and lexico-grammatical features) to examine their linguistic gains over time.
The results showed that students made various progress in English over the three-month period with an average gain of slightly less than half a band (.3), and with the most score gain in the writing skill and the least score gain in the speaking skill. Approximately 60% of the participants gained .5 or 1 band scores. In particular, hours of study and level of proficiency predicted the band score gains most potently. Together with the amount of target language, the background variables explained 34% of variance in the score gains. Fluency features revealed the most significant improvement over time, but complex relationships were found between learner background characteristics and speech construct changes.
The findings offer useful implications for the development of language testing and assessment as well as curriculum planning.
1 Introduction
1.1 Overview of purpose
The International English Language Testing System (IELTS) plays a critical role for those who take the test and use its score for their life chances. Accordingly, much research has examined the relationship between IELTS scores and academic performance for its predictive validation (e.g., Hill, Storch & Lynch, 1999).
In particular, studies on IELTS Speaking tests often focus on topics of interview methods, candidates’ attitudes and discourse, task difficulty, and the rating process (e.g., Brown, 2006). Findings of these studies have provided IELTS with valuable insights into the language and behaviour of candidates and examiners in the IELTS test. Researchers have also gathered useful evidence relating to the validity, reliability, practicality and impact of the test.
However, questions still arise regarding the impact of the test on students’ learning outcomes and the relationships between learners’ background factors and their learning progression. Undoubtedly, as Brecht, Davidson and Ginsberg (1993) point out, individual differences (e.g., gender, other FL learning experience, and first language proficiency in reading and grammar) may be predictors in how successful a language learner will be at learning a new language. Elder and O’Loughlin (2003) examined the relationship between intensive English language study and band score gains on IELTS, and showed that students made some progress in English during the three-month period with an average gain of half a band overall. Green (2007) investigated the washback of the IELTS writing test on English for academic contexts. Nevertheless, it is still uncertain how the improvement of a specific linguistic parameter relates to learners’ individual characteristics from a longitudinal perspective. What learning strategies or styles should institutions and individuals adopt to maximise students’ chances of success? Furthermore, how learners’ background factors impact their test score gains needs to be further documented. Accordingly, the current study attempted to tackle such questions.
1.2 Aims of this project
The purpose of the research project was to investigate learners’ linguistic gains over a semester (12 weeks) in the English as a Foreign Language (EFL) context as they could relate to the learning hours that learners spend on specific language skills and evaluation criteria: pronunciation, grammar, and lexicon. An EFL context was chosen because a vast majority of students who take the IELTS Academic tests are located in EFL countries. In addition, the project further explored how learner background variables (e.g., hours of study invested, amount of target language use, and level of proficiency) could affect their linguistic development and band score gains on the IELTS. These background variables were specifically measured to examine the association between those variables and students’ learning outcomes.
To be precise, the project classified the type of study hours by its location (in-class vs. out-of-class) and by its purpose (IELTS test-preparation vs. others), and examined the relationship between certain types of study hours and learners’ score gains and learning development. The study hypothesised that the hours of study for test preparation would highly correlate with students’ band score gains, but linguistic gains might appear to be more complex. In fact, these hypotheses relatively corresponded to the actual findings of the study. The contribution of this research is to address a gap in applied linguistics research by incorporating linguistic analyses (which have been widely conducted in the field) into a novel study focusing on the relationships between learners’ proficiency levels, their developmental gains in language learning, and their background characteristics.
1.3 Study context
The EFL context selected for this study was South Korea. The study recruited adult participants who were enrolled in IELTS test preparation classes at a language institution pseudo-named ‘L’ English in Seoul. ‘L’ English focuses mainly on IELTS and Occupational English Test (OET) test preparation. It also offers courses on general speaking. Its colleges are located in Seoul and Busan. In general, students can choose from 4-week, 8-week or 12-week IELTS preparation courses, depending on their schedule. The student participants in this study were asked to take the IELTS test in a designated IDP testing centre in Seoul.
2 Theoretical background
This section outlines the theoretical framework for this study, drawing on three major areas of research: (a) language development and sociocultural perspectives;
(b) individual factors in language development; and (c) linguistic evidence of language development. We take a sociocultural perspective on second language acquisition in order to acknowledge the role of learner-external (i.e., contextual) factors in learning a language. Additionally, individual differences research on attitudes, motivation, time and target language contact informs us of relevant learner-internal factors that contribute to language learning. Finally, there is a robust body of previous research demonstrating that systematic analysis of learners’ language output can yield evidence of linguistic development across all linguistic subskill areas measured on the IELTS. Together, these three research strands provide a comprehensive framework for examining language development in the context of IELTS preparation.
2.1 Language development and sociocultural perspectives
Much research in SLA has focused on treating language learning as a cognitive process, focusing mainly on mental and individual factors that affect a learner’s development in a second or foreign language. However, recent research has been calling for the incorporation of external factors that may also have an effect on a learner’s development in a second/foreign language (Aimin, 2013). In fact, many researchers claim that social context provides an appropriate framework in which linguistic features are expressed.
Sociocultural theory, originated in the 1920s by Vygotsky (1978), stipulates that learning a (first and second) language is ultimately achieved through communication and social interactions. In this theory, learning is a social phenomenon that takes place as a result of interaction between the learner and the environment. Language learning does not happen simply through personal effort, but through learners’ negotiation with other people through the Zone of Proximal Development (ZPD; Lantolf & Thorne, 2007). In the ZPD, learners interact with an interlocutor to co-construct knowledge. Typically, this collaboration involves a more experienced or knowledgeable interlocutor (i.e., a highly proficient speaker of a target language) so that the interlocutor can scaffold, or support, the learner’s efforts to perform at a higher level. Developmental processes occur as the outcome of a learner’s participation in cultural and linguistic settings (Lantolf, 2000). For language development, it is important for learners to continue their interactions in these social contexts (Lantolf & Thorne, 2007). Moreover, language teachers and researchers should acknowledge the interrelatedness of cognition and emotion in this learning process because language itself plays a central role in promoting individuals’ thinking processes (Swain et al., 2015).
From a sociocultural perspective, there can be as much learning accomplished outside the classroom as there is inside (Collentine & Freed, 2004). This is especially true in an ESL context where social interaction in the target language is a key aspect in the acquisition of native-like forms and linguistic features. In an EFL context, however, such opportunities for interaction are less likely to be readily available. More importantly, while it is clear that social interactions influence lexical and grammatical choices, it is also true that the latter choices organise social interactions as well (Atkinson, 2002). Therefore, this project acknowledges the importance of learners’ external factors in the systematic acquisition of a language while recognising that an EFL learning context may present challenges to achieving an optimal environment for knowledge co-construction in the target language.
2.2 Individual factors in language development
Beyond the factors external to the learner that are central to the sociocultural paradigm, there is a growing body of research that supports the significance of individual learner factors in second language (L2) development. Gardner’s socio-educational model of language acquisition (1985, 2010) provides a framework for two key individual factors: motivation and attitudes. Learner motivation (i.e., goal-directed behaviour) and attitudes toward their learning situation have been shown to positively correlate with L2 achievement (Masgoret & Gardner, 2003). Both instrumental (practical goal-oriented) and integrative (personal growth and community inclusion-oriented) motivation contribute to language development. In the past two decades, research on learner motivation has shifted to acknowledge that motivation is rarely a static construct - though considered an individual difference among learners, it may be impacted by external, environmental factors (Dörnyei & Ryan, 2015). In the Korean L2 classroom context, for instance, teachers’ pedagogical strategies designed to boost student motivation have been positively associated with learners’ engagement (Guilloteaux & Dörnyei, 2008).
An additional learner factor that is critical to language development is time. Lightbown and Spada (2020) claim that time “may be the single best predictor of outcomes in L2 learning” (p. 422). This factor is often at odds with both classroom programs and learner desires in that there is a push to ‘fast-track’ the language learning process. However, studies endeavouring to provide a research-based estimate of how long it takes to learn a language have consistently shown that the number of hours cannot be cut to expedite the process. The US Foreign Service Institute (FSI) has estimated that reaching an intermediate proficiency level (roughly a B2 level on the Common European Framework of Reference for Languages) takes anywhere from 600 hours of classroom instruction over 24 weeks (for languages closely related to the learner’s L1) up to 2,200 hours over 88 weeks (for languages distant from the learner’s L1), in addition to three to four hours of daily self-directed study outside of the classroom (US Foreign Service Institute, n.d.). The FSI categorises Korean in the latter group, meaning that the distance from English is quite high. For learners of English, Pearson’s Global Scale of English (GSE) project has estimated a range of 760 to 2,495 active learning hours for English language learners to reach a B2 level (Benigno et al., 2017). Furthermore, the length of time required to move from one CEFR level roughly doubles with each level increase (i.e., fast learners may take 95 hours to move from A1 to A2 but 190 hours to move from A2 to B1, etc.).
Outside of the classroom, learners’ contact with the target language can have a meaningful impact on language development. Often achieved through study abroad (SA) experiences, language contact has demonstrated positive effects on learners’ oral fluency (Freed, Segalowitz & Dewey, 2004; Trenchs-Parera, 2009), listening (Cubillos et al., 2008), reading (Dewey, 2004; Llanes Baro & Serrano Serrano, 2011), lexical development (Collentine, 2004; Milton & Meara, 1995), and pragmatic development (Taguchi, 2008; Taguchi et al., 2013). SA and ESL experiences provide immersion in the target language, though learners in non-SA or ESL contexts may seek to build a more immersive learning experience through a combination of language classes, contact with speakers of the target language, and technology-mediated interactions in the target language (e.g., online gaming, social media, chatting). The impact of such learner efforts remains unclear.
2.3 Linguistic evidence of language development
When measuring language development, high-stakes English proficiency exams include both receptive and productive language tasks. One such example is the IELTS test, which is often used to measure the English proficiency of non-native speakers of English intending to study at a tertiary institution. The popularity of IELTS as an admission tool has grown exponentially over the past decades (www.ielts.org). The current project focused on the IELTS Academic test. It consists of four different language skills: Reading, Writing, Listening and Speaking. After taking the test, test-takers receive a report of their results, which includes a band score of between 0 and 9 for each skill and an overall score, which is an averaged score of the four individual skills. Most tertiary universities worldwide tend to require a minimum of 6 or 6.5 for undergraduate study and 7 for graduate study. Mean band scores for IELTS Academic for Korean learners of English are 5.7 (reading), 6.0 (listening), 5.6 (speaking), and 5.6 (writing) (IELTS Research, 2020). Notably, this indicates that the two productive skills, speaking and writing, are the lower subskills among Korean learners of English.
Given these findings about Korean learners’ speaking performance on IELTS, an analysis of the language produced on the IELTS speaking section could yield valuable insights into which fluency, lexical, grammatical, and phonological features contribute to these scores, as well as which can realistically be improved through a program of IELTS preparation. The IELTS speaking section is a composite of scores in four subskill areas: Fluency and Coherence; Lexical Resource; Grammatical Range and Accuracy; and Pronunciation. Previous research has shown variables in all four linguistic categories to have a meaningful impact on language learners’ proficiency.
Acoustic fluency measures such as speech rate (Kormos & Dénes, 2004) and pause structures (Brown & Yule, 1983) are demonstrated predictors of oral performance ratings. Indeed, these suprasegmental features can account for up to 50% of the variance in ratings of oral performance (Kang et al., 2010). Such features also correlate highly with the overall discourse structure of oral performances, as listeners rely on prosodic features to identify major discourse boundaries (see Pickering, 2001).
Lexical correlates with oral proficiency, including vocabulary range and richness (Brown et al., 2005). Vocabulary richness refers to the proportion of low and high frequency vocabulary used in each spoken response, whereas vocabulary range is the ratio of word types (i.e., unique words produced) to word tokens (i.e., all words produced; Nation, 2013). Iwashita et al. (2008) found that increases in proficiency level were associated with an increase in the number of words produced (tokens) and a wider range of words (type).
From a grammar standpoint, both accuracy and complexity contribute to determinations of language proficiency. Grammatical accuracy, when measured globally (Brown et al., 2005), is suggested as a possible predictor of oral language accuracy, according to empirical studies in language testing and second language acquisition (e.g. Foster & Skehan, 1996). Global accuracy, measured through errors per C-unit, varies significantly between proficiency levels (Iwashita et al., 2008) and speaking tasks and scores (Jamieson & Poonpon, 2013). The number of verb phrases per C-unit (the verb-phrase ratio) has been identified as the most significant feature that distinguishes proficiency levels among spoken responses (Iwashita et al., 2008). In addition, grammatical complexity is often examined by counting occurrences of prepositional phrases, passive structures, and adjectives as they revealed a significant effect on task and scores (Jamieson & Poonpon, 2013).
Numerous pronunciation features have been found to correspond to oral proficiency ratings (see Kang et al., 2010; Kormos & Dénes, 2004). These include lexical stress, rhythm, segmental errors, tone choice, pitch range, and prominence. Speakers indicate lexical stress by raising their pitch, lengthening the vowel, increasing their intensity, and changing the vowel quality (Avery & Ehrlich, 1992). Inappropriate word stress is a contributor to communication breakdowns (Jenkins, 2002) and reduced comprehensibility among NNS (Kang, 2010).
Stress is also key to the rhythm of English, a stress-timed language. Among native speakers of inner circle varieties of English, a rhythm ratio of stressed to unstressed syllable length is commonly above 1, meaning stressed syllables are consistently longer than unstressed syllables (Kang et al., 2018). Among lower proficiency L2 speakers of English, however, these ratios are often below 1, indicating less difference in the length of stressed and unstressed syllables.
Segmental errors refer to noticeable deviations from expected segmental pronunciation. According to Catford (1987), not all segmental errors carry the same level of severity. Those that are most severe, known as ‘high functional load’, are the segmental errors with phonological contrasts used to distinguish meaning in a large number of words in English. ‘Low functional load’ errors are those in which the phonological contrast does not appear in many minimal pairs. High functional load errors tend to have a greater impact on listener comprehension (Kang & Moran, 2014) and may therefore affect proficiency ratings more than low functional load errors.
Tone choice, pitch range, and prominence are based on Brazil’s (1997) framework for intonation as a communicative tool. Tone choice is determined first by identifying the tone units (similar to thought groups in pronunciation literature) and then locating any prominent syllables within that tone unit. Prominent syllables show utterance stress (Pickering, 2018). Tone choice refers to the tone (i.e., pitch movement) on the final prominent syllable of a tone unit. Possible tone choices are rising, falling, and level. In Brazil’s (1997) model, falling tones are used to present new information, rising tones present known/previously stated information, and level tones are used for procedural language. A greater use of rising tones is associated with higher proficiency as these tones contribute to listener impressions of a shared background with the speaker (Kang et al., 2010). Pitch range refers to the point of F0 minima and maxima on prominent syllables within a given speech sample. A compressed or narrow pitch range has been shown to be characteristic of non-native speech rated as more accented (Kang, 2010).
Narrow pitch ranges can contribute to listener difficulties in discerning prosodic units (e.g., Pickering, 2004; Wennerstrom, 1994, 1998). Finally, prominence can be measured as pace and space following Vanderplank’s (1993) approach. Pace refers to the average number of stressed words per minute of speech; space is the proportion of prominent words to the total word count. Interlocutors use prominence in English to indicate new or contrastive information (Brown, 1983), with old or given information being unstressed (Hahn, 2004). An overuse of prominence has been attributed to lower-proficiency speakers, which makes it challenging for listeners to allocate their attentional resources appropriately (Juffs, 1990; Wennerstrom, 2000).
3 Rationale for the current study
Previous research has established that both learner-external and learner-internal factors contribute to language development, and that linguistic analysis of learner language production can provide evidence of such development. However, the relationship between these factors remains relatively unexplored. In this section, we present our rationale for the current study with an emphasis on its contribution to scholarship on learner progression as demonstrated through linguistic production on the IELTS.
3.1 Learner progression
Research has shown that learners from different backgrounds acquire language skills at various paces. For instance, novice learners may acquire a larger amount of vocabulary or grammar skills in a short period of time, whereas advanced learners might master a smaller number of features but with native-like proficiency and use (Ife, Vives Boix & Meara, 2000). Therefore, a learner’s proficiency level is considered as a predictor in his/her development over time. Moreover, there are certain individual factors (e.g. the use of the target language), which can also affect learning outcomes. These factors are especially relevant in an EFL context wherein a student has limited access to the target language. While there have been studies that have shown grammatical and lexical development (Lennon, 1990), the most consistent and observable gains that learners make are those related to fluency (as measured by temporal/hesitation phenomena) (Segalowitz & Freed, 2004). Furthermore, while earlier research has focused on lexical and grammatical development as two separate constructs in isolation, recent studies have shown that they could in fact be affecting each other, particularly that some lexical weaknesses may account for inaccurate grammatical structures (Gass, 1999).
This study will offer a more comprehensive view of the interaction between proficiency levels, learner backgrounds, and linguistic gains in hopes of consolidating the variations among previous studies and gaining better insights into the relationship between these variables.
The IELTS Academic test is for people applying for higher education in an English-speaking environment. It reflects some of the features of academic language and assesses test-takers’ readiness for academic study or training (www.ielts.org).
The current study will first examine relationships between learner background variables, various linguistic constructs, and IELTS band score gains. Then, it will narrow its scope down to IELTS speaking for linguistic analysis, which is a one-to-one interaction between the candidate and an examiner.
The three parts (Part 1: Introduction and interview; Part 2: Individual long turn; and Part 3: Two-way discussion) are given to the candidate for the opportunity to use a range of different speaking skills. In particular, the IELTS Speaking test and raters often perceive the candidate’s long uninterrupted turn in Part 2 as an important stage (Taylor & Falvery, 2007). This part provides the candidate with an opportunity for sustained language production and for taking the initiative in the interaction, and is considered as a particular and distinct enhancement to the revised speaking test (Taylor, 2001). As a result, the study will analyse the linguistic features of candidate output for the Academic Speaking Part 2 component.
4. Methodology
This section provides an overview of the mixed method research design and questions guiding this longitudinal study of 52 Korean EFL learners’ performance on the IELTS test. Research instruments included IELTS band scores, pre-/post-questionnaires, weekly surveys, and online interviews. Data were collected online and in official IELTS testing sessions over a one-year period. They were then coded for linguistic features and analysed using regression and linear mixed-effects approaches.
4.1 Research design
In this study, we applied a mixed method approach and correlational research method to the linguistic analysis of learning criteria, learner background variables, and IELTS gain scores. We first examined band score changes of IELTS between pre- and post-tests and their relationship with learner background variables (e.g., hours of study, use of target language, and proficiency). Then, we analysed the linguistic features of candidate output for each different linguistic criterion in IELTS speaking. After that, we identified those criterial features in candidates’ exam gain scores and determined the relationships between those features and learners’ learning backgrounds through a linear mixed-effects approach. Interview data were used only as supportive evidence to elaborate and help explain the quantitative data results (see discussion of this mixed methods model in Creswell & Clark, 2007).
4.2 Research questions
This study was guided by the following research questions.
RQ1. How do IELTS test performances (i.e., overall test scores, speaking section scores, and linguistic constructs of speaking) change over a semester of time investigated?
RQ2. How do learner-related variables (i.e., hours of study, amount of target language use, and level of proficiency) correlate with the band score gains of IELTS tests?
RQ3. How do learner-related variables (i.e., hours of study, amount of L2 use, and level of proficiency) correlate with the linguistic progression of IELTS speaking?
4.3 Participants
Participants in this study were 52 Korean students of English who enrolled in a 4-week, 8-week or 12-week IELTS preparation course at ‘L’ English, a language institute in Seoul, South Korea. Participants ranged in age from 16 to 53 years old (M = 26.75, SD = 8.91). Gender distribution was 61.5% female (n = 32) and 38.5% male (n = 20). The participants were placed into three proficiency levels - beginner (n = 16), intermediate (n = 17), and advanced (n = 19) - based on an in-house placement test with reading and writing sub-components that is regularly used by the language institute. Level placements were determined by the following cut-offs: beginner (1.0-4.0), intermediate (4.0-6.0), and advanced (6.0 and higher). For students with previous IELTS experience, prior IELTS scores were also considered in the placement process.
When enrolling in the IELTS preparation course, participants had the option of taking morning, afternoon or evening classes. Morning and afternoon classes were offered Monday to Friday for four hours per day (200 instructional minutes per day). Evening classes were offered Monday to Friday for 90 minutes per day. While the courses placed a balanced emphasis on skills for the four sections of the IELTS test (listening, reading, writing, speaking), the instructional approach varied depending on learners’ proficiency, with the aim of helping learners improve their IELTS scores as much as possible in the given course session. Beginner-level courses focused on building student familiarity with the question types and prompts for the IELTS test, and provided tips for learners to develop their ideas. Intermediate-level courses emphasised identifying individual students’ weaknesses and supplying detailed feedback for improvement in those areas. At the advanced level, courses focused on formulaic language and practice for more native-like language production. Finally, all courses, regardless of level, included weekly mock IELTS tests with detailed feedback provided to learners. Once placed, students were able to move on to a higher level in the middle of their 12-week track if they frequently scored higher on their weekly mock test.
4.4 Research instruments
IELTS test scores were the primary outcome measure in this study. We also gathered learner data through background questionnaires, weekly language study/use surveys, and interviews. The surveys asked learners to assess their English learning process and report on individual characteristics, such as hours spent on learning, amount and type of L2 use, and level of proficiency. The interviews solicited feedback from all participants, with follow-up interviews for those who showed the least improvement.
4.4.1 The IELTS test
All participants took the official IELTS test twice, administered free of charge to students at the beginning and end of their 12-week study period in the context of a regular administration session. Current versions of the test were used in all cases. The length of time between the pre- and post-tests ranged from 77 to 98 days (M = 88.53, SD = 5.55), with one outlier whose post-test was delayed for an additional three months due to the COVID-19 situation. Once the exams were scored, we received an official score report for each participant, along with the recording of their speaking performance and their speaking band sub-scores (i.e., fluency and coherence, lexical resource, grammatical range and accuracy, and pronunciation). The overall pre- and post-test band scores were used as measures of participants’ proficiency at the start and end of the study, respectively.
4.4.2 Background questionnaires
Pre- and post- background questionnaires were administered to all participants at the beginning and end of the study period via Qualtrics (see Appendices A and B). The questionnaires included both forced-choice and open-ended items as seen in Elder and O’Loughlin (2003), and were designed to elicit general information about a range of variables that could potentially predict learners’ IELTS score gains. These included participants’ demographics, previous English study, educational level, previous study abroad experience, future degree plans, target IELTS score to achieve academic goals, mock IELTS exam scores, and instrumental motivation for both learning English and taking the IELTS. On the post-questionnaire, learners were also asked to indicate their perceived progress in their English skills and their IELTS performance, plus their overall hours of study and amount of target language use.
Hours of study was measured through nine items that asked about the total number of hours spent studying in class and outside of class that week. These items targeted time attending class, doing homework, studying alone, studying with others, doing IELTS practice, and practising the four IELTS skill areas (reading, listening, speaking, writing). For each item, participants had 11 answer options ranging from 0 hours to more than 16 hours. Composite scores from these nine items across all 12 weeks plus the post-questionnaire were used for analysis. The hours of study measure was included to better understand the relationship between students’ time investment in their learning and their assessment outcomes.
The amount of target language use was measured through 11 items in which learners reported on their weekly hours of English language contact and exposure outside of the study context. This set of items was adapted from Freed et al. (2004) and has been used in Kermad and Kang (under review). These items focused on English use in communications with NSs, NNSs, family, and people in online gaming. They also measured exposure to English through TV, movies, online videos (e.g., YouTube), music, general internet use, social media, and reading for non-study purposes. Similar to the hours of study measures, items had 11 answer options ranging from 0 hours to more than 16 hours. Composite scores from these 11 items across all 12 weeks plus the post-questionnaire were used for analysis. Because this study was conducted in an EFL context, we posited that the amount of target language use would provide important information to explain participants’ learning progression in English.
4.4.3 Weekly language use/study survey
Throughout the 12-week study period, learners were asked to complete a weekly Qualtrics survey on their language study and language use (see Appendix C). The purpose of this survey was to measure two key predictor variables: hours of study and amount of target language use (TLU).
4.4.4 Online interviews
Individual online interviews were conducted with all 52 participants after they completed their post-test (see Appendix D). The open-ended questions were designed to elicit more information about participants’ perception of their IELTS performance and efforts to prepare for the exam. Questions were presented in English, though participants had the option of responding in English or Korean. Interviews were conducted via online chat or email, so all responses were written. These responses provided insight into possible reasons for participants’ progress over the 12-week study period.
A subset of six participants whose post-test scores remained the same or dropped from their pre-test performance were contacted for an additional follow-up interview by email; only three of them responded to the follow-up questions in Appendix D. The aim with this follow-up interview was to shed light on why some participants showed a score drop between their pre- and post-tests. The follow-up questions for this group asked them to reflect on their performance, consider what (if any) alternative test-taking strategies they would employ in future rounds of IELTS testing, and provide general feedback on their experience in this study.
4.5 Data collection
Data were collected over a one-year period from May 2019 to May 2020. Participant recruitment was managed by a member of the research team located in Seoul in collaboration with the language school director. To start the study, participants provided informed consent and completed the pre-questionnaire, then took the official IELTS test. They then completed their IELTS preparation course while providing weekly survey updates on their mock exam scores, hours of language study, and amount of target language use. Upon completion of their course, participants responded to the post-questionnaire and then took the official IELTS test for a second time. Before receiving their final IELTS scores, participants completed the online interviews. Those who were selected for an additional follow-up interview were contacted at the end of the study, after having received their final IELTS scores. As IELTS scores and sound files were processed by IDP, they were mailed to members of the research team in the US for transcription and linguistic analysis.
4.6 Data analysis
Data analysis consisted of transcription of audio files and coding for linguistic features using both human coding and automatic feature extraction. Data were then analysed statistically, including descriptive and frequency analysis to identify linguistic patterns, and regression and linear mixed-effects modelling to examine relationships between IELTS test performance, learner-related variables (i.e., hours of study, amount of target language use, and proficiency), and linguistic progression on the IELTS speaking section.
4.6.1 Data coding
The first minute of the individual long-run (Part 2) spoken responses was coded for linguistic analysis. The speech samples (one minute each, 52 pre-tests + 52 post-tests = 104 minutes) were clipped using Audacity (Version 2.4.1), converted to digital .wav files, and transcribed using a consistent transcription convention (Biber et al., 2004). The transcripts were verified against the original data by the researchers before being coded.
The spoken responses were coded for linguistic features in the four IELTS speaking band categories (i.e., fluency and coherence, lexical resource, grammatical range and accuracy, and pronunciation) through a combination of automatic computer extraction methods and human coding. These methods have been used extensively in the first author’s previous research (see Kang, 2010; Kang et al., 2010; Kang & Johnson, 2018a). Suprasegmental features (speech rate, silent pauses, filled pauses, tone choice, pitch range, and prominence) were extracted using Kang’s patent-awarded prosodic modelling program (Kang & Johnson, 2018b).
Lexical features (type-token ratio, K1 words, K2 words, and AWL words) were measured using the LexTutor vocabulary profiler (Version 4; Cobb, 2020).
Grammatical (accuracy and complexity), rhythm, and segmental (lexical stress, segmental errors) features were coded by two trained human coders using the computer-assisted speech analysis program, PRAAT (Boersma & Weenink, 2007; http://www.praat.org).
Inter-coder reliability (Cronbach’s alpha) was calculated for the three manually coded sets of features, with all three values (grammar = .991, rhythm = .984, segmental = .932) meeting acceptability.
4.6.2 Linguistic analysis
Pre- and post-test spoken responses were coded for linguistic features whose significance was both theoretically motivated and relevant to the IELTS speaking band descriptor categories (see https://www.ielts.org/-/media/pdfs/speaking-band-descriptors.ashx?la=en). These linguistic variables are summarised in Table 1 and explained in more detail following the table.
Table 1: Linguistic variables
| Speaking band category | Variable | Operationalisation |
|---|---|---|
| Fluency and coherence | Speech rate | Composite of the syllables per second, articulation rate, and mean length of run (Kang, 2010; Kormos & Dénes, 2004) |
| Fluency and coherence | Silent pauses | Composite of number and length of silent pauses (Kang, 2010; Kormos & Dénes, 2004) |
| Fluency and coherence | Filled pauses | Composite of number and length of filled pauses (Kang 2010; Kormos & Dénes, 2004) |
| Lexical resource | Type-token ratio (TTR) | Ratio of the number of word types (i.e., unique words produced) to the number of word tokens (i.e., all words produced) (Brown et al., 2005; Nation, 2013) |
| Lexical resource | K1 words | Proportion of word tokens produced from the first 1000 most frequent word families (Laufer & Nation, 1995) |
| Lexical resource | K2 words | Proportion of word tokens produced from the second 1000 most frequent word families (Laufer & Nation, 1995) |
| Lexical resource | AWL words | Proportion of word tokens produced from the Academic Word List (AWL; Coxhead, 2000) |
| Grammatical range and accuracy | Grammatical accuracy | Global accuracy, calculated as number of error-free C-units divided by total number of C-units (Brown et al., 2005) |
| Grammatical range and accuracy | Grammatical complexity | Composite of C-unit complexity (number of C-units divided by number of clauses), verb phrase ratio (number of C-units divided by number of verb phrases), and dependent clause ratio (number of dependent clauses divided by total number of clauses) (Brown et al., 2005) |
| Pronunciation | Rhythm | Ratio of the length of the stressed syllable to the length of the unstressed syllable, measured on the first 10 two-syllable words produced in each file (Kang et al., 2018) |
| Pronunciation | Tone choice | Rising, falling, or level tone, measured on the final prominent syllable in the tone unit (Brazil, 1997) |
| Pronunciation | Pitch range | Difference between the highest and lowest prominent syllable F0 pitch values (Kang, 2010; Kormos & Dénes, 2004) |
| Pronunciation | Prominence | Composite of pace (average number of prominent words per minute) and space (proportion of prominent words to total number of words) (Vanderplank, 1993) |
| Pronunciation | Lexical stress | Number of errors in lexical stress placement (i.e., stress on the wrong syllable in a word) |
| Pronunciation | Segmental errors | Number of segmental errors categorised as either high or low functional load (Catford, 1987; Kang & Moran, 2014) |
Fluency and coherence measures in this study were selected based on extensive L2 suprasegmental findings (e.g., Kang et al., 2010; Kormos & Dénes, 2004). The fluency variables measured were: (a) speech rate, (b) silent pauses, and (c) filled pauses. Speech rate was calculated as a composite of syllables per second (total number of syllables divided by total speech length), articulation rate (total number of syllables divided by time spent talking excluding pauses), and mean length of run (average number of syllables produced between pauses of 0.1 seconds or longer). The pause variables were a composite of the number and duration of each pause type (i.e., silent and filled). Number of silent and filled pauses was calculated as the number of pauses per minute of speech. Duration of silent and filled pauses was calculated as the duration of the respective pause type divided by the number of that pause type. These features were automatically extracted from the sound files using Kang’s prosody modelling program.
Lexical resource was measured through vocabulary range and richness (Brown et al., 2005). The individual variables were: (a) type-token ratio (TTR), (b) proportion of K1 words, (c) proportion of K2 words, and (d) proportion of AWL words. Type-token ratio was calculated as the total number of word types divided by the total number of word tokens (Nation, 2013). Vocabulary richness was represented by a proportion of K1 (first 1000 most frequent word families), K2 (second 1000 most frequent word families), and AWL (academic word list) tokens used in each spoken response (Coxhead, 2000; Laufer & Nation, 1995).
Grammatical range and accuracy were first identified by coding transcripts for the number of C-units, number of error-free C-units, number of clauses, number of dependent clauses, and number of verb phrases. In this study, a C-unit was operationalised as an independent clause and its modifiers, while a clause was defined as a statement containing both a subject and a predicate (Hughes et al., 1997). Grammatical accuracy was measured globally as the number of error-free C-units divided by the total number of C-units (Brown et al., 2005). Grammatical complexity was measured as a composite of: (a) C-unit complexity (number of C-units divided by number of clauses); (b) verb phrase ratio (number of C-units divided by number of verb phrases); and (c) dependent clause ratio (number of dependent clauses divided by total number of clauses).
Though numerous pronunciation features were automatically extracted and manually coded from the sound files, those deemed most relevant to the IELTS speaking task and motivated by previous research (see Kang et al., 2010; Kormos & Dénes, 2004) were: (a) rhythm, (b) tone choice, (c) pitch range, (d) prominence, (e) lexical stress errors, and (f) segmental errors.
Rhythm was measured by identifying the first 10 two-syllable words produced in each sound file and determining the length of each syllable. The rhythm ratio was then calculated as the ratio of the length of the stressed syllable to the length of the unstressed syllable.
Tone choice was measured as the tone (i.e., rising, falling, or level pitch movement) on the final prominent syllable of each tone unit.
Pitch range was calculated as the point of F0 minima and maxima appearing on the prominent syllables within the speech sample.
Prominence was measured as pace and space following Vanderplank’s (1993) approach. Pace refers to the average number of stressed words per minute of speech; space is the proportion of prominent words to the total word count.
Lexical stress errors were identified as misplaced syllable stress within words.
Segmental errors were coded when a speaker’s segmental production deviated noticeably from the expected pronunciation. A total of 112 different segmental error types were identified in speakers’ language production. After coding these errors, we classified them according to Catford’s (1987) functional load levels. Errors with a functional load value of 50 or higher were considered ‘high’ functional load; those with a functional load below 50 were considered ‘low’ functional load (Kang & Moran, 2014).
4.6.3 Statistical analysis
The linguistic patterns identified in this study were explained through frequencies and descriptive statistics. In order to assess the dimensionality of constructs of IELTS Speaking operationalised through the rating scale and to reduce the number of linguistic variables, some of the highly-correlated speech features were clustered into larger concepts of speech constructs. The grouping of variables within each category was also made based on theoretically-grounded research findings and IELTS speaking band descriptors (https://www.ielts.org/-/media/pdfs/speaking-band-descriptors.ashx?la=en). This category-specific clustering effort was intentional to assist in the understanding of speech analysis results. That is, other common variable reduction approaches (i.e., PCA factor analysis or cluster analysis) might reduce the variable number efficiently, but they tended to lose the interpretability of category-specific speech properties. Upon identification of construct dimensions, each variable was computed using the regression method and then subjected to correlational analysis, to examine the overall saliency of each linguistic dimension and any systematic linguistic changes (operationalised as dimension scores) in speaking performance of examinees over the period of 12 weeks.
In order to answer the first research question regarding the overall score gains and the linguistic parameter changes, gain scores were calculated by subtracting the result of Test 1 from the result of Test 2 for the Global band score as well as for the subskill results. We also calculated the reliability and error rates of the tests by following Zumbo’s (1999) formula and Elder and O’Loughlin’s (2003) analysis. As for research questions 2 and 3, the primary analyses were regression models and linear mixed-effects models (LMEM). These two types of analyses were computed where and when appropriate. Before we conducted the mixed effect model analysis, we also examined Pearson correlation coefficients to ensure the independence of predictor variables.
The LMEM design treated students as random effects, learner background variables (e.g., hours of study, use of target language, and proficiency) as covariates, and the IELTS performance gain scores as a dependent variable. Using Nakagawa & Schielzeth’s (2013) suggestion, marginal R² and conditional R² were calculated to discuss the variance explained by the fixed (main) and random effects. As for the statistical criteria that aid in model selection, Schwarz’s Bayesian Criterion (BIC) was used. All the statistical analyses were performed on the Statistical Package for the Social Sciences (SPSS), Version 26.0 (IBM Corp., 2019).
5. Results
The results are presented in response to each of the three research questions, which are restated for the convenience of the reader.
5.1 RQ1: How do IELTS test performances (i.e., overall test scores, speaking section scores, and linguistic constructs of speaking) change over a semester of time investigated?
5.1.1 Overall test and speaking section score gains
Gain scores for the 52 students in the three different proficiency groups were calculated by subtracting the result of Test 1 from the result of Test 2 for the overall band score, as well as for the sub-test results for Speaking and its scoring criteria. Results derived from the observed score gain analysis are presented in Table 2.
Columns 2-6 show the mean and standard deviation together with the maximum, and minimum gain, and range (based on observed band scores) for the 52 students. Global (overall) score gains are presented as well as gains on the component sub-test of Speaking and its rating criteria (fluency and coherence, lexical resources, grammar and accuracy, and pronunciation). The three right-hand columns indicate the significance level of the observed score change (computed by means of the Wilcoxon’s sign rank test using Version 26 of the SPSS for Mackintosh) and the reliability of this change based on Zumbo’s formula (Elder & O’Loughlin, 2003; Zumbo, 1999).
These results show that the change in scores over the three-month period is statistically significant especially in the cases of the Global band (p=.000, d=.36) and the sub-rating criterion of fluency and coherence (p=.013, d=.28) with small-medium effect sizes. Even though the overall IELTS scores changed significantly with a small-medium effect size (d=.36), the score of the speaking test did not change noticeably over the period of three months. The average overall gain is slightly less than half a band (.3). Among the sub-rating criteria, the gain scores are higher for the section of fluency and coherence than that of other criteria. The reliability of the gain score estimate is generally high, although a little lower for the Global score than for the subskills. The maximum Global band gain achieved by any student was one band (six students) and the minimum was -1.0 (one student).
Table 2: Global band and Speaking score gains on IELTS (N=52)
| Test components | Mean | SD | Minimum gain | Maximum gain | Range | Z | p | Reliability |
|---|---|---|---|---|---|---|---|---|
| Global Band | .298 | .43 | -1.0 | 1.0 | 2.0 | -4.035 | .000 | .81 |
| Speaking | .125 | .58 | -1.0 | 1.5 | 2.5 | -1.327 | .185 | .89 |
| Fluency & Coherence | .27 | .74 | -1 | 2 | 3 | -2.47 | .013 | .91 |
| Lexical Resource | .12 | .85 | -2 | 2 | 4 | -.974 | .330 | .88 |
| Grammar & Accuracy | -.02 | .70 | -1 | 1 | 2 | -.200 | .841 | .87 |
| Pronunciation | -.02 | .82 | -2 | 2 | 4 | -.114 | .909 | .86 |
Additionally, we performed analyses for any significant score changes for other component sub-tests (i.e., listening, reading and writing skills), even though they are not a part of the current project’s research questions. Table 3 presents other subskill score gains.
Table 3: Other subskill score gains on IELTS (N=52)
| Test components | Mean | SD | Minimum gain | Maximum gain | Range | Z | p | Reliability |
|---|---|---|---|---|---|---|---|---|
| Listening | .308 | .64 | -1.0 | 2.0 | 3.0 | -3.083 | .002 | .87 |
| Reading | .231 | .77 | -1.0 | 2.0 | 3.5 | -2.076 | .038 | .87 |
| Writing | .462 | .62 | -1.0 | 2.0 | 3.0 | -4.303 | .000 | .89 |
Changes in scores over the three-month period are statistically significant in all three cases. The greatest gain of scores was for writing with the maximum gain of 2 (achieved by one student) and a minimum of -1 (for one of the participants) with a medium-large effect size (Cohen’s d) of .69. Sixteen of the participants gained 1.0 or higher in Test 2.
However, some students performed worse at Time 2 than at Time 1. Table 4 shows the number of students at each band level whose score increased at the post-test session compared with those whose score remained the same or went down. The mean gain for students at each band level is presented in the right-hand column.
Table 4: Frequencies of overall score gains across Band levels
| Band score on Test 1 | N | Higher score on Test 2 | Same score on Test 2 | Lower score on Test 2 | Mean gain on Test 2 |
|---|---|---|---|---|---|
| 4.0 | 3 | 3 | 0.5 | ||
| 4.5 | 5 | 5 | 0.7 | ||
| 5.0 | 8 | 6 | 2 | 0.44 | |
| 5.5 | 11 | 7 | 4 | 0.36 | |
| 6.0 | 11 | 7 | 3 | 1 | 0.32 |
| 6.5 | 6 | 2 | 3 | 1 | 0 |
| 7.0 | 7 | 2 | 2 | 3 | -0.07 |
| 7.5 | 1 | 1 | 0 |
The results show that the mean gain score on Test 2 tends to decrease as the students’ proficiency increases. Note especially that the number of the upper end of the continuum is very small (i.e., only one student); therefore, it may not be meaningful to identify any general trend with such a number. Overall, the gain score pattern found in our project reveals striking similarities reported in Elder and O’Loughlin’s (2003) study where the mean gain scores at the middle band levels (4.5, 5 and 5.5) were much greater than those at the higher proficiency level.
However, it is interesting to see that five advanced-proficiency students performed worse on Test 2 than at the first testing session. Comments collected from our additional online interviews offer further insights into this issue. All participants were asked to answer a question (i.e., Do you think your IELTS score improved in these 12 weeks? If so, why? If not, why?) after 12 weeks of lessons and the second test session. Later on, those five participants, whose Test 2 scores were worse than Test 1 score by -1 score band, were contacted again and asked to respond to an additional question: What do you think about your 2nd IELTS test scores in comparison to your 1st test? Are you satisfied with them? If so, why? If not, why?. Participants had the freedom of responding either in English or in Korean. When responses were provided in Korean, they were translated into English as seen examples in #33, #41 or #1 below).
Participant #3:
My IELTS score didn’t improve, during the given 12 weeks. It’s because during the given 12 weeks, I had to figure out individual problems.
Participant #33:
Because I got the score I wanted at the first testing session, I didn’t take the second test seriously. Maybe that’s why my score got lower by a band score of 0.5. But I am satisfied with both scores. (1차 시험때 원하던 점수가 나와서 2차때 부담없이 봤더니 0.5점 낮은 점수를 받게 되었습니다. 저는 두번의 시험에 모두 만족을 합니다.)
Participant #30:
I don’t really think that my recent score has significant changes compared to the first test, because I often did not attend my IELTS classes since my first IELTS result was pretty satisfying.
Participant #41:
I’m not satisfied with my second score. Maybe my score got lower because I took the test with my half-baked study manner. I thought I’d studied for three months, but as I studied more, I seemed to miss more details. (만족하지는 못했다. 오히려 어설프게 배우고 시험을 치계되어 더 점수가 낮아졌다. 나름 3개월 공부를 했는데 하면 할수록 모르는게 많아졌고 꿈꼼히 배운만큼 놓치는 것도 많아졌다.)
Participant #48:
My IELTS didn’t improve. Honestly, I should’ve studied more and surely wanted to. But I was working during the course so I didn’t have enough time to study outside of the class.
At the same time, some students actually improved by either +0.5 or +1 Global score band. In particular, six students improved a whole band score of +1 and they provided comments about their experience of studying IELTS for three months after they took the post-test. One of the common characteristics they mentioned was that they seemed to be more invested in time and the test preparation courses. In addition, they were all from beginner or intermediate levels of proficiency (with their first test scores around 4, 4.5, 5, 5.5 or 6); i.e., there might have been more room for them to improve. More details are discussed in the Results section for the second research question (RQ2) as this particular improvement appeared to be closely related to the hours of study that participants spent during the period of 12 weeks.
Participant #1:
I improved significantly through ‘L’. As my first test scores showed, I’d never studied English separately before. So, I didn’t know vocabularies and wasn’t familiar with English at all. Yet, after 12 weeks when comparing myself with the time before, I know more words in reading passages now and got to know what English would be like. Although my speaking and listening might be still weak, I improved so much that I could almost get the score of 6 for writing and reading sections. (렉시스 어학원을 다니는 12동안 저의 영어실력은 많이 향상되었습니다. 처음 시험을 봤을 때의 성적이 말하듯 저는 따로 영어공부를 해본 적이 없었습니다. 그래서 단어도 많이 몰랐고 영어와 전혀 친밀하지 않았습니다. 하지만 12주가 지난 지금 그 때에 비하면 reading을 비롯한 모든 분야에서 단어도 많이 알게되었고 영어가 어떤 것인지도 많이 배웠습니다. 비록 아직은 speaking, listening이 부족하다는 것을 많이 느끼지만 전에 비해서는 향상되었고 writing과 reading은 모의시험에서 6에 가까운 점수도 받는 등 확실히 실력이 향상되었습니다.)
Participant #21:
I’m confident my score has improved. I never missed a single class, and I spent a good amount of time doing for both preview and review along with my assignments.
Participant #57:
Definitely yes, I was able to study hard for three months without any problem or concern.
Participant #13:
My writing skill has improved definitely, but I’m not sure about my reading and speaking as I didn’t necessarily study for those skills. (라이팅은 분명 오를거같은데 리딩 리스닝 스피킹은 제가 따로 공부를 하지 않아서 잘 모르겠습니다.)
As seen from the subskill score gains above, the majority of the students (two-thirds of participants) mentioned that their writing skills seemed to have improved, but their speaking skill did not, or needed further improvement. This pattern is further discussed in the result section of the second research where participants spent significantly more time in studying the writing skill than other skills.
5.1.2 Linguistic changes in Speaking over three months
The linguistic patterns identified in this study are explained through frequencies and descriptive statistics. As explained above in Section 4.6.3: Statistical Analysis, speech variables have been reduced, whenever needed, for each of the four criteria (fluency and coherence, lexical resource, grammatical range and accuracy, and pronunciation) after checking the collinearity of the linguistic variable and the goodness of fit in the dimensionality of constructs of IELTS Speaking described through the rating scale and band descriptors. Table 5 illustrates the linguistic variables clustered to represent the final linguistic dimension for each rating criterion, as well as the original linguistic features measured before and after the variable reduction process.
As for Fluency, seven fluency features were originally extracted from Kang and Johnson’s (2018b) prosody model, but they were reduced down to three features. The following three speech rate related features (syllable per second, articulation rate, and mean length of run) were highly correlated (r>.76); therefore, all three were combined and created as a composite score. Because the two silent pause measures (r>.66) and the two filled pause measures (r>.62) were strongly correlated respectively, they were also clustered for each of the pause dimensions.
When it comes to Lexical Resource, four variables (type token ratio, K1, K2 and academic word list (AWL)) were analysed initially. Correlational analysis revealed that most of them were relatively independent with weak correlation coefficients (r < .285). The correlation between TTR and K1 showed a slightly high and negative coefficient (r = -.41). As a result, for final analysis, all lexical resource variables remained individually.
Grammatical Range and Accuracy consisted of four main variables: global accuracy (number of error-free C-units divided by total number of C-units); C-unit complexity (number of C-units divided by total number of clauses); verb phrase ratio (number of C-units divided by number of verb phrases); and dependent clause ratio (number of dependent clauses divided by total number of clauses), which were derived from five initial sub-features (number of C-units, number of error-free C-units, number of clauses, number of verb phrases, and number of dependent clauses). Because of the fact that the sub-features were used to generate the proportion of the main complexity and accuracy values for each feature, they were excluded for further analysis. The correlation between global accuracy and C-unit complexity was weak (r=.152) and therefore served as an independent variable respectively. However, C-unit complexity was highly and significantly correlated with verb phrase ratio (r=.94) and dependent clause ratio (r=.87). Accordingly, all three variables were merged into one grammatical complexity variable.
Pronunciation features included six criteria (rhythm, tone choice, pitch range, prominence, lexical stress, and segmentals). Each category remained as an independent variable with relatively low correlations (r < .38) as it represents a different phonological property. Some within-category features were collapsed as one variable when necessary. Space and pace were combined as one prominence variable due to their high correlation (r = .78). As for segmental features, high functional load vowels and consonants were clustered as one high functional load segmental variable and the same process applied to the low functional load segmentals.
On the other hand, tone choices were treated slightly differently. Even though they showed a relatively medium-strong collinearity (especially between rising and neutral, .18 < r < .62), all three tone choices were retained as independent variables for their autonomous discourse nature (Kang et al., 2010) and the purpose of enhancing interpretation of each sound phenomenon.
Table 5: Linguistic features used for analysis
| Rating criteria | Originally measured features | Clustered variables for final analysis |
|---|---|---|
| Fluency and coherence | Syllable per second Articulation rate Mean length of run Number of silent pause Length of silent pause Number of filled pause Length of filled pause | Speech rate Silent pause Filled pause |
| Lexical resource | Word type Word token Type token ratio (TTR) K1 (1000) frequent words K2 (2000) frequent words Academic word list (AWL) | TTR K1 words K2 words AWL |
| Grammatical range and accuracy | Number of C-units Number of error-free C-units Number of clauses Number of verb phrases Number of dependent clauses Global accuracy C-unit complexity Verb phrase ratio Dependent clause ratio | Global accuracy Grammatical complexity |
| Pronunciation | Rhythm Tone choice (rising, falling, level) Pitch range Prominence (pace and space) Lexical stress Segmentals: high functional (HF) consonant, low functional (LF) consonant, HF vowel, and LF vowel. | Prominence Lexical stress Segmentals (HF and LF) |
Changes of linguistic features were calculated by subtracting the result of Test 1 from the result of Test 2 for each linguistic variable from four different rating criteria. Descriptive statistics and linguistic construct changes are presented in Table 6 below. Columns 3-8 show the mean and standard deviation together with the maximum, minimum changes, and 95% confidence interval for the criteria of pronunciation and lexico-grammatical features. The individual long-run (Part 2) responses from the pre- and post-tests were analysed. The two right-hand columns indicate the significance level of the linguistic construct change computed by paired t-tests. These parametric tests do not provide relative significance by any means, but offer some general ideas about participants’ linguistic changes after the period of 12 weeks of learning.
Table 6: Descriptive statistics and linguistic construct changes
| Rating criteria | Linguistic variable | Mean | SD | 95% CI Lower | 95% CI Upper | t | p |
|---|---|---|---|---|---|---|---|
| Fluency/ coherence | Speech rate | -1.07 | 2.51 | -1.775 | -.372 | -3.07 | .003 |
| Fluency/ coherence | Silent pause | 2.96 | 7.71 | .811 | 5.104 | 2.767 | .008 |
| Fluency/ coherence | Filled pause | 6.84 | 5.611 | 5.28 | 8.404 | 8.794 | .000 |
| Lexical resource | TTR | .033 | .067 | .0142 | .051 | 3.525 | .001 |
| Lexical resource | K1 words | -12.02 | 23.96 | -18.69 | -5.34 | -3.62 | .001 |
| Lexical resource | K2 words | -.173 | 4.57 | -1.44 | 1.099 | -.273 | .786 |
| Lexical resource | AWL | -.250 | 2.23 | -.8734 | .373 | -.805 | .425 |
| G.range/ complexity | G.accuracy | 025 | .267 | -.049 | .099 | .680 | .500 |
| G.range/ complexity | G.complexity | .021 | .28 | -.056 | .099 | .549 | .586 |
| Pron. | Rhythm | -.238 | .55 | -.391 | -.085 | -3.125 | .003 |
| Pron. | Tone_rising | -.012 | .132 | -.048 | .024 | -.656 | .515 |
| Pron. | Tone_level | .047 | .177 | -.002 | .096 | 1.907 | .062 |
| Pron. | Tone_falling | -.029 | .125 | -.064 | .006 | -1.67 | .100 |
| Pron. | Pitch range | 1.072 | 37.95 | -9.494 | 11.63 | .204 | .839 |
| Pron. | Prominence | .244 | .505 | -.384 | .103 | 3.481 | .001 |
| Pron. | Lex.stress | -.173 | 1.248 | -.521 | .174 | -1.000 | .322 |
| Pron. | Segment_HF | .346 | 3.155 | -.53 | 1.22 | .791 | .433 |
| Pron. | Segment_LF | .346 | 2.33 | -.303 | .995 | 1.07 | .290 |
Note. G.range=grammatical range, pron.=pronunciation, lex.stress=lexical stress, segment_HF=segmental_high functional, segment_LF=segmental low functional
One of the most noticeable patterns is that all Fluency related features (speech rate, silent pauses, and filled pauses) made significant changes over the 12 weeks of the program. A negative t-value (t=-3.07, d = .50) of speech rate means that they spoke significantly faster at their post-test in comparison to their pre-test (12 weeks before) with a medium effect size. In contrast, the number and length of silent and filled pauses decreased significantly from their Time 1 performance with mean changes of 2.96 (d=.43) and 6.94 (d=7.68) respectively. In particular, the filled pause change with a very large effect size was especially noteworthy, because it meant that participants did not produce as many hesitation markers in their Time 2 performance as they did in their Time 1 performance. The improvement of these fluency features is indeed confirmed by Table 2 earlier. Although the score of the Speaking test did not improve statistically noticeably over the period of three months, there was a significant change made exclusively with the sub-rating criterion of Fluency and Coherence with a small effect size (p=.013 d=.28). These visible changes in the fluency markers led to higher sub-scale scores in participants’ speaking section in their Time 2 performance.
Two features from the category of Lexical Resource indicated significant changes, i.e., type token ratio (TTR) (p=.001, d=.65) and K1 words (p=.001, d=.47) with medium effect sizes. After 12 weeks of studying, the participants in the study demonstrated their ability of using more varieties of word-types along with the most frequent 1000 word families of English. However, these changes did not seem to have affected their actual speaking rating scores, as their gain score for the criterion of lexical resources did not change significantly from Time 1 to Time 2 (see Table 2).
There was no significant change on linguistic features in Grammatical Range and Accuracy. This was also the case with the actual Band score gains in Table 2, where the sub-scale of Grammatical Range and Accuracy showed no real change, with a mean score of -.02 change between Time 1 and Time 2.
In terms of changes in pronunciation, rhythm, prominence, and neutral tone choice features (somewhat weakly) stood out as variables with significant improvements after the 12-week period. Similar to the rating criterion of Grammatical Range and Accuracy, the sub-scale gains in the overall Band scores did not reveal any changes in pronunciation ratings before and after the 12-week lesson. The mean score change in sub-scale score shown in Table 2 was only -.02. However, the detailed phonological analysis results demonstrated that participants’ rhythmic pattern, measured by the stressed syllable length divided by unstressed syllable length, changed significantly (t=-3.125, p=.003, d=.63) with a medium effect size. Candidates were able to pronounce stressed syllables much longer than unstressed syllables in their Time 2 performance. Worth noting also is that the proportion of prominent words to the total number of words decreased significantly (t=3.481, p=.001, d=.65) with a medium effect size. After 12 weeks, students produced significantly fewer prominent syllables in their spoken responses. Finally, a neutral tone choice showed a near-significant level (p=.062) of changes with a small effect size of d=.227. A typical pattern of non-native speakers is over-using neutral or level tone, while native speakers tend to use more of falling or rising tone. Accordingly, even though this variable did not reach a significant level of change, it was a promising sign that students were starting to use less level tone, which will lead them to use more of the other tone choices.
5.2 RQ2: How do learner-related variables (i.e., hours of study, amount of target language use, and level of proficiency) correlate with the band score gains of IELTS tests?
5.2.1 Impact of primary factors (i.e., hours of study, amount of target language use, and level of proficiency) on IELTS
The primary learner-related background variables initially proposed by the project, which could predict IELTS overall band scores, included hours of study, amount of target language use, and level of proficiency. Table 7 describes how each of the three variables was operationalised in the study. Please refer to Appendix C for more detail. Table 8 illustrates descriptive statistics of those three background variables (i.e., hours of study, TL use, and proficiency).
Table 7: Primary factors affecting IELTS global band score gains
| Variables | Operationalisation |
|---|---|
| Hours of study | Compiled weekly survey (12 weeks) + post-survey responses. Each survey included: Consisted of 9 items regarding the hours spent for in-class and outside-of-class study: in-class program, homework, studying alone, studying with others, IELTS practice, & 4 skills practice each (reading/listening/speaking/writing) 11 options to choose for weekly hours spent: 1=0, 2=lesson than 1 hr, 3=1-2 hrs, 4=2-4 hrs, 5=4-6 hrs, 6=6-8 hrs, 7=8-10 hrs, 8=10-12 hrs, 9=12-14 hrs, 10=14-16 hrs, 11=more than 16 hrs Composite scores used |
| Amount of target language use (TLU) | Compiled weekly survey (12 weeks) + post-survey responses. Each survey included: Consisted of 11 items regarding English language contact and exposure: communicating with NS friends, with NNSs, with family, with people during online game, watching TV, movies, videos, listening to music, using the internet, social media, & reading in English 11 options to choose for weekly hours spent: 1=0, 2=lesson than 1 hr, 3=1-2 hrs, 4=2-4 hrs, 5=4-6 hrs, 6=6-8 hrs, 7=8-10 hrs, 8=10-12 hrs, 9=12-14 hrs, 10=14-16 hrs, 11 = more than 16 hrs Composite scores used |
| Level of proficiency | IELTS pre-test scores ranging from 4.0 to 7.5. (See Table 4 above). The initial recruitment started with ‘L’ Mock exam scores: 16 beginners, 17 intermediate, and 19 advanced learners. |
Table 8: Descriptive statistics of three background variables (i.e., hours of study, TL use, and proficiency)
| Variables | N | Minimum | Maximum | Mean | SD |
|---|---|---|---|---|---|
| Hours of study | 52 | 120 | 720 | 284.38 | 170.79 |
| Target language use (TLU) | 52 | 107 | 675 | 272.80 | 109.17 |
| Proficiency level | 52 | 4.0 | 7.5 | 5.70 | .88 |
The mean of participants’ hours of study is 284.38 over the period of 12 weeks.
This means on average, they spent approximately 23 hours a week studying English.
The person who spent the maximum of 720 hours actually achieved one whole band gain (+1) in the post-test. Overall comments from most of the participants, however, suggest that regardless of the actual amount of time they spent, they did not seem to be satisfied with what they had done. The following comments from Participants #1 (male) and #28 (female) provide a contextual background of their study experience.
Participant #1:
I spent 3-4 hours a day at the language institute. Then, I spent about one hour a day doing something extra by myself. Certainly, this is not enough. I think if I had studied more, my scores would have been better. I know if I spend a lot more time in English, I can improve it by feeling more comfortable. (하루에 3-4시간 정도 공부 했습니다. 그 외에 따로 공부한 시간은 하루에 평균 1시간 정도입니다. 저는 확실히 공부량이 적었습니다. 제 생각에는 더 열심히 했다면 더 좋은 영어실력을 가질 수 있었을 것 같습니다.일단 많은 시간을 영어와 함께 보낸다면 그 만큼 거부감도 없어지고 영어를 향상시키는데 좋다고 생각합니다.)
Participant #28:
I spent about 35-40 hours a week. But to prepare for IELTS, I should have spent more time. In order to master all four skills (Listening, Reading, Writing, Speaking), I think we should spend at least 70 hours a week. (일주일에 평균 35-40시간 정도를 영어공부에 사용했습니다. IELTS 시험을 준비하기 위해서는 좀 더 많은 시간을 더 공부에 씻어야 했다고 생각합니다. 4가지 항목(Listening, Reading, Writing, Speaking)을 단기간에 정복하기 위해서는 최소한 일주일에 70시간 정도의 시간을 필요로 한다고 생각합니다.
Target language use includes various types of language use and contact including social media or other entertaining activities (e.g., watching movies). According to the report of participants, they spent about an average of 273 hours during the 12 weeks’ period, i.e., roughly 22 hours a week. Comments below offer some examples about how students spent time in using English as a communication, entertainment, or study tool.
Participant #10:
I tried to expose myself as much as possible by singing English songs, watching English movies. Also, I enjoyed the MEET-UP opportunity offered by ‘L’ as I was able to chat with English speaking friends. (영어 노래, 외국 영화, 외국 컨텐츠 등으로 영어 노출을 최대한 많이 하려고 했으며, 특히 렡시스에서 제공하는 언어교환 믿업이 큰 도움이 되어 외국인 친구들과 채팅을 하며 영어를 쓸 기회를 많이 얻을 수 있었습니다).
Participant #25:
We are not in an English-speaking environment. Therefore, I tried to think in English by myself whenever I have time. On the weekends, I watched American or British movies without looking at subtitles. (영어를 자주 쓰는 환경이 아니라서 혼자 틈틈이 시간 날 때 내가 하고 싶은 말을 영어로 생각하는 연습을 했었고, 주말에는 미드나 영드를 보면서 자막없이 어느 정도 이해 할 수 있는지 테스트 해보곤 했습니다)
In order to answer the research question of how learner-related variables (i.e., hours of study, amount of target language use, and level of proficiency) correlate with the band score gains of IELTS tests, a series of linear regression analyses were performed. Participants’ responses for each of the three variables were regressed one-by-one against the outcome variable (the IELTS Global band gains) which was coded on a scale of 5 (from -1 to 1), with -1 indicating that the participant performed worse at the second round of testing than on the first occasion, 0 indicating that the participant performed at the same level and 0.5, and 1 indicating various degrees of improvement in Global scores. Next, in order to examine random and main effects separately, a linear mixed-effects analysis was computed by treating participant candidates as random effects, learner background variables as covariates, and the IELTS performance gains as a dependent variable.
Table 9: Summary of linear regression on three background variables
| Variables | Coefficient (B) | t | Sig. | Correlation | Adjusted R2 |
|---|---|---|---|---|---|
| Hours of study | .434 | 3.41 | .001 | .434 | .17 |
| Target language use (TLU) | .210 | 1.52 | .135 | .21 | .025 |
| Proficiency level | -.490 | -.3.973 | .000 | -.490 | .225 |
Hours of study was positively and statistically significantly linked to IELTS score gains with a moderate correlation of .434 withR²of .17. Hours of study alone explained 17% of the score gain variance in this linear model. Target language use (operationalised by language contact and use with persons and media) did not reveal any strong association with overall score gains (p > .135) with a very weak correlation. Only 2.5% of variance was explained by this variable. On the other hand, the proficiency level (measured by candidates’ Time 1 IELTS score) was the most potent predictor of the overall score gains (p=.000 andR²=.225), showing a negative relationship; i.e., as their proficiency increased, candidates’ mean gain scores significantly decreased as seen from the findings of RQ1 earlier.
The measured hours of study above included any types of study time related to English and IELTS. Accordingly, we examined skill-specific hours spent for studies of each of the subskills by the participants for the 12-week period and their relationships with the overall gain scores. Participants generally spent an average of 54.26 hours (SD=27.72) for speaking, 60.66 hours (SD=34.22) for listening, 57.18 hours (SD=) for reading, and 63.59 (SD=39.96) for writing. Figure 1 provides a graphic representation of the mean hours of study for each of the four skills.
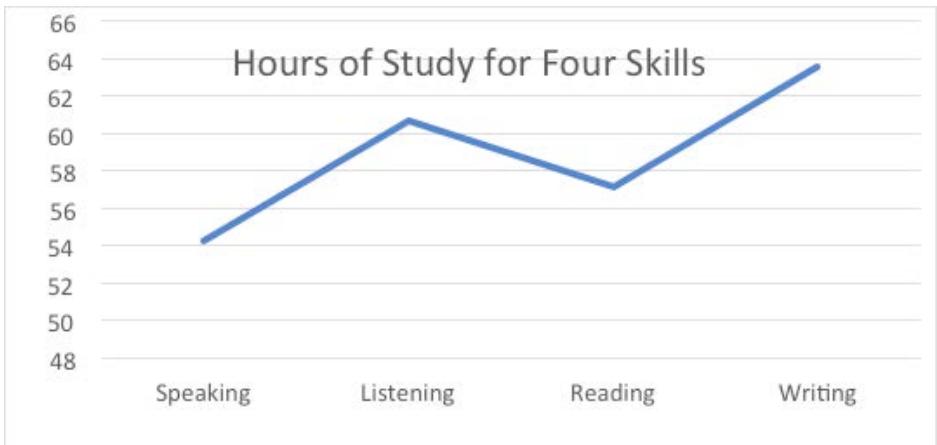
Figure 1: Mean hours of study for each of the four skills
As seen in Figure 1, participants showed a trend of spending more time in studying listening and writing skills in comparison to speaking and reading skills. This pattern explains the results shown in Tables 2 and 3 earlier regarding why the band score gain of the speaking section did not change significantly after the period of 12 weeks, while the band score gain of the writing skills increased most substantially (p=.000, d=.69). One possible speculation would be that the participants of the current project were inclined to study more for one skill than for other skills. A one-way repeated measure ANOVA, by treating the four skills as a within-subject variable, confirmed that the mean differences of the hours of study spent for each skill was statistically significant (Chi square=32.73, p=.000). According to results of the Post-Hoc analyses for six different comparisons, a significant difference emerged between speaking and writing skills (p=0.032, d=.27) with a small effect size. The difference between reading and writing skills can be noticeable, but it was not statistically significant (p=.062, d=.17) with a very small effect size. In general, the participants of the current project appeared to spend relatively more time studying writing skills than other skills, which could lead to more substantial Global band level gains in the writing section after 12 weeks of study.
The relationships of each subskill between participants’ hours of study and the overall band score gains were further investigated with a Pearson correlation (r) matrix below in Table 10. Given that participants spent more time particularly studying for the writing skill, there were significant correlational relationships between hours of study for writing and writing score gains along with listening score gains. The significant relationship between study hours for writing and listening score gains is somewhat unexpected, although the relationship seems to be relatively weak.
Table 10: Pearson r correlation for hours of study and score gains for each subskill
| Hours of study | Hours for Speaking | Hours for Listening | Hours for Reading | Hours for Writing |
|---|---|---|---|---|
| Score gains | Hours for Speaking | Hours for Listening | Hours for Reading | Hours for Writing |
| Speaking gain | .128 | .025 | .027 | .126 |
| Listening gain | .071 | .098 | .071 | .278* |
| Reading gain | -.026 | -.044 | -.019 | .150 |
| Writing gain | .141 | .181 | .170 | .308* |
Note. * indicate correlation is significant at the .05 level (2-tailed)
The target language use was measured through various sub-components in the weekly surveys over the 12-week period. The current study clustered all 11 sub-variables into one overarching category called ‘Target Language Use (TLU)’. As seen above, the contribution of this predictor to overall IELTS score gains was not significant. We undertook another approach by re-categorising the TLU variable into two groups: (1) social contact and use (e.g., meeting with friends), and (2) media contact (e.g., watching TV or social media). Still, linear regression results revealed no statistical significance: social contact and use (p=.448) and media contact (p=.836). Overall, TLU was not found to be associated with IELTS score gains, at least in this study where data collection was conducted in an EFL context.
One of the most compelling findings of the current study is the negative relationship between proficiency level and IELTS score gains (p=.000 and ). High-proficiency learners (i.e., band scores of 6 or higher) showed less improvement than low-proficiency participants (i.e., band scores of 4 or 5). Additional analyses were undertaken for gain scores of all four subskills to see if proficiency made a similar impact on their score gains. Table 11 verifies this trend that proficiency makes a significant contribution to each of all four skill gains with the same negative association.
Note that for the Global score gain, we used five-scale points from -1 to 1. However, for Reading we used eight-scale points from -1.5 (a negative gain of 1.5 band or more) through to +2 (a gain of 2 or more), whereas for Speaking we only used six-scale points from -1 (a negative gain of 1 or more bands) through to 1.5 (positive gain of 1.5 or more). For Listening and Writing, we used seven-scale points (from -1 to +2).
Table 11: Summary of regression of proficiency level on each subskill gain
| Variables | Coefficient (B) | t | Sig. | Correlation | Adjusted R2 |
|---|---|---|---|---|---|
| Speaking | -.286 | -2.110 | .04 | -.286 | .063 |
| Listening | -.309 | -2.296 | .026 | -.309 | .077 |
| Reading | -.342 | -2.576 | .013 | -.342 | .100 |
| Writing | -.331 | -2.476 | .017 | -.331 | .091 |
Findings so far suggest that the three selected learner-related variables are linked to the IELTS gain scores with a varying degree of association strength. However, they do not explain the relative contributions of each variable to overall improvement on the IELTS. In addition, they do not distinguish between effects related to participants and selected predictor variables. Accordingly, a mixed linear effects model was performed by treating candidates as random effects, learner background variables (e.g., hours of study, use of target language, and proficiency) as covariates, and the IELTS gain scores as a dependent variable. Using Nakagawa & Schielzeth’s (2013) suggestion, marginal R² and conditional R² were calculated to discuss the variance explained by the main (fixed) and random effects.
The LMEM design of the three learner-related factors against IELTS gains confirmed the earlier regression findings, indicating that proficiency was the most potent predictor followed by hours of study. Approximately 34% of the variances in IELTS Global band gains over the period of 12 weeks was collectively explained by the three predictor variables selected for this model (marginal and conditional ) and 67% of variance was accounted for by the main effect of background factors combined with the random effects of candidates. In other words, candidates themselves as random effects explained 33% of variance in this model, suggesting the variation of individual characteristics among participants must be considered in interpreting the results of the study. The LMEM estimates of main effects of the three background predictors are provided in Table 12.
Table 12: Estimates of main effects of three learner-relate variables on IELTS score gains
| Parameter | Estimate | SE | df | t | p | 95% CI LL | 95% CI UP |
|---|---|---|---|---|---|---|---|
| Intercept | 1.154 | .368 | 48 | 3.134 | .003 | .413 | 1.894 |
| Hours of study | .00076 | .0003 | 48 | 2.335 | .024 | .0001 | .0014 |
| Target language use (TLU) | .00041 | .0004 | 48 | .827 | .412 | -.0005 | .0014 |
| Proficiency level | -.208 | .0583 | 48 | -3.565 | .001 | -.325 | -.090 |
Note: CI = confidence interval; LL = lower limit; UL = upper limit
The results of the LMEM analysis reveal that the hours of study index was significantly related to the IELTS gains. The positive coefficient (Estimate = .00076, t = 2.335, p = .024) indicates that more study hours led to higher score gains in their overall band levels. Target language use did not show any statistically significant association in this model either. Again, the proficiency level as measured by their Time 1 IELTS score was negatively but statistically strongly associated with the overall IELTS performance.
5.2.2 Impact of other learner-related variables on IELTS
In addition to the three primary factors (i.e., hours of study, TLU, and proficiency), information about other types of learner-related variables was collected through a series of surveys (i.e., pre-survey, weekly surveys, and post-survey). These variables were extracted from questionnaire responses and explored as possible contributors to candidates’ improvement on the IELTS test. Some items (e.g., educational level, program attendance, or perceived progress in English) were adopted from Elder and O’Loughlin’s (2003) study, but other items were developed to specifically accommodate the current participants and (‘L’) IELTS courses in South Korea. Table 13 offers the list of 10 additional learner-related variables collected in the study.
Table 13: Additional variables identified as potential predictors of IELTS gains
| Variables | Operationalisation |
|---|---|
| Prior English study | Years of studying English since secondary school, including private tutor English courses Collected through pre-survey |
| Educational level | Level of education: 1 = final yr of secondary school, 2 = certificate/diploma, 3 = bachelor’s degree, 4 = postgrad certificate/diploma, 5 = master’s degree, 6 = PhD Collected through pre-survey |
| Prior study abroad experience | Length of living in English-speaking countries (months) Collected through pre-survey |
| Future degree plan | Degree plan in the future: 1 = certificate/diploma, 2 = bachelors, 3 = postgrad certificate/diploma, 4 = masters, 5 = PhD Averaged both pre- and post-survey responses |
| Desired IELTS score to meet academic goals | Desired IELTS score needed for degree programs or for personal goals: 1 = higher than 7, 2 = 7, 3 = 6.5, 4 = 6, 5 = 5.5, 6 = 5, 7 = I don’t know Averaged both pre- and post-survey responses |
| Program attendance (i.e., amount of instruction) | Attendance of the program: 1 = less than 1 hr/wk, 2 = 1-2 hrs/wk, 3 = 2-4 hrs/wk, 4 = 4-6 hrs/wk, 5 = 6-8 hrs/wk, 6 = 8-10 hrs/wk, 7 = 10-12 hrs/wk, 8 = 12-14 hrs/wk, 9 = 14-16 hrs/wk, 10 = more than 16 hrs/wk Averaged 12 weekly surveys + post-survey responses |
| ‘L’ mock exam scores | ‘L’ (the IELTS language program) weekly mock exam scores Averaged pre-survey + 12 weekly surveys + post-survey responses |
| *Perceived progress in English skills | Perception of progress in English skills and satisfaction of the course with 7 items combined Consisted of 4 items about how the course helped improve each of the four English skills (speaking, listening, reading, and writing) + 1 item about confidence + 2 items about satisfaction: 1 = strongly disagree, 2 = disagree, 3 = agree, 4 = strongly agree. Collected through post-test responses |
| *Perceived progress in IELTS | Perceived evaluation of how the program helped improve the IELTS test for each of the four skills (speaking, listening, reading, and writing): 1 = not at all, 2 = a little, 3 = a moderate amount, 4 = a lot. Collected through post-test responses |
| Instrumental motivation in studying IELTS | Four questions about different types of instrumental motivation expressed to study IELTS and determined by the presence of its IELTS-related study goals: (1) parental suggestion, (2) job-related, (3) further study related, (4) general test-score achievement Collected through pre-test responses |
Note. * indicates that these two variables will be combined as ‘Perceived Progress in English and IELTS’ for any further analysis due to its high collinearity between the two variables.
The grouping of variables within each category can be somewhat dubious in that a particular variable can be classified as another independent category in some cases. For example, Satisfaction with the Courses could be classified separately from Perceived Progress in English, but we have combined both of the traits into one variable.
As a part of the preliminary analyses, Pearson correlations were performed to examine the collinearity of the select variables. All variables except for *Perceived Progress in English Skills and *Perceived Progress in IELTS were weakly correlated among each other (r < .304) with no statistical significance; accordingly, each of them was regressed one-by-one against the dependent variable of Global score gains as computed before with the three primary factors above. However, *Perceived Progress in English Skills was significantly correlated with *Perceived Progress in IELTS (r = .618, p=.000).
Therefore, we combined these two variables into one predictor and labelled it as ‘Perceived Progress in English and IELTS’, which led to nine learner-related variables instead of 10 for further regression analysis.
Table 14 provides a summary of linear regression results on the nine background variables tested to examine if they make any significant (p = 0.05) or near significant difference or contribution to candidates’ probability of improving their global IELTS band score.
Table 14: Summary of linear regression of nine background variables on Global IELTS gains
| Variables | Coefficient (B) | t | Sig. | Correlation | Adjusted R2 |
|---|---|---|---|---|---|
| Prior English study | .193 | 1.389 | .171 | .193 | .018 |
| Educational level | -.038 | -.268 | .79 | -.038 | -.019 |
| Prior study abroad experience | -.009 | -.066 | .948 | -.009 | -.000 |
| Future degree plan | .006 | .041 | .968 | .006 | .000 |
| Desired IELTS score to meet academic goals | .070 | .449 | .655 | .070 | .001 |
| Program attendance | .328 | 2.409 | .020* | .328 | .089 |
| Mock exam scores | .261 | 1.915 | .061 | .261 | .05 |
| Perceived Progress in English and IELTS | .403 | 3.049 | .004* | .403 | .145 |
| Instrumental motivation | .354 | 2.679 | .010* | .354 | .108 |
None of the prior English study experience, educational level, or study abroad experience played a role in influencing the IELTS overall gains. Neither participants’ future degree plan, nor their desired IELTS score level contributed to overall score gains either. However, the degree of program attendance over the period of 12 weeks made a significant impact on the IELTS gains with p = .020 ( ). The more consistently students attended the class, the higher overall gains they achieved.
The ‘L’ language program offered IELTS simulated mock exams every week for students. The mock exam scores were noticeably linked to the actual IELTS overall gains (p = .061), but their correlation was relatively weak (r = .261). One estimate of a candidate’s chances of success on IELTS among the nine selected variables was through candidates’ perceived progress in English skills and IELTS (p = .004, R 2 = .145). This composite variable included questions about how much participants perceived the course to be helpful and satisfactory for their English improvement and IELTS score gains. The more satisfied participants felt with the course, the more improvement they were able to make. Finally, instrumental motivation measured by the presence or absence of four different goals also strongly predicted the IELTS overall gains; i.e., if candidates joined the IELTS study program with specific reasons, namely, parental suggestion, job employment, future study plan, or self-achievement, they were more instrumentally motivated and attained higher score gains. Note that this last motivation predictor result should be interpreted with caution. In the current study, motivation was not measured through traditional scalar instruments as seen in Dörnyei ‘s (2005, 2006) tri-partite motivation model with dichotomised ideal and ought-to L2 selves.
Similar to the primary three-variable analysis performed above, the mixed linear effects model (LMEM) was computed with candidates as random effects, nine learner-related background variables as covariates, and the IELTS gain scores as a dependent variable. Marginal R² and conditional R² were also calculated to discuss the variance explained by the main and random effects. The LMEM estimates of main effects of the background predictors are presented in Table 15.
Table 15: Estimates of main effects of nine variables on Global IELTS gains
| Parameter | Estimate | SE | df | t | p | 95% CI LL | 95% CI UP |
|---|---|---|---|---|---|---|---|
| Intercept | .0667 | .457 | 31 | .146 | .885 | -.867 | 1.001 |
| Prior English study | .0184 | .008 | 31 | 2.237 | .033* | .001 | .035 |
| Educational level | -.0507 | .047 | 31 | -1.060 | .298 | -.148 | .046 |
| Prior study abroad experience | -.0044 | .014 | 31 | -.312 | .757 | -.033 | .024 |
| Future degree plan | .0285 | .048 | 31 | .591 | .559 | -.069 | .126 |
| Desired IELTS score | -.0003 | .051 | 31 | -.006 | .995 | -.105 | .104 |
| Program attendance | .0171 | .019 | 31 | .880 | .386 | -.022 | .056 |
| Mock exam scores | -.0556 | .045 | 31 | -1.209 | .236 | -.149 | .038 |
| Perceived Progress in English and IELTS | .020 | .009 | 31 | 2.218 | .034* | .001 | .038 |
| Instrumental motivation | .194 | .087 | 31 | 2.228 | .033* | .372 | .016 |
Note: CI = confidence interval; LL = lower limit; UL = upper limit
The LMEM design of the remaining learner-related variables against IELTS overall gains provided somewhat similar but slightly different results from the series of linear regression outcomes seen earlier in the section. Perceived Progression in English and IELTS and Instrumental Motivation still remained as significant predictors of the IELTS gains (p= .034 and p=.033 respectively). However, Program Attendance and ‘L’ Mock Exam scores did not show any strong association with the actual progress variable any longer. What is interesting is that Prior English Study turned out to be a significant indicator of the IELTS score improvement (p=.033), which was not the case in the earlier linear regression analysis. The more prior English study experience candidates had, the higher gains they achieved during this 12-week program.
Approximately 26% of the variances in IELTS Global band gains over the period of 12 weeks was collectively explained by the nine predictor variables selected for this model (marginal and conditional ) and 64% of variance was accounted for by the main effects of background factors combined with the random effects of candidates. This means that candidates as random effects explained a large portion of the data, i.e., around 38% of variance in this model, suggesting the variation of participants played a particularly big role in interpreting the current results.
The same series of analyses were conducted for the four subskills on the IELTS in the event that particular variables might be more influential predictors of some skills than others. Those variables yielding significant t-test or near significant values when regressed one-by-one against the measure of each of the four-skill gains are presented in Table 16.
Table 16: Summary of linear regression of nine variables on each subskill gains
| Skills | Variables | Coefficient (B) | t | Sig. | Adjusted R2 |
|---|---|---|---|---|---|
| Speaking | Educational level | -.352 | -2.64 | .011 | .106 |
| Speaking | Perceived Progress in English and IELTS | .342 | 2.523 | .015 | .099 |
| Listening | Program attendance | .260 | 1.864 | .069 | .048 |
| Listening | Mock exam scores | .380 | 2.902 | .005 | .127 |
| Listening | Perceived Progress in English and IELTS | .468 | 3.673 | .001 | .203 |
| Reading | Desired IELTS score | .311 | 2.264 | .028 | .117 |
| Reading | Program attendance | .253 | 1.815 | .076 | .045 |
| Reading | Perceived Progress in English and IELTS | .311 | 2.264 | .028 | .078 |
| Reading | Instrumental motivation | .441 | 3.473 | .001 | .178 |
| Writing | Program attendance | .262 | 1.883 | .066 | .049 |
| Writing | Perceived Progress in English and IELTS | .433 | 3.325 | .002 | .170 |
Across the four skills, candidates’ perceived progress in their English or IELTS improvement remained as a significant predictor of skill gains over time. As was the case for Global gains, the more candidates believed that their English or IELTS scores improved, the higher gains they achieved for all skills after 12 weeks. Somewhat differently from the rest of the skill predictability, however, educational level was significantly linked to Speaking improvement, but with a negative association. This means that the less skilled and trained in Speaking students were at the onset of the program, the more dramatic their speaking improvement was. Program attendance also showed a strong association with Listening, Reading, and Writing improvements. Interestingly, there was a significant, positive association between Desired IELTS score to meet candidates’ academic goals and reading gains; namely, the higher scores candidates’ future degree programs required, the more gains they demonstrated, at least in Reading. Mock exams provided by the ‘L’ program showed some effects (near significant with p=.061) on Global IELTS gain; similarly, their relationship with Listening was significant with a positive directionality. Students’ weekly exam practices seemed to have some link with the actual progress. Finally, as seen in the Global gains, the instrumental motivation measured by the presence and absence of candidates’ motivational background (e.g., personal goal, job, or degree) to take the IELTS was positively and significantly linked to score gains, but only to Reading.
As the last step of the analysis for the relative impact of all nine background variables on each of the four skills, four different sets of the LMEM were performed with all of the factors included. The background factors were entered into the model as covariates, participants as random effects, and each of the subskills as a dependent variable. Table 17 presents a summary of estimates of main effects of nine variables on each skill with only significant (or near significant) variables and marginal R² and conditional R² for variance explained by each of the four models.
Table 17: Summary of estimates of main effects of nine variables on four subskills with marginal R² and conditional R²
| Skill | Parameters | Est’t | SE | t | p | R² | |
|---|---|---|---|---|---|---|---|
| Skill | Parameters | Est’t | SE | t | p | Marg’l | Cond’l |
| Speaking | .26 | .52 | |||||
| Intercept | .361 | .783 | .461 | .648 | |||
| Perceived Progress in English and IELTS | .037 | .015 | 2.399 | .023 | |||
| Listening | |||||||
| Intercept | -.133 | .712 | -.188 | .852 | .28 | .57 | |
| Mock exam scores | -.139 | .071 | 1.946 | .061 | |||
| Perceived Progress in English and IELTS | .031 | .014 | 2.227 | .033 | |||
| Reading | |||||||
| Intercept | -1.18 | 1.01 | -1.179 | .247 | .25 | .51 | |
| Desired IELTS score | .218 | .113 | 1.926 | .063 | |||
| Writing | |||||||
| Intercept | -1.01 | .953 | -1.055 | .300 | .27 | .58 | |
| Perceived Progress in English and IELTS | .038 | .018 | 2.040 | .050 |
Results were somewhat similar to the one-to-one regression models presented earlier. Overall, Perceived Progress in English and IELTS seemed to be the most consistent and influential factor in most of the skills gains except for Reading. As for Listening, the ‘L’ school’s mock exam scores were still positively related to its overall gain, although its effect was somewhat marginal (p = .061). Reading improvement still linked to candidates’ desired IELTS scores to meet their academic goals. As students’ future programs require higher IELTS scores, they tend to have more gains in such scores. This phenomenon can be explained by comments provided by Participants #30 and #33 in Section 5.1.1 where candidates’ scores did not improve at Time 2 once their Time 1 test scores met their expectation. Overall, the high values of conditional R² suggest that approximately 30% of the variance in all models seems to be explained by random effects, i.e., the participant variance accounts for a large portion of the variance.
5.3 RQ3: How do learner-related variables (i.e., hours of study, amount of L2 use, and level of proficiency) correlate with the linguistic progression of IELTS speaking?
The three primary learner-related background variables analysed in Table 8 earlier included hours of study, amount of L2 use, and level of proficiency. In order to investigate how these learner-related variables are associated with each of the linguistic construct changes, a series of multiple regression analyses were performed with the learner background variables as predictors and each of the linguistic variables as dependent variables. Again, the following features are linguistic variables analysed for the current project: Fluency and Coherence (speech rate, silent pause, and filled pause), Lexical Resource (TTR, K1 words, K2 words, and AWL), Grammatical Range and Accuracy (grammatical accuracy and grammatical complexity), and Pronunciation (rhythm, tone choice, pitch range, prominence, lexical stress, and segmental errors).
For RQ3, we purposely did not run the LMEM analysis because both LMEM-based and multiple regression-based statistical models offered similar results for relative contribution of predictors to each of the linguistic changes. Changes of linguistic features were calculated by subtracting the result of Test 1 from the result of Test 2 for each linguistic variable from four different rating criteria. Furthermore, instead of running separate regression analyses for the nine supplementary learner-background variables introduced in Section 5.2.2, bivariate correlational analyses were conducted, and only variables that demonstrated significant relationships are reported in Table 19 below. Multiple regression models for the additional predictor variables were avoided intentionally due to the complexity of multiple models, i.e., 18 dependent variable X 9 predictors.
Table 18 illustrates a summary of multiple regression results of the three background factors on each of the linguistic features that generated significant (or near significant) associations with predictors. One of the most conspicuous patterns shown in Table 18 is proficiency and its relationship with various linguistic features. Proficiency was potently associated with all of the fluency feature changes along with some of the prosody features. That is, as proficiency increased, changes of speech rate were faster (t=2.151, p=.037), and both silent (t=-2.153, p=.036) and filled pause changes (t=-2.389, p=.021) became shorter. Together with hours of study and target language contact, these background variables explained approximately 9-15% of the variance in the linguistic changes of the model.
Table 18: Summary of multiple regression of background factors on linguistic features
| Linguistic features | Predictors | Coefficient (B) | t | Sig. | Adjusted R2 |
|---|---|---|---|---|---|
| Speech rate | .12 | ||||
| Proficiency | .292 | 2.151 | .037 | ||
| Silent pause | .092 | ||||
| Proficiency | -.297 | -2.153 | .036 | ||
| Filled pause | .151 | ||||
| Proficiency | -.318 | -2.389 | .021 | ||
| Target language use | -.313 | -2.228 | .031 | ||
| AWL | .033 | ||||
| Hours of study | .302 | 1.964 | .055 | ||
| Grammatical complexity | .086 | ||||
| Proficiency | -.376 | -2.718 | .009 | ||
| Rhythm | .064 | ||||
| Proficiency | .326 | 2.332 | .024 | ||
| Rising tone | .058 | ||||
| Proficiency | .250 | 1.783 | .081 | ||
| Falling tone | .087 | ||||
| Target language use | .338 | 2.325 | .024 | ||
| Level tone | .086 | ||||
| Proficiency | -.314 | -2.275 | .027 | ||
| Prominence | .089 | ||||
| Target language use | -.281 | -1.935 | .059 | ||
| Pitch range | .124 | ||||
| Proficiency | -.395 | -2.921 | .005 | ||
| Lexical stress | .119 | ||||
| Proficiency | -.372 | -2.740 | .009 | ||
| Segmental_HF | .043 | ||||
| Target language use | -.262 | -1.999 | .051 |
Proficiency was also a strong predictor of rhythm, rising and level tone, pitch range, and lexical stress changes. Each of the model coefficients and t-test values indicate that proficiency is positively linked to changes of rhythm (t=2.332, p=.024) and rising tone choice (t=1.783, p=.081), while it is negatively connected to level tone choice (t=-2.275, p=.027), pitch range (t=-2.921, p=.005), and lexical stress error changes (t=-2.740, p=.009). Note that rising tone did not meet the critical alpha level (=.05), although its significance was near to the level. Such findings suggest that as proficiency increased, the average length of stressed syllables became longer and the use of rising tone also increased. At the same time, proficiency predicted another change pattern in that participants used fewer level tone choices and made fewer lexical stress errors as proficiency moved up. In addition, the changes of pitch range become more restricted as proficiency went up. The variance explained by these predictors combined with the other background variables (hours of study and target language use) ranged from approximately 6% to 12%. Proficiency also showed a significant relationship with Grammatical complexity (t=-2.718, p=.009). Grammatical complexity was measured as a composite value of C-unit complexity, verb phrase ratio, and dependent clause ratio. The negative relationship indicates that as proficiency increased, changes in the amount of grammatical complexity and range indicators reduced. In other words, while lower-proficiency level participants tried to create more complex sentences and generated more changes in 12 weeks, upper-level students did not show much difference after the three-month learning, possibly because they were already able to create complex sentences.
Target language use (measured by language contact and use with persons and media) demonstrated strong associations with changes in filled pauses, falling tones, and high functional segmental errors. Collectively with proficiency and hours of study, target language use explained up to 15% of variance in filled pause changes. The negative coefficient and t-value (t=-2.228, p=.031) indicates that the more target language a candidate used (e.g., communicating with friends, watching movies, or doing social media), the fewer and shorter hesitation markers they produced. Target language use also affected the use of falling tone. Participants’ amount of target language contact and use was positively linked to this intonation pattern change (t=2.325, p=.024). It means that as students used more English in their daily life, they used more falling tone. Finally, target language use showed a significant but negative relationship with segmental errors particularly related to high functional load deviations (t=-1.999, p=.051). The significance level is just above the critical point of .05, but it showed a promising sign that the amount of target language use can bring some changes at the segmental level.
Unfortunately, hours of study was not necessarily linked to any changes of the linguistic properties other than AWL (academic word list). The significance level was relatively weak (t=1.964, p=.055). However, this finding implies that hours of study could be directly related to the use of AWL items, which could connect to the evaluation category of lexical resource.
Table 19 presents summary results of bivariate correlations of nine additional background variables and each of the linguistic features. The variables that demonstrated significant relationships are illustrated below. Basically, the relationships between nine additional learner-related background variables and speech features were generally weak (r < .24). As seen below, only three correlations came out to be significant, but still their coefficient values were rather minimal. Overall, given that the speaking section scores did not improve significantly after the three months of study in this project, learners’ additional background factors did not seem to be highly correlated with their actual speech performances and property changes.
Table 19: Summary correlations between nine background variables and linguistic features
| P.stdy | Ed.levl | SA | F.d.p | IELTS | Attd | Mock | Prcd | Motv | |
|---|---|---|---|---|---|---|---|---|---|
| S.rate | |||||||||
| Pause | |||||||||
| F.pase | |||||||||
| TTR | |||||||||
| K1 | |||||||||
| K2 | |||||||||
| AWL | |||||||||
| Accry | |||||||||
| Cmplx | |||||||||
| Rhythm | .386** | ||||||||
| Rising | |||||||||
| Level | |||||||||
| Falling | .284* | .289* | |||||||
| Range | |||||||||
| Promce | |||||||||
| L.strss | |||||||||
| HF_seg | |||||||||
| LF_seg |
Note. Pstdy=Prior English study, Ed.levl=Educational level, SA=Prior study abroad experience, F.d.p=Future degree plan, IELTS=Desired IELTS score to meet academic goals, Attd=Program attendance, Mock=Mock exam scores, Prcd=Perceived Progress in English and IELTS, and Motv=Instrumental motivation **= significant at the 0.01 level; * = significant at the 0.05 level
6. Discussion
The project aimed to investigate learners’ IELTS score gains along with their linguistic construct changes over a period of 12 weeks in an EFL context. In addition, the project explored how learner background variables (e.g., hours of study invested, amount of target language use, level of proficiency, and some others) affected their band score gains on the IELTS and their linguistic development. Before discussion, however, it should be noted that language learning is a complex process and may not always be predictable in a linear fashion (Larsen-Freeman, 1997, 2012). In addition, all findings in this study should be interpreted in a context-specific manner, i.e., participants in the current study were all enrolled in IELTS test preparation classes at a language institution in South Korea, and they all took 4-week, 8-week or 12-week IELTS preparation courses, depending on their schedule.
6.1 Changes of IELTS test performances: Test scores and linguistic constructs
The results of the study showed that the band score changes were statistically significant over the three-month period with small-medium effect sizes. Particularly, the gains of the Global band and subskills (reading, listening, and writing) were significant, but the speaking score did not change substantially. Only the change of the sub-rating criterion of Fluency and Coherence (p = .013, d = .28) was statistically significant with a small-medium effect size. Given that the speaking skill is known to be one of the lowest subskills among Korean learners of English (IELTS Research, 2020) this slow score gain in speaking might not be a surprising result. The average overall gain was slightly less than half a band (.3) overall in this project.
This is somewhat lower than that of a previous study (e.g., Elder & O’Loughlin, 2003) in which students made progress in English during the three-month period with an average gain of about half a band (.5) overall. It would appear from the analysis that the 12 weeks of intensive study might not make a huge difference to performance particularly in an EFL context although its change was still statistically significant with a small effect size.
What is also important to note is that the mean gain score on Test 2 decreased as the students’ proficiency increased. In fact, the gain scores at the lower band levels (4.5, 5 and 5.5) were much higher than those at the higher proficiency level. A few students at the high band levels performed even worse on Test 2 than on Test 1. This phenomenon parallels with findings from previous research (Benigno et al., 2017; Elder & O’Loughlin, 2003) where score gains did not happen much at the higher levels of proficiency. Scholars (e.g., Gass & Selinker, 2001) have also argued that learning peaks could usually happen at the beginning of the learning process, but warned that learning gains might not emerge simply because of intensive learning over time. Benigno et al. (2017) also asserted that learners could take much longer to move from upper levels than move from lower levels. These studies indicated some type of temporary regression in the longitudinal process and the current finding seems to have followed such a pattern to a certain extent.
Other possible reasons why the upper-level learners gained more slowly than the lower-level learners could include: (1) participants’ idiosyncratic performance caused by their individual differences (e.g., anxiety or personal needs) or circumstantial challenges (e.g., work commitments); (2) a difference in test item difficulty of one version compared to another (Elder & O’Loughlin, 2003); or (3) discrepancies in the scoring process, if any. In Section 5.1.1, Participant #3’s comment made a case in point: “My IELTS score didn’t improve during the given 12 weeks. It’s because during the given 12 weeks, I had to figure out individual problems”. Some learners had personal issues, which could be completely irrelevant to test score issues. Accordingly, some of the learning patterns should not be over-generalised, but interpretations should be made in an individualised and learner-specific manner.
The greatest gain of subskill scores was from the writing skill, with the maximum gain of a band score +2 and a minimum of -1 with a medium-large effect size. No significant improvement was found in the speaking skill. Participants’ comments added further contextual information in that the majority of the students (two-thirds of the participants) mentioned that their writing skills seemed to have improved, but their speaking skills did not or needed further improvement. Figure 1 confirmed this pattern that the participants of the current project were inclined to study more writing than other skills. Repeated measure ANOVA results showed that the participants spent significantly more time studying writing skills than other skills (i.e., speaking in particular), which could lead to more substantial Global band level gains in the writing section after 12 weeks of study. Not surprisingly, there was a significant correlational relationship between hours of study for writing and writing score gains (shown in Table 10).
When it comes to speech construct changes, because speaking skills did not improve significantly over the period of 12 weeks of learning, not all speech features necessarily yielded changes in their patterns. At least, all fluency-related features improved significantly which was also confirmed by the official IELTS’ sub-score report where the sub-rating category of fluency and coherence indicated a significant improvement before and after the 12-week study. Unlike other controversial findings on pronunciation features, fluency seems to be a construct that consistently shows at a minimum some improvements over time (Derwing et al., 2006; Derwing et al., 2008), including in study abroad contexts (Segalowitz & Freed, 2004).
In the current study, fluency features measured by speech rate, silent pauses, and filled pauses improved significantly with large effect sizes. The filled pauses had a particularly large effect size (d=7.68), which means that students made drastically fewer hesitation markers in their Time 2 performance than in their Time 1 performance.
Some lexical features (type token ratio and the use of the most frequent 1000 words) indicated positive changes, but there were no changes for the measures of grammatical complexity and accuracy over time. These findings are not too unexpected, given that much research on vocabulary acquisition has found that vocabulary gains happen over time (e.g., Milton & Meara, 1995) but grammatical accuracy and complexity features have not been found to improve in significant ways over a relatively short period of time (Freed, 1998; Coleman, 1997). Additionally, this no-change pattern was confirmed by the fact that neither the actual speaking band score, nor the criterion scores of lexical resources or grammatical range and accuracy revealed any significant changes over the three-month period. Perhaps three months was not sufficient to bring about any grammatical changes.
The fact that learners in this study did not have any substantial changes in their speaking skill over the 12-week period also led to limited gains in their pronunciation features. Only rhythm, tone choice, and prominence features showed improvements after the three months of study. In general, it is known that pronunciation gains are limited to certain contexts or to certain features (Derwing et al., 2008). Nevertheless, the improvement of prominence (i.e., sentence stress) is particularly noteworthy. That is, students produced significantly fewer prominent syllables in their spoken responses of Time 2 than their Time 1. In Kang and Kermad’s (2020) recent study, which analysed speech responses of 75 ESL students in an intensive English program, prominence was the only variable that showed a significant improvement over a semester time period. In fact, low-proficiency speakers tended to give relatively equal pitch to each word regardless of its role in the discourse structure (Kang, 2010; Pickering, 2001). The current finding sheds light on what type of stress feature can be learnable over the period of two to three months.
Students’ rhythmic pattern, measured by the stressed syllable length divided by unstressed syllable length, changed significantly with a medium effect size. Such a stress-time language pattern is a big improvement for Korean learners of English whose first language is a syllable-time language in which each syllable tends to be pronounced with relatively equal length. Finally, a neutral tone choice showed a near-significant level of change; i.e., students started to use fewer level tones, which led them to use more of the other tone choices. As Levis (2005) discusses, not all pronunciation features are learnable, but some of these features in this study showed a sign of acquisition without explicit pronunciation instruction.
6.2 Relationships between learner background variables and the IELTS band score gains
Approximately 34% of the variances in the IELTS Global band gains over the period of 12 weeks was collectively explained by the three primary predictor variables selected for this model, i.e., hours of study, target language use, and level of proficiency. At the same time, over 33% of variance in this model was explained by candidates themselves as random effects, suggesting that an individual variation among participants should be considered when we interpret the findings of the study. Such a pattern of high participant variability seems to be not uncommon in L2 speech research, especially when examining the relationship between speech ratings and learner backgrounds (Hirschi et al., 2020).
As expected, hours of study predicted IELTS score gains positively and statistically significantly. The predictor explained 17% of the score gain variance in this linear model. Participants in the current project seemed to have spent more time in studying listening and writing skills in comparison to speaking and reading skills, which resulted in different score gains in each skill. Particularly, their writing score improved significantly over the 12-week period. However, participants’ overall comments hinted that they were not content with what they had done, regardless of the actual amount of time they spent. Some students suggested spending 70 hours a week in order to see an improvement in the IELTS test. On average, the participants in this study appeared to have spent about 284 hours over the period of three months. The person who spent the maximum of 720 hours was one of the students who gained the highest score (+1 band score gain). According to an exploratory study (Benigno et al., 2017), the estimated hours of study for fast learners to enter the B2 CEFR level without any specific time-period was around 760 hours, which is similar to the time spent by some of the current participants. Note that these learning hours were active, i.e., explicitly devoted to language learning through instruction and exercises. Certainly, the success of the language learning experience can be influenced by a language learning context (Ellis, 2006), and this can be particularly true if learning happens just through instruction, not in an immersion context. This finding suggests that a language proficiency gain does require an invested time commitment, possibly more than one often thinks.
With regard to target language use, it was somewhat surprising that self-reported target language use and language contact were not associated with enhanced performance among this group of participants. Target language use was operationalised by language contact and use with persons and other social media and resources. It consisted of 11 sub-components collected through weekly surveys over 12 weeks. We further examined the relationships between sub-categorised variables (i.e., interactive contact, media exposure, or use of social media) and the score gains, but none of those variables predicted the IELTS performance gain. According to Elder and O’Loughlin (2003), media exposure or language contact on its own may not be sufficient to bring about measurable improvement within such a limited time frame. Quality of interaction can also be more important than quantity. Even though learners’ exposure to the target language can be a critical factor in determining their success (Celce-Murcia et al., 2010), especially in EFL settings where students have little opportunity to surround themselves with native input in the target language, language learning can be a considerably more complicated process, and more research is needed on this topic.
As seen earlier in RQ1, the proficiency level as measured by their Time 1 IELTS score was negatively but statistically strongly associated with the IELTS overall performance. The proficiency one starts with seems to be the most constant indicator of how far one can improve over the course of a 12-week period of study. This finding implies that even though score gains are somewhat unpredictable, they are more likely to happen at the lower levels of proficiency. In addition, this also brings an important practical recommendation that information about individual students’ proficiency might need to be collected before any institutional programs start in an EFL context, and each student should be advised about their changes and expectations of improving their English, if needed. Overall, even though the target language use did not contribute much to the IELTS overall gains, the other two primary background factors (i.e., hours of study and level of proficiency) emerged as important variables to consider when trying to understand students’ learning progress over time.
Amongst nine other supplementary background variables, the degree of program attendance over the period of 12 weeks made a significant impact on the IELTS gains, particularly showing a strong association with Listening, Reading, and Writing improvements. The more consistently students attended the class, the higher overall gains they achieved. This is an encouraging finding for various IELTS training programs because it implies those courses built around IELTS practice materials seem to work and increase the likelihood of improvement overall. This finding could have turned out differently if the study had been conducted in an ESL immersion context (Elder & O’Loughlin, 2003) where students could expose themselves to their target language in various modes and manners. However, in an EFL context, in particular, where students might have limited access to English resources and practice, institutionally prepared courses could bring them to more efficient learning. On a related note, institutionally-administered mock exam scores and participants’ prior English study experience measured by an institution were also noticeably linked to the actual IELTS overall gains. Students’ weekly exam practices and some of their previous skills also seemed to have some link (but not strongly) with the actual progress.
Finally, participants’ attitudinal and motivational factors played a role in their score gain process. In fact, these affective elements have often been considered as important factors in explaining the development of oral skills (Moyer, 1999). Students’ own perceived progress in English skills and IELTS was strongly associated with their score gains on IELTS. It is possible that this self-report could be just the result of an increase in proficiency instead of the reason for the improvement. However, this perceived progress was measured via questions about how much students found the IELTS preparation courses helpful and satisfactory for their English improvement and IELTS score gains. The more satisfied participants felt with the course and their study, the more improvement they were able to make. The candidates’ perceived progress in their English or IELTS improvement remained as a significant predictor of all four skill gains over the three-month period of time.
Relatedly, instrumental motivation measured by the presence or absence of four different goals (i.e., parental suggestion, job employment, future study plan, or self-achievement) to study IELTS also strongly predicted the IELTS overall gains. Furthermore, there was a significant, positive relationship between desired IELTS score and reading gains. Instrumental motivation often makes a student learn a language to attain a particular goal or to accomplish a task. Although research often claims that students who have integrative motivation tend to be more successful than those with instrumental motivation (Gardner, 1985), the presence of motivation itself, i.e., having reasons to study IELTS in this study, seemed to still have made a difference to students’ overall performance. Perhaps, this motivation might be the very reason why Participant #33 in Section 5.1.1, one of the five advanced-proficiency students who performed worse on Test 2 than on Test 1, did not improve his/her testing score. As indicated from the comment, “Because I got the score I wanted at the first testing session, I didn’t take the second test seriously… But I am satisfied with both scores”, this participant did not have this instrumental motivation to improve the IELTS score as he or she was already content with the current performance. One caveat for this finding is that the current study did not measure the language learning motivation or attitudes in a traditional manner (e.g., Dörnyei, 2005, 2006); accordingly, the interpretation of the results should be limited to this particular context and with care. Further research is needed on this topic with research instruments that include more elaborated motivation and attitude scales.
6.3 Relationship between learner-related variables and the linguistic progression of IELTS speaking
The last research question examined to what extent the learner-related background variables (hours of study, amount of L2 use, and level of proficiency) predicted the linguistic construct changes in IELTS Speaking. Based on the IELTS Speaking Band descriptors, criterion-specific features were selected for each of the four rating dimensions: Fluency and Coherence, Lexical Resource, Grammatical Range and Accuracy, and Pronunciation.
One of the most compelling patterns was how proficiency was linked to various linguistic features. Proficiency was potently associated with all of the fluency feature changes along with some of the prosody features. As seen from the findings of RQ2, all fluency features measured in the study changed significantly from the Time 1 performance to the Time 2 performance. Then, learners’ proficiency levels were strongly connected to these changes; i.e., as proficiency increased, speech rate went faster, and both silent and filled pauses became shorter. Proficiency was also a strong predictor of rhythm, rising and level tone, pitch range, and lexical stress changes. That is, as proficiency increased, the average length of stressed syllable became longer and the use of rising tone also went up. In addition, higher-proficiency learners showed a pattern of making fewer level tone choices and fewer lexical stress errors than the lower-proficiency learners. These results concur with the findings of previous studies (Kang & Moran, 2014; Kang & Yan, 2018), in which advanced learners produced fewer stress-related errors, and level tones were negatively associated with proficiency. In addition, the changes of pitch range become more restricted as proficiency moved up. Pitch range is a good indicator of learners’ proficiency, and beginner-level learners are often known to have a very narrow pitch range compared with advanced-level learners (Kang, 2010). In this study, however, changes of pitch range itself over the three-month period showed the opposite direction. One thing to note is that the actual phonological changes over the 12-week period in RQ1 occurred only to rhythm and prominence. Nevertheless, learners’ proficiency level measured as Time 1 IELTS test scores was able to predict the developmental patterns of pronunciation properties somewhat more extensively.
Proficiency also predicted the changes in Grammatical complexity. Grammatical complexity was measured as a composite value of C-unit complexity, verb phrase ratio, and dependent clause ratio, which reflected the complexity of utterances at both levels of clause relations and within-sentence sophistication (e.g., Brown et al., 2005). The negative relationship indicates that as proficiency increased, changes in the amount of grammatical complexity and range indicators reduced, probably because advanced learners might have had that ability of creating complex sentences even before the 12-week program.
Target language use was strongly associated with changes of filled pause, falling tone, and high functional load-based segmental errors. As learners used more target language by communicating with friends, watching movies, reading books, and doing social media, they produced fewer and shorter hesitation markers. It can be speculated that learners’ frequent use of English could make them comfortable and resulted in this improvement of fluency which is often found in language study abroad literature (e.g., Freed, Dewey, Segalowitz, & Halter, 2004; Segalowitz & Freed, 2004). Target language use also helped learners improve their intonation pattern, i.e., more use of falling tones. As students used more English in their daily life, they used more falling tones, which is a typical pattern seen in native speakers of English (Kang, 2010; Pickering, 2001).
Finally, target language use showed a significant but negative relationship with the frequency of segmental errors especially for the high functional load ones. In fact, this improvement is a promising sign because pronunciation gains over time, particularly related to vowels and consonants, have been found to be a slow or unchanging process (Kang & Kermad, 2020).
Interestingly, even though hours of study was one of the most potent predictors of the overall IELTS gain, it was not necessarily linked to any changes of the linguistic properties other than AWL (academic word list) word use. Although the significance level was somewhat weak, it can be implied that hours of study is directly related to the use of academic words. This finding also suggests that language learning does not follow a straightforward linear path as mentioned earlier, but it is a complex process (Larsen-Freeman, 1997, 2012). Learners’ learning journey is unique and unpredictable. At times, ongoing practice may not lead to improvement in performance due to some restructuring processes (McLaughlin, 1990). More refined and specified methods that can elicit learners’ varying behaviours and patterns can be developed to better understand these learning phenomena.
7. Conclusion and implications
Through this project, we have attempted to expand our understanding of language learning and progress by trying to answer such questions as: (1) how much learning gains can happen over time; (2) what factors can contribute to those gains; and (3) what types of changes can actually occur over the 12-week period. However, predicting a language learning pattern is indeed not a simple process, as it can involve various unforeseen factors affected by individuals’ personal, social, and environmental situations. Undoubtedly, the variables examined in this study are limited in scope and length. Some developmental aspects of SLA may need to be examined over much longer periods of time than others (Ortega, 2005). In this respect, the timeframe of the study is arguably too short to see any significant improvement. Moreover, the speech data samples analysed in this study might have been from a limited context (i.e. assessment stimuli); other contexts such as classroom discourse could lead to more rounded conclusions. Finally, even though we used IELTS score gains as an indicator of improving language ability in this study, it may not necessarily mean evidence of a real gain in language proficiency. Despite these limitations, there are useful implications that can be drawn from the findings of this study.
First, an intensive 12-week course of study in an EFL context may not bring substantial changes in IELTS band scores particularly if learners already hold a high level of proficiency. Especially, advanced learners of English might need to be informed of the fact that score gains might be a bit slower at the upper levels than at the lower levels. Low-proficiency learners, however, may bring about measurable improvement in their overall score. This improvement can also provide the lower-proficiency learners with genuine motivation which can affect their general attitudes towards study. One of the most important patterns of linguistic changes was also how strongly proficiency was linked to various linguistic features. Learners’ proficiency level measured at the beginning of the program (Time 1 in this study) was able to predict the developmental patterns of various linguistic properties quite extensively. As a result, language programs and institutions should always consider offering diagnostic tests to assess students’ initial proficiency levels before they start the program, and offer level specific learning objectives and outcomes.
Second, those who achieved significant gains seemed to have invested a considerable amount of time in their study, by attending the courses faithfully and studying outside of the school. Knowing that hours of study and the score gains are directly and significantly related, students should be advised to set a realistic goal and expectation with their commitment and time, if they want to have a meaningful gain at the end. This direct relationship was a bit nebulous with speaking skills, but it was clearly linked to writing and listening skills. Given that the degree of program attendance made a significant impact on the IELTS gains, especially in an EFL context, teachers and institutions can emphasise the importance of taking part in courses and studying additionally both inside and outside of the classroom, as it might be one of the most efficient ways of improving their test scores.
Third, test-takers can be informed that with regard to speaking skills, fluency can improve somewhat more quickly than other subskills. The noticeable changes happened both through IELTS’ rating scores and speech analysis results. Other speaking-related features are generally somewhat difficult to change in a short period of time, particularly related to vowel and consonant errors or even grammatical errors and complexity. It could be useful for test-takers to know what features were likely to improve more easily than others, if they were to invest their time into any programs.
Fourth, the fact that target language use did not necessarily contribute to learners’ overall test-score gains can inform both test-takers and teachers as well. It appears that media exposure or language contact on its own did not seem to be sufficient to bring about detectable improvement in learners’ test scores, but might be important to improve learners’ fluency and some other pronunciation changes. Perhaps test-score gains require more explicit and structured instruction, whereas other speaking-related skills (e.g., intonation and rhythm) could potentially improve through frequent target language use and practice.
Fifth, attitudinal and motivational factors played an important role in their score gain process. Students’ self-perceived progress in English skills and IELTS was strongly associated with their score gains on IELTS. Also, there was a positive relationship between students’ desired IELTS score and their actual score gains. Self-assessments are more accessible than other objective measures and more indicative of learners’ affective state, which may itself contribute to or inhibit progress in language learning (Elder & O’Loughlin, 2003). They are not too difficult to administer if they are incorporated into the school curriculum. It might be useful to promote this self-assessment practice in various language and test-preparation courses in an EFL context, in particular, as a good indicator of learning progress.
Sixth, as educators and test practitioners, we should keep in mind that language learning does not follow a linear and uniform relationship. As we have repeated a few times already in this report, it is a complex and unpredictable process. We always have to take multi-dimensional approaches to better understand our learners and their progress, their needs and backgrounds, and their expectations as well as their learning behaviours.
Overall, understanding how changes in linguistic constructs are linked to the learning hours that learners spend, and what other individual factors affect those linguistic parameters can impact curriculum planning and development of language learning and assessment. We hope that the findings of this project also offer concrete evidence to understand the outcome of language learning over time and its relationship with learners’ external factors.
8. Dissemination plan
The project can result in a large number of manuscripts and research reports.
The initial finding was scheduled to be presented at LTRC 2020 in Tunisia (although it was cancelled due to COVID-19). Three additional conference proposals have been submitted: (1) ECOLT 2020 (accepted); (2) ALTAANZ 2020 (accepted); and (3) AAAL 2021 (accepted). In addition, two manuscripts will be drafted and submitted to refereed journals soon after the submission of this final report. First, the linguistic gains over time will be submitted to a journal such as Applied Linguistics or TESOL Quarterly. The relationship between learners’ test score gains and their background variables (e.g., hours of study or amount of target language use) will be a topic of interest for Language Testing or Language Assessment Quarterly.
References
- Aimin, L. (2013). The study of second language acquisition under socio-cultural theory. American Journal of Educational Research, 1(5), pp. 162-167.
- Atkinson, D. (2002). Toward a sociocognitive approach to second language acquisition. The Modern Language Journal, 86(4), pp. 525-545.
- Avery, P., & Ehrlich, S. (1992). Teaching American English pronunciation. Oxford: Oxford University Press.
- Benigno, V., de Jung, J., & Van Moere, A. (2017). How long does it take to learn a language? Insights from research on language learning. Global Scale of English Research Series. Pearson.
- Biber, D., Conrad, S., & Cortes, V. (2004) If you look at… Lexical bundles in university teaching and textbooks. Applied Linguistics, 25 (3), pp. 371-405.
- Boersma, P., & Weenink, D. (2007). Praat, http://www.praat.org (Version 4.5.25).
- Brazil, D. (1997). The communicative value of intonation in English. Cambridge: Cambridge University Press.
- Brecht, R., Davidson, D., & Ginsberg, R. (1993). Predictors of foreign language gain during study abroad. Washington D.C.: National Foreign Language Center.
- Brown, A. (2006). Candidate discourse in the revised IELTS Speaking Test. IELTS Research Report Volume 6, IELTS Australia/British Council.
- Brown, A., Iwashita, N., & McNamara, T. (2005). An examination of rater orientations and test-taker performance on English-for-Academic-Purposes speaking tasks. (TOEFL Monograph Series MS-29). Princeton, NJ: Educational Testing Service.
- Brown, G. (1983). Prosodic structure and the given/new distinction. In A. Cutler & D. R. Ladd (Eds.), Prosody: Models and measurements (pp. 67-77). Berlin: Springer-Verlag.
- Brown, G., & Yule, G. (1983). Discourse analysis. Cambridge: Cambridge University Press.
- Catford, J. C. (1987). Phonetics and the teaching of pronunciation: A systematic description of English phonology. In J. Morley (Ed.), Current perspectives on pronunciation: Practices anchored in theory (pp. 87-100). Washington, DC: TESOL.
- Celce-Murcia, M., Brinton, D., & Goodwin, J., with Barry Griner (2010). Teaching pronunciation: A course book and reference guide. Cambridge: Cambridge University Press.
- Cobb, T. (2020, May). Web VP classic v.4 [computer program]. www.lextutor.ca/vp/eng/
- Coleman, J. (1997). Residence abroad within language study. Language Teaching, 30, pp. 1-20.
- Collentine, J. (2004). The effects of learning contexts on morpho-syntactic and lexical development. Studies in Second Language Acquisition, 26, pp. 227-248.
- Collentine, J., & Freed, B. (2004). Learning context and its effects on second language acquisition. Studies in Second Language Acquisition, 26, pp. 153-171.
- Coxhead, A. (2000). A new academic word list. TESOL Quarterly, 34(2), pp. 213-238.
- Creswell, J. W., & Clark, V. L. P. (2007). Designing and conducting mixed methods research. Sage Publications, Inc.
- Cubillos, J. H., Chieffo, L., & Fan, C. (2008). The impact of short-term study abroad programs on L2 listening comprehension skills. Foreign Language Annals, 41(1), pp. 157-185.
- Derwing, T. M., Thomson, R. I., & Munro, M. J. (2006). English pronunciation and fluency development in Mandarin and Slavic speakers. System, 34(2), pp. 183-193.
- Derwing, T. M., Munro, M. J., & Thomson, R. I. (2008). A longitudinal study of ES learners’ fluency and comprehensibility development. Applied Linguistics, 29(3), pp. 359-380.
- Dewey, D. P. (2004). A comparison of reading development by learners of Japanese in intensive domestic immersion and study abroad contexts. Studies in Second Language Acquisition, 26, pp. 303-327.
- Dörnyei, Z. (2005). The psychology of the language learner: Individual differences in second language acquisition. Mahwah, NJ: Lawrence Erlbaum Associates.
- Dörnyei, Z. (2006). Individual differences in second language acquisition. AILA review, 19(1), pp. 42-68.
- Dörnyei, Z., & Ryan, S. (2015). The psychology of the language learner revisited. New York: Routledge.
- Elder, C., & O’Loughlin, K. (2003). Investigating the relationship between intensive English language study and band score gains on IELTS. IELTS Research Reports, Volume 4. R. Tulloh (Ed.). Canberra: IELTS Australia Pty Limited.
- Ellis, R. (2006). Current Issues in the Teaching of Grammar: An SLA Perspective. TESOL Quarterly, 40 (1), pp. 83-107.
- Foster, P., & Skehan, P. (1996). The influence of planning on performance in task-based learning. Studies in Second Language Acquisition, 18(3), pp. 299-324.
- Freed, B. (1998). An overview of issues and research in language learning in a study-abroad setting. Frontiers: The Interdisciplinary Journal of Study Abroad, 4, pp. 21-60.
- Freed, B. F., Dewey, D. P., Segalowitz, N. S., & Halter, R. H. (2004). The language contact profile. Studies in Second Language Acquisition, 26 (2), 349-356.
- Freed, B., Segalowitz, N., & Dewey, D. (2004). Context of learning and second language fluency in French: Comparing regular classroom, study abroad, and intensive domestic immersion programs. Studies in Second Language Acquisition, 26, pp. 275-301.
- Gardner, R., C. (1985). Social psychology and second language learning: The role of attitudes and motivation. London: Edward Arnold.
- Gardner, R. C. (2010). Motivation and second language acquisition: The socio-educational model. New York: Peter Lang.
- Gass, S. (1999) Discussion: Incidental vocabulary learning. Studies in Second Language Acquisition, 21, pp. 319-333.
- Gass, S., & Selinker, L. (2001). Second Language Acquisition: An Introductory Course. Second Edition. Lawrence Erlbaum Associates.
- Green, A. (2007). IELTS washback in context: Preparation for academic writing in higher education. London: Cambridge University Press.
- Guilloteaux, M. J., & Dörnyei, Z. (2008). Motivating language learners: A classroom-oriented investigation of the effects of motivational strategies on student motivation. TESOL Quarterly, 42(1), pp. 55-77.
- Hahn, L. D. (2004). Primary stress and intelligibility: Research to motivate the teaching of suprasegmentals. TESOL Quarterly, 38, pp. 201-223.
- Hill, K., Storch, N., & Lynch, B. (1999). A comparison of IELTS and TOEFL as predictors of academic success. IELTS Research Reports Volume 2, pp. 52-63. Canberra: IELTS Australia Pty Limited.
- Hirschi, K., Kang, O., Cucchiarini, C., Evanni, K., Hansen, J., & Strik, H. (2020). Mobile-assisted pronunciation training with limited English proficiency: Learner background and speech pattern. INTERSPEECH 2020.
- Hughes, D. L., McGillivray, L., & Schmidek, M. (1997). Guide to narrative language: Procedures for assessment. Eau Claire, WI: Thinking Publications.
- IBM Corp. (2019). IBM SPSS Statistics for Windows, version 26, (IBM Corp., Armonk, N.Y.
- IELTS Research (2020). Test-taker performance 2019. Retrieved 17 November 2020, from https://www.ielts.org/en-us/research/test-taker-performance.
- Ife, A., Vives Boix, G., & Meara, P. (2000). The impact of study abroad on the vocabulary development of different proficiency groups. Spanish Applied Linguistics, 4, pp. 55-84.
- Iwashita, N., Brown, A., McNamara, T., & O’Hagan, S. (2008). Assessed levels of second language speaking proficiency: How difficult? Applied Linguistics, 29, pp. 24-49.
- Jamieson, J., & Poonpon, K. (2013). Developing analytic scoring guides for TOEFL iBT’s Speaking Measure. TOEFL Monograph Series. RR-13-13.
- Jenkins, J. (2002). A sociolinguistically based, empirically researched pronunciation syllabus for English as an international language. Applied Linguistics, 23, pp. 83-103.
- Juffs, A. (1990). Tone, syllable structure and interlanguage phonology: Chinese learners’ stress errors. International Review of Applied Linguistics, 28, pp. 99-117.
- Kang, O. (2010). Relative salience of suprasegmental features on judgments of L2 comprehensibility and accentedness. System, 38, pp. 301-315.
- Kang, O., & Johnson, D. (2018a). Contribution of suprasegmental to English speaking proficiency: Human rater and automated scoring system. Language Assessment Quarterly, 15(2), pp. 150-168.
- Kang, O., & Johnson, D. (2018b). Patent Serial No. 9,947,322; NAU Case 2013-015, Systems and methods for automated evaluation of human speech.
- Kang, O., & Kermad, A. (2020). ESL learners’ pronunciation development in the immersion context. Speak Out.
- Kang, O., & Moran, M. (2014). Pronunciation features in non-native speakers’ oral performances. TESOL Quarterly, 48, pp. 173-184.
- Kang, O., Rubin, D., & Pickering, L. (2010). Suprasegmental measures of accentedness and judgments of language learner proficiency in oral English. Modern Language Journal, 94, pp. 554-566.
- Kang, O., Thomson, R., & Moran, M. (2018). Empirical approaches to measuring the intelligibility of different varieties of English in predicting listener comprehension. Language Learning, 68(1), pp. 115-146.
- Kang, O., & Yan, X. (2018). Linguistic features distinguishing examinees’ speaking performances at different proficiency levels. Journal of Language Testing and Assessment, 1, pp. 24-39.
- Kermad, A., & Kang, O. (under review). The Role of Individual Differences on L2 Pronunciation and Listeners’ Judgments.
- Kormos, J., & Dénes, M. (2004). Exploring measures and perceptions of fluency in the speech of second language learners. System, 32, pp. 145-164.
- Lantolf, P. J. (Ed.). (2000). Sociocultural theory and second language learning. Oxford: OUP.
- Lantolf, P., & Thorne, S. L. (2007). Sociocultural theory and second language learning. In B. Van Patten & J. Williams (Eds.), Theories in second language acquisition: An introduction (pp., 693-701). N.J: Lawrence Erlbaum Associates, Inc.
- Larsen-Freeman, D. (1997). Chaos/complexity science and second language acquisition. Applied Linguistics, 18 (2), pp. 141-165.
- Larsen-Freeman, D. (2012). From unity to diversity: Twenty-five years of language teaching methodology. English Teaching Forum, 50(2), pp. 28-38.
- Laufer, B., & Nation, P. (1995). Vocabulary size and use: Lexical richness in L2 written production. Applied Linguistics, 16(3), pp. 307-322.
- Lennon, P. (1990). The advanced learner at large in the L2 community: Developments in spoken performance. International Review in Applied Linguistics, 28, pp. 309-324.
- Levis, J. M. (2005). Changing contexts and shifting paradigms in pronunciation teaching. TESOL Quarterly, 39(3), pp. 369-377.
- Lightbown, P. M., & Spada, N. (2020). Teaching and learning L2 in the classroom: It’s about time. Language Teaching, 53(4), pp. 422-432.
- Llanes Baro, A., & Serrano Serrano, R. (2011). Length of stay and study abroad: language gains in two versus three months abroad. RESLA, 24, pp. 95-110.
- Masgoret, A.-M., & Gardner, R. C. (2003). Attitudes, motivation, and second language learning: A meta-analysis of studies conducted by Gardner and associates. Language Learning, 53(1), pp. 123-163.
- McLaughlin, B. (1990). Restructuring. Applied Linguistics, 11(2), pp. 113-128.
- Milton, J., & Meara, P. (1995). How periods abroad affect vocabulary growth in a foreign language. ITL. Institut voor Togepaste Linguistik, (107-08), pp. 17-34.
- Moyer, A. (1999). Ultimate attainment in L2 phonology. Studies in Second Language Acquisition, 21, pp. 81-108.
- Nakagawa, S., & Schielzeth, H. (2013). A general and simple method for obtainingR²from generalized linear mixed-effects models. Methods in Ecology and Evolution, 4(2), pp. 133-142.
- Nation, I. S. P. (2013). Learning vocabulary in another language (2nd ed.). Cambridge, UK: Cambridge University Press.
- Ortega, L. (2005). Longitudinal research in second language acquisition: Recent trends and future directions. Annual Review of Applied Linguistics, 25, pp. 26-45.
- Pickering, L. (2001). The role of tone choice in improving ITA communication in the classroom. TESOL Quarterly 35, pp. 233-255.
- Pickering, L. (2004). The structure and function of intonational paragraphs in native and nonnative speaker instructional discourse. English for Specific Purposes, 23, pp. 19-43.
- Pickering, L. (2018). Discourse intonation: A discourse-pragmatic approach to teaching the pronunciation of English. Ann Arbor: University of Michigan Press.
- Segalowitz, N., & Freed, B. (2004). Context, contact, and cognition in oral fluency acquisition: Learning Spanish in at home and study abroad contexts. Studies in Second Language Acquisition, 26, pp. 173-199.
- Swain, M., Kinnear, P., & Steinman, L. (2015). Sociocultural theory in second language education: An introduction through narratives. Multilingual Matters.
- Taguchi, N. (2008). Cognition, language contact, and the development of pragmatic comprehension in a study abroad context. Language Learning, 58, pp. 33-71.
- Taguchi, N., Li, S., & Xiao, F. (2013). Production of formulaic expressions in L2 Chinese: A developmental investigation in a study abroad context. Chinese as a Second Language Research Journal, 2, pp. 23-58.
- Taylor, L. (2001). Revising the IELTS Speaking test: Developments in test format and task design. Research Notes 5, pp. 3-5.
- Taylor, L., & Falvery, P. (2007). IELTS Collected papers: Research in speaking and writing assessment (Studies in Language Testing volume 19). Cambridge: UCLES/Cambridge University Press.
- Trenchs-Parera, M. (2009). Effects of formal instruction and a stay abroad on the acquisition of native-like oral fluency. The Canadian Modern Language Review, 65(3), pp. 365-393.
- US Foreign Service Institute. (n.d.). Foreign language training. US Department of State. Retrieved 21 November 2020, from https://www.state.gov/foreign-language-training/
- Vanderplank, R. (1993). Pacing and spacing as predictors of difficulty in speaking and understanding English. English Language Teaching Journal, 47, pp. 117-125.
- Vygotsky, L. (1978). Mind in society: The development of higher psychological processes (M. Cole, V. John-Steiner, S. Scribner, & E. Souberman, Eds.). Cambridge, MA: Harvard University Press.
- Wennerstrom, A. (1994). Intonational meaning in English discourse: A study of nonnative speakers. Applied Linguistics, 15, pp. 399-421.
- Wennerstrom, A. (1998). Intonation as cohesion in academic discourse: A study of Chinese speakers of English. Studies in Second Language Acquisition, 42, pp. 1-13.
- Wennerstrom, A. (2000). The role of intonation in second language fluency. In H. Riggenbach (Ed.), Perspectives on fluency (pp. 102-127). Ann Arbor: University of Michigan Press.
- Zumbo, B. (1999). The simple difference score as an inherently poor measure of change: Some reality, some methodology. In B. Thompson (ed.) Advances in social science methodology, Vol 5, Greenwich, CT: JAL Press.
Appendix A: Background Questionnaire (Pre)
Note: questionnaire administered in Qualtrics
Start of Block: Demographics
Please answer the following questions as carefully as possible.
Family name: ____
Given name: ____
Date of birth (yyyy/mm/dd): ____
Your email address: ____
Gender: [Male / Female / Prefer not to answer] ____
Country of birth: [South Korea / Other (please enter here): ____
Nationality: [South Korean / Other (please enter here): ____
First language: [Korean / Other (please enter here): ____
What other languages do you speak?
What program are you taking at ‘L’?
- IELTS 5+
- IELTS 6+
- IELTS 7+
- 5.5 Guarantee (5.5 점수보장반)
- 6.0 Guarantee (6.0 점수보장반)
- 6.5 Guarantee (6.5 점수보장반)
- 7.0 Guarantee (7.0 점수보장반)
How long is your course?
- 4 hours/day, 1 day/week, for 8 weeks (주말반, 8주코스)
- 4 hours/day, 1 day/week, for 12 weeks (주말반, 12주코스)
- 2 hours/day, 5 days/week for 8 weeks (주중저녁반, 8주코스)
- 2 hours/day, 5 days/week for 12 weeks (주중저녁반, 12주코스)
- 4 hours/day, 5 days/week, for 8 weeks (주중 오전 또는오후반, 8주코스)
- 4 hours/day, 5 days/week, for 12 weeks (주중 오전 또는 오후반, 12주코스)
- 8 hours/day, 5 days/week, for 8 weeks (점수보장반, 8주코스)
- Other (please explain here):
What is your most recent mock exam (모의고사) test score?
What is your highest level of education?
- Final year of secondary school
- Certificate or diploma
- Bachelors degree
- Postgraduate certificate or diploma
- Masters degree
- PhD
What English courses did you do before this course? Please choose all the answers that describe your experiences.
- I studied English at a secondary/high school.
- I studied English at university.
- I studied English at a private language school.
- I studied English with a private tutor.
- I did not do any English courses before this one.
Why did you learn English before you started this course? Please choose all the answers that describe you.
- English was required at primary and/or secondary school.
- English was required at university.
- I needed to know English to travel abroad.
- I needed to know English to study abroad.
- I needed to know English for my job.
- Other reason (please explain):
Have you lived in any other English speaking countries? [Yes / No]
Have you studied English at any other language schools before this one?
- Yes, at one other language school
- Yes, at more than one other language school
- No
Why are you studying English/IELTS now (in this course)? Please choose all the answers that describe you.
- My parents want me to study English/IELTS.
- I need to study English/IELTS for my job (or future job).
- I need to study English/IELTS to prepare for further studies.
- Other reason (please explain):
Have you taken the IELTS or TOEFL before you began your current course? [Yes / No]
Are you planning to study at a university in English? [Yes / No]
End of Block: Demographics
Start of Block: Follow-up questions
[Note: items in this block were conditionally displayed depending on participants’ responses on the previous block. In this appendix, each item is headed by the condition for display in the format If response to question: (question text from the previous block) = (response triggering display of this question)]
Conditionally Display This Question:
If response to question: What English courses did you do before this course? Please choose all the answers that describe you. = I studied English at a secondary/high school.
Please give more information about your secondary/high school English courses. If you do not have an answer for one of the blanks, please write “0”.
- What country did you study in?
- How many years did you study?
- How many months did you study (if less than a year)?
Conditionally Display This Question:
If response to question: What English courses did you do before this course? Please choose all the answers that describe you. = I studied English at university.
Please give more information about your university English courses.
If you do not have an answer for one of the blanks, please write “0”.
- What country did you study in?
- How many years did you study?
- How many months did you study (if less than a year)?
Conditionally Display This Question:
If response to question: What English courses did you do before this course? Please choose all the answers that describe you. = I studied English at a private language school.
Please give more information about your private language school English courses.
If you do not have an answer for one of the blanks, please write “0”.
- What country did you study in?
- How many years did you study?
- How many months did you study (if less than a year)?
Conditionally Display This Question:
If response to question: What English courses did you do before this course? Please choose all the answers that describe you. = I studied English with a private tutor.
Please give more information about your private tutor English courses.
If you do not have an answer for one of the blanks, please write “0”.
- What country did you study in?
- How many years did you study?
- How many months did you study (if less than a year)?
Conditionally Display This Question:
If response to question: Have you lived in any other English speaking countries? = Yes
Please give more information about the English speaking country that you lived in.
If you do not have an answer for one of the blanks, please write “0”.
- What country did you live in?
- How many years did you live there?
- How many months did you live there (if less than a year)?
Conditionally Display This Question:
If response to question: Have you studied English at any other language schools before this one? = Yes, at one other language school
Please give more information about the other language school where you studied English most recently. If you do not have an answer for one of the blanks, please write “0”.
- Name of language school:
- Type of course (general, academic, or IELTS training):
- Number of months that you studied there:
Conditionally Display This Question:
If response to question: Have you studied English at any other language schools before this one? = Yes, at more than one other language school
Please give more information about the other language schools where you studied English most recently. If you do not have an answer for one of the blanks, please write “0”.
- Name of first language school:
- Type of course (general, academic, or IELTS training):
- Number of months that you studied at first language school:
- Name of second language school:
- Type of course (general, academic, or IELTS training):
- Number of months that you studied at second language school:
Conditionally Display This Question:
If response to question: Have you taken the IELTS or TOEFL before you began your current course? = Yes
Please give more information about your previous IELTS/TOEFL results. If you do not have a score for the test you took, please write “none” in the space for “result.”
| Test 1 | Test 2 | Test 3 | Test 4 | |
|---|---|---|---|---|
| Date of the test (month and year): | ||||
| Type of test (IELTS or TOEFL): | ||||
| Result: |
End of Block: Follow-up questions
Start of Block: Studying at University in English
These questions are about your plans to study at a university in English.
What degree do you want to study?
- Certificate or diploma
- Bachelors
- Postgraduate certificate or diploma
- Masters
- PhD
When do you plan to start? Please give the month and year (e.g., September 2020).
What IELTS score do you need to start this degree?
- higher than 7
- 7
- 6.5
- 6
- 5.5
- 5
- I don’t know
Do you think you can get this score in three months? [Yes / No]
End of Block: Studying at University in English
Start of Block: Language Use/Study
How important is each of the language skills below?
Note: A skill is important if you need it often for your studies or in your personal life.
Please rate from 1 = not important to 4 = very important.
| Not important | A little important | Somewhat important | Very important | |
|---|---|---|---|---|
| 1 | 2 | 3 | 4 | |
| Listening () | ||||
| Reading () | ||||
| Speaking () | ||||
| Writing () | ||||
| IELTS test practice () |
How often do you use English in your daily life (including inside and outside of class)?
- Less than an hour per week
- 1-2 hours per week
- 2-4 hours per week
- 4-6 hours per week
- 6-8 hours per week
- 8-10 hours per week
- 10-12 hours per week
- 12-14 hours per week
- 14-16 hours per week
- More than 16 hours per week
How many hours have you studied IELTS?
- Less than an hour per week
- 1-2 hours per week
- 2-4 hours per week
- 4-6 hours per week
- 6-8 hours per week
- 8-10 hours per week
- 10-12 hours per week
- 12-14 hours per week
- 14-16 hours per week
- More than 16 hours per week
End of Block: Language Use/Study
Appendix B: Background questionnaire (post)
Note: questionnaire administered in Qualtrics
Start of Block: Demographics
Please answer the following questions as carefully as possible.
Family name: ____
Given name: ____
Date of birth (yyyy/mm/dd):____
Your email address: ____
Gender: [Male / Female / Prefer not to answer] ____
What is your most recent mock exam (모의고사) test score?
What program did you take at ‘L’?
- IELTS 5+
- IELTS 6+
- IELTS 7+
- 5.5 Guarantee (5.5 점수보장반)
- 6.0 Guarantee (6.0 점수보장반)
- 6.5 Guarantee (6.5 점수보장반)
- 7.0 Guarantee (7.0 점수보장반)
How long was this program?
- 4 hours/day, 1 day/week, for 8 weeks (주말반, 8주코스)
- 4 hours/day, 1 day/week, for 12 weeks (주말반, 12주코스)
- 2 hours/day, 5 days/week for 8 weeks (주중저녁반, 8주코스)
- 2 hours/day, 5 days/week for 12 weeks (주중저녁반, 12주코스)
- 4 hours/day, 5 days/week, for 8 weeks (주중 오전 또는오후반, 8주코스)
- 4 hours/day, 5 days/week, for 12 weeks (주중 오전 또는 오후반, 12주코스)
- 8 hours/day, 5 days/week, for 8 weeks (점수보장반, 8주코스)
- Other (please explain here):
Why were you studying English/IELTS in this course?
Please choose all the answers that describe you.
- My parents want me to study English/IELTS.
- I need to study English/IELTS for my job (or future job).
- I need to study English/IELTS to prepare for further studies.
- Other reason (please explain):
Are you planning to study at a university in English? [Yes / No]
End of Block: Demographics
Start of Block: Studying at University in English
These questions are about your plans to study at a university in English.
What degree do you want to study?
- Certificate or diploma
- Bachelors
- Postgraduate certificate or diploma
- Masters
- PhD
When do you plan to start? Please give the month and year (e.g., September 2020).
What IELTS score do you need to start this degree?
- higher than 7
- 7
- 6.5
- 6
- 5.5
- 5
- I don’t know
Do you think you can get this score the next time you take the IELTS? [Yes / No]
End of Block: Studying at University in English
Start of Block: Language Study/Contact
How often did you do each of the following activities in the last three months?
[Answer choices were the same for each statement in this block:
- Less than an hour per week
- 1-2 hours per week
- 2-4 hours per week
- 4-6 hours per week
- 6-8 hours per week
- 8-10 hours per week
- 10-12 hours per week
- 12-14 hours per week
- 14-16 hours per week
- More than 16 hours per week]
I attended my English class.
I did homework for my English class.
I studied alone outside of class.
I studied with others outside of class.
I did IELTS practice exams outside of class.
I studied or practiced reading in English outside of class.
I studied or practiced listening in English outside of class.
I studied or practiced speaking in English outside of class.
I studied or practiced writing in English outside of class.
I communicated with native speaker friends in English.
I communicated with non-native speaker friends/classmates in English.
I communicated with my family in English.
I communicated with people during online gaming (PlayStation, Xbox, etc.) in English.
I watched TV in English.
I watched movies in English.
I watched videos (YouTube, DailyMotion, Facebook, etc.) in English.
I listened to music in English.
I used the internet in English.
I used social media (Facebook, Twitter, Instagram, etc.) in English.
I read in English (not for studying).
End of Block: Language Study/Contact
Start of Block: Language Improvement/Overall Use
How much do you think your listening in English has improved over the last three months?
- A lot
- A moderate amount
- A little
- Not at all
How much do you think your speaking in English has improved over the last three months?
- A lot
- A moderate amount
- A little
- Not at all
How much do you think your reading in English has improved over the last three months?
- A lot
- A moderate amount
- A little
- Not at all
How much do you think your writing in English has improved over the last three months?
- A lot
- A moderate amount
- A little
- Not at all
How often do you use English in your daily life (including inside and outside of class)?
- Less than an hour per week
- 1-2 hours per week
- 2-4 hours per week
- 4-6 hours per week
- 6-8 hours per week
- 8-10 hours per week
- 10-12 hours per week
- 12-14 hours per week
- 14-16 hours per week
- More than 16 hours per week
How many hours have you studied IELTS?
- Less than an hour per week
- 1-2 hours per week
- 2-4 hours per week
- 4-6 hours per week
- 6-8 hours per week
- 8-10 hours per week
- 10-12 hours per week
- 12-14 hours per week
- 14-16 hours per week
- More than 16 hours per week
End of Block: Language Improvement/Overall Use
Start of Block: IELTS Classes
These questions are about your English classes during the last three months.
What do you like most about your current English course?
What do you like least about your current English course?
How much do you agree or disagree with the following statements about your current English course?
This course has helped me improve my reading.
- Strongly agree
- Agree
- Disagree
- Strongly disagree
This course has helped me improve my writing.
- Strongly agree
- Agree
- Disagree
- Strongly disagree
This course has helped me improve my listening.
- Strongly agree
- Agree
- Disagree
- Strongly disagree
This course has helped me improve my speaking.
- Strongly agree
- Agree
- Disagree
- Strongly disagree
This course has given me confidence in using English outside of class.
- Strongly agree
- Agree
- Disagree
- Strongly disagree
I was happy with the teaching in this course.
- Strongly agree
- Agree
- Disagree
- Strongly disagree
Overall, I am very satisfied with my current English course.
- Strongly agree
- Agree
- Disagree
- Strongly disagree
How much do you think your next IELTS listening results will improve since your last test?
- A lot
- A moderate amount
- A little
- Not at all
How much do you think your next IELTS speaking results will improve since your last test?
- A lot
- A moderate amount
- A little
- Not at all
How much do you think your next IELTS reading results will improve since your last test?
- A lot
- A moderate amount
- A little
- Not at all
How much do you think your next IELTS writing results will improve since your last test?
- A lot
- A moderate amount
- A little
- Not at all
Do you think the IELTS is a good test of your English language ability? [Yes / No]
Please explain why you think the IELTS is or is not a good test of your English language ability.
End of Block: IELTS Classes
Appendix C: Weekly language study/use survey
Note: survey administered in Qualtrics
Start of Block: Demographics
Please answer the following questions as carefully as possible.
Family name:
Given name:
Date of birth (yyyy/mm/dd):
Today’s date (yyyy/mm/dd):
Your email address:
Which week of your IELTS course are you doing this survey for?
- Week 1
- Week 2
- Week 3
- Week 4
- Week 5
- Week 6
- Week 7
- Week 8
- Week 9
- Week 10
- Week 11
- Week 12
What is your most recent mock exam (모의고사) test score?
What program are you taking at ‘L’?
- IELTS 5+
- IELTS 6+
- IELTS 7+
- 5.5 Guarantee (5.5 점수보장반)
- 6.0 Guarantee (6.0 점수보장반)
- 6.5 Guarantee (6.5 점수보장반)
- 7.0 Guarantee (7.0 점수보장반)
How long is this program?
- 4 hours/day, 1 day/week, for 8 weeks (주말반, 8주코스)
- 4 hours/day, 1 day/week, for 12 weeks (주말반, 12주코스)
- 2 hours/day, 5 days/week for 8 weeks (주중저녁반, 8주코스)
- 2 hours/day, 5 days/week for 12 weeks (주중저녁반, 12주코스)
- 4 hours/day, 5 days/week, for 8 weeks (주중 오전 또는오후반, 8주코스)
- 4 hours/day, 5 days/week, for 12 weeks (주중 오전 또는 오후반, 12주코스)
- 8 hours/day, 5 days/week, for 8 weeks (점수보장반, 8주코스)
- Other (please explain here):
End of Block: Demographics
Start of Block: Language Study
How many hours this week did you spend doing the following study activities?
[Answer choices were the same for each statement in this block:
- 0 (My class at ‘L’ is finished)
- Less than an hour per week
- 1-2 hours per week
- 2-4 hours per week
- 4-6 hours per week
- 6-8 hours per week
- 8-10 hours per week
- 10-12 hours per week
- 12-14 hours per week
- 14-16 hours per week
- More than 16 hours per week]
I attended my English class.
I did homework for my English class.
I studied alone outside of class.
I studied with others outside of class.
I did IELTS practice exams outside of class.
I studied or practiced reading in English outside of class.
I studied or practiced listening in English outside of class.
I studied or practiced speaking in English outside of class.
I studied or practiced writing in English outside of class.
End of Block: Language Study
Start of Block: Language Contact
How many hours this week did you spend doing the following activities?
[Answer choices were the same for each statement in this block:
- Less than an hour per week
- 1-2 hours per week
- 2-4 hours per week
- 4-6 hours per week
- 6-8 hours per week
- 8-10 hours per week
- 10-12 hours per week
- 12-14 hours per week
- 14-16 hours per week
- More than 16 hours per week]
I communicated with native speaker friends in English.
I communicated with non-native speaker friends/classmates in English.
I communicated with my family in English.
I communicated with people during online gaming (PlayStation, Xbox, etc.) in English.
I watched TV in English.
I watched movies in English.
I watched videos (YouTube, DailyMotion, Facebook, etc.) in English.
I listened to music in English.
I used the internet in English.
I used social media (Facebook, Twitter, Instagram, etc.) in English.
I read in English (not for studying).
End of Block: Language Contact
Appendix D: Online interview questions
Questions for all participants:
- Do you think your IELTS score improved in these 12 weeks? If so, why? If not, why?
- How many hours a week did you spend studying English on average? Do you think you should have studied more or less? Why?
- How much or how often a day did you try to use English?
- In what way(s)/context(s) did you use English?
- Do you think your current English proficiency affected your 12-week study or test performance?
Follow-up questions for participants with no score gain:
- What do you think about your second IELTS scores in comparison to your first test? Are you satisfied with your results? If so, why? If not, why?
- If you had to take the IELTS one more time, is there anything you would want to change or you would want to do differently?
- Do you have any suggestions for IELTS after taking the tests a couple of times?
- Is there anything you want to share, in terms of your IELTS test-taking experience or test preparation process in general?
- Any additional comments you would like to share?
Author biodata
Okim Kang
Okim Kang is Professor of Applied Linguistics and Director of the Applied Linguistics Speech Lab at Northern Arizona University, Flagstaff, AZ. Her research interests include speech production and perception, L2 pronunciation and intelligibility, L2 oral assessment and testing, automated scoring and speech recognition, World Englishes, and language attitude.
Hyunkee Ahn
Hyunkee Ahn is a full Professor at the Department of English Language Education, Seoul National University, South Korea. He earned a PhD in Linguistics (phonetics) in 1999 from the University of Texas at Austin, USA. His research is currently on applied/L2 phonetics, pronunciation teaching and learning, and language assessment.
Kate Yaw
Katherine (Kate) Yaw is a PhD candidate in Applied Linguistics at Northern Arizona University. She has worked in TESOL since 2007, with experience in teaching, teacher training, and program administration. Her research interests include listeners’ attitudes, perception, and cognitive processing of L2 accented speech.
Soh-Yon Chung
Soh-Yon Chung is a PhD candidate at the Department of Foreign Language Education at Seoul National University. She holds an MA in English-Korean Interpretation from Ewha Women’s University, and has worked as a professional international conference interpreter and translator for more than 15 years. Her research interests include speech fluency and pronunciation.