
Exploring the use of video-conferencing technology to deliver the IELTS Speaking Test: Phase 3 technical trial
Official IELTS research report on Examiners and Scoring - Speaking; IELTS Test - Speaking, published in 2018.
Abstract
Face-to-face speaking assessment is widespread as a form of assessment, since it allows the elicitation of interactional skills. However, face-to-face speaking test administration is also logistically complex, resource-intensive and can be difficult to conduct in geographically remote or politically sensitive areas. Recent advances in video-conferencing technology now make it possible to engage in online face-to-face interaction more successfully than was previously the case, thus reducing dependency upon physical proximity. A major study was, therefore, commissioned to investigate how new technologies could be harnessed to deliver the face-to-face version of the IELTS Speaking test.
Phase 1 of the study, carried out in London in January 2014, presented results and recommendations from a small-scale initial investigation designed to explore what similarities and differences, in scores, linguistic output and test-taker and examiner behaviour, could be discerned between face-to-face and Internet-based videoconferencing delivery of the Speaking test. This research used a convergent parallel mixed-methods design and the results of the analyses suggested that the speaking construct remains essentially the same across both delivery modes.
Phase 2 of the study was a larger-scale study, carried out in Shanghai, People’s Republic of China in May 2015. A convergent parallel mixed-methods design was again used to allow for collection of an in-depth, comprehensive set of findings derived from multiple sources. The research included an analysis of rating scores under the two delivery conditions, test-takers’ linguistic output during the tests, as well as short interviews with test-takers following a questionnaire format. Many-facet Rasch Model (MFRM) analysis of test scores indicated that, although the video-conferencing mode was slightly more difficult than the face-to-face mode, when the results of all analytic scoring categories were combined, the actual score difference was negligibly small, thus supporting the Phase 1 findings.
This report presents Phase 3 of the study which was carried out with 89 test-takers and eight examiners in five cities (Bogotá, Medellín, Buenos Aires, Caracas, Mexico City) in Latin America in April and May 2016. A convergent parallel mixed-methods approach was used once again, but unlike the first two studies, this phase focused only on the video-conferencing mode of delivery of the IELTS Speaking test. The primary aims of this phase were to: (a) trial a new platform to deliver video-conferencing tests across different locations, as well as refining examiner and test-taker training materials for the new platform; and (b) further investigate the scoring validity of the video-conferencing test.
The new platform was generally perceived positively and functioned well to deliver the tests most of the time. However, nearly 80% of the sessions encountered some technical or sound problems (although most of the problems were very minor) which, given the high stakes of the IELTS Speaking test, gives cause for concern. MFRM analyses were carried out, using a rating scale model with 4 facets for score variance: test-takers, test versions, examiners, and rating scales. No systematic inconsistencies were found in the analysis, thus supporting the findings from Phases 1 and 2 and providing further evidence of the scoring validity of the video-conferencing delivered IELTS Speaking test. Following qualitative analysis of examiners and test-takers’ questionnaire responses and focus group comments, the report concludes with recommendations regarding further investigations required before a video-conferencing delivery format for the IELTS Speaking test can be fully operationalised.
Authors’ biodata
Vivien Berry
Dr Vivien Berry is a Senior Researcher, English Language Assessment at the British Council where she leads an assessment literacy project to promote understanding of basic issues in language assessment, including the development of a series of video animations, with accompanying text-based materials. Before joining the British Council, Vivien completed a major study for the UK General Medical Council to identify appropriate IELTS score levels for International Medical Graduate applicants to the GMC register. She has published extensively on many aspects of oral language assessment including a book, Personality Differences and Oral Test Performance (2007, Peter Lang) and regularly presents research findings at international conferences. Vivien has also worked as an educator and educational measurement/assessment specialist in Europe, Asia and the Middle East.
Fumiyo Nakatsuhara
Dr Fumiyo Nakatsuhara is a Reader at the Centre for Research in English Language Learning and Assessment (CRELLA), University of Bedfordshire. Her research interests include the nature of co-constructed interaction in various speaking test formats (e.g. interview, paired and group formats), task design and rating scale development. Fumiyo’s publications include the book, The Discourse of the IELTS Speaking Test: Interactional Design and Practice (co-authored with P. Seedhouse, 2018, CUP)., book chapters in Language Testing: Theories and Practices (O’Sullivan, ed. 2011) and IELTS Collected Papers 2: Research in Reading and Listening Assessment (Taylor and Weir, eds. 2012) , as well as journal articles in Language Testing (2011; 2014) and Language Assessment Quarterly (2017). She has carried out a number of international testing projects, working with ministries, universities and examination boards.
Chihiro Inoue
Dr Chihiro Inoue is a Senior Lecturer at the Centre for Research in English Language Learning and Assessment (CRELLA), University of Bedfordshire. Her main research interests lie in task design, rating scale development, the criterial features of learner language in productive skills and the variables to measure such features. She has carried out a number of test development and validation projects in English and Japanese in the UK, USA and Japan. Her publications include the book, Task Equivalence in Speaking Tests (2013, Peter Lang) and articles in Language Assessment Quarterly (2017), Assessing Writing (2015) and Language Learning Journal (2016). In addition to teaching and supervising in the field of language testing at UK universities, Chihiro has wide experience in teaching EFL and ESP at the high school, college and university levels in Japan.
Evelina Galaczi
Dr Evelina Galaczi is Head of Research Strategy at Cambridge Assessment English. She has worked in language education for over 25 years as a teacher, teacher trainer, materials writer, program administrator, researcher and assessment specialist. Her current work focuses on speaking assessment, the role of digital technologies in assessment and learning, and on professional development for teachers. Evelina regularly presents at international conferences and has published papers on speaking assessment, computer-based testing, and paired speaking tests.
Introduction
1.1. Background
Face-to-face interaction no longer depends upon physical proximity within the same location, as recent technical advances in online video-conferencing technology have made it possible for users in two or more locations to successfully communicate in real time through audio and video. Video-conferencing applications, such as Adobe Connect, Facetime, Google Hangouts, Skype and Zoom, are now commonly used to communicate in professional settings when those involved are in different locations. This has the advantage of enabling face-to-face interaction amongst users while at the same time limiting travel costs.
The use of video-conferencing has also become an accepted method of delivery in educational contexts, including second/foreign (L2) learning. However, videoconferencing in L2 speaking assessment is less widely used, and research on this test mode is scarce. The aim of this study is to extend the research base on the use of videoconferencing in L2 speaking assessment through an investigation of the comparability of the speaking constructs measured by face-to-face and video-conferencing delivery of the IELTS Speaking test.
1.2. Phases of the study
The study was carried out in three phases.
Phase 1 consisted of a small-scale initial investigation conducted at a Further Education College in London in 2014, with 32 students of mixed nationalities and four trained IELTS examiners. This was a convergent parallel mixed-methods study, investigating what similarities and differences in scores, linguistic output, test-taker feedback and examiner behaviour could be discerned between the two formats, face-to-face (f2f) and videoconferencing (VC) delivery, and made recommendations for further research. A report on the findings of the study was submitted to the IELTS Partners (British Council, Cambridge Assessment English and IDP IELTS Australia) in June 2014 and was subsequently published on the IELTS website (Nakatsuhara, Inoue, Berry and Galaczi, 2016). See also Nakatsuhara, Inoue, Berry and Galaczi (2017a) for a theoretical, constructfocused discussion on delivering the IELTS Speaking test in face-to-face and video-conferencing modes.
Phase 2 was a larger-scale follow-up study designed to implement recommendations from Phase 1. It was conducted at Sydney Institute of Language and Communication (SILC) Business School, Shanghai University, Shanghai, People’s Republic of China in 2015. Ninety-nine (99) test-takers took two IELTS Speaking tests under face-to-face and computer-delivered video-conferencing conditions. Performances were rated by 10 trained IELTS examiners. A convergent parallel mixed-methods design was again used to allow for collection of an in-depth, comprehensive set of findings derived from multiple sources, with MFRM analysis of test-takers’ scores, examination of language functions elicited, feedback questionnaires, examiners’ focus-group discussions, and observation notes taken during test sessions. MFRM analysis of test scores indicated that there were no significant differences in scores awarded on the two modes, although some qualitative differences were observed in test-takers’ functional output and examiners’ behaviour as raters and interlocutors. As in Phase 1, test-takers made more requests for clarification under the VC condition. Of the test-takers, 71.7% preferred the face-to-face test; 39.4% reported that there was no difference in the difficulty of the two modes.
However, most examiners perceived that there was no difference in test-takers opportunity to demonstrate their level of English proficiency and that there was no difference in their ease of rating test-taker performance. The results were then discussed in the light of the EAP speaking construct which now includes video-conferencing communication undertaken in distance-learning degree courses and oral examination situations.
A report on the findings of the study was submitted to the IELTS Partners in March 2017 and has been published on the IELTS website (Nakatsuhara, Inoue, Berry and Galaczi, 2017b).
The design of the current study (Phase 3) has been informed by the recommendations of the Phase 2 study and previous research on video-conferencing technology in teaching and assessment contexts.
The next section presents a summary of relevant literature, followed by details of the methodology and data collection of the current study, which is related to further examiner training and the development of a bespoke technological solution for test delivery. The report then outlines the findings and implications of the research and concludes with recommendations regarding further investigations required before a video-conferencing delivery format for the IELTS Speaking test can be fully operationalised.
Literature review
The use of video-conferencing has grown in the last decade, with the widespread availability of free or inexpensive software applications, such as Skype or Google Hangouts, and has found a useful application in distance learning through its ability to connect teachers/experts with students and peers with peers. Various benefits of videoconferencing in distance education have been documented, such as developing content knowledge based on drawing directly on experts’ knowledge. Broader education benefits of video-conferencing have been reported as well, including the development of intercultural competence, collaborative learning and greater awareness and tolerance towards differences, as well as the promotion of learner cognitive characteristics such as learner autonomy, motivation and self-regulated learning (Abbott, Austin, Mulkeen & Metcalfe 2004; Lawson, Comber, Gage & Cullum-Hanshaw 2010; Lee 2007).
2.1. Video-conferencing in language education
Video-conferencing has played an important role in language education, largely due to its potential to bring authentic input and increased speaking practice opportunities into remote classrooms and into classrooms with teachers who have a limited command of the language they are teaching. Such opportunities for interaction are essential components of second language acquisition (Ellis, 2005). Video-conferencing has been used in small-scale language exchanges (Kinginger, 1998) and has been incorporated into large-scale national education projects such as the Plan Ceibal en Ingles program in Uruguay, which provides English lessons via video-conferencing to over 80,000 children in Uruguayan public schools (www.britishcouncil.uy).
Lawson et al. (2010) distinguish between two broad strands in the literature on videoconferencing in education: one strand which focusses on aspects of the experience of video-conferencing, and the other which explores video-conferencing from a pedagogic perspective, with a focus on the factors which contribute to a positive impact on learning.
Taken together, the main findings from this body of literature have produced several empirically supported insights of relevance for the present study.
In terms of factors related to the experience of video-conferencing, technical issues such as sound/video quality have been found - not surprisingly - to influence the learning experience. They largely relate to the lag and desynchronisation of the audio/video, which in turn influences the interaction produced and can introduce some ambiguity. For example, Kern (2014) reports that in the context he explored (a collaboration project between students of French at a university in the United States and two universities in France), cases of pronounced delays in transmission led to confusion whether the paralinguistic cues, e.g. smiles and nods, were a response to what speakers were saying at that moment or to what they had said a moment earlier. Such ambiguities, the author notes, presented ‘real challenges to understanding’ (p.98). Wang (2006) also cautions that sound and video quality need to be taken into consideration when video-conferencing is used in education settings.
The effect of the video-conferencing medium on paralinguistic factors, such as body language and facial expressions, has also been reported as an important consideration. Research by Kern (2014) reported physical video-conferencing constraints, such as the fact that the participants had to remain mostly immobile since the webcam exaggerates the effects of physical movement, and the fact that gestures outside the field of view were not seen. The author also noted the difficulty of direct eye contact since speakers had to either look at the webcam to make direct eye contact or at the interlocutor window on the screen, thus not making direct eye contact. Similarly, Wang (2004, 2006) reported that paralinguistic features such as facial expressions, e.g. ‘an expectant look or raised eyebrows’ (2006: 134), were a key part of the support some participants needed to keep the conversation going. All of these features need to be given due consideration in a video-conferencing setting, since paralinguistic cues have been shown to reduce misunderstanding and ambiguity in speech (Chen 2009), and differences in their use between video-conferencing interaction and face-to-face interaction could influence the success of the experience.
Other empirical findings have pointed to the role of affective factors in video-conferencing. In an investigation of negotiation of meaning in video-conferencing settings, Wang (2006) noted that breakdowns could have been triggered by participants’ nervousness. Eales, Neale and Carroll (1999) indicated that 20% of the students in their study of K-12 classrooms did not report a positive reaction to video-conferencing. Jauregi and Baňados (2008), in a study of Chilean and Dutch students studying Spanish in a video web communication project, reported different degrees of preference for the videoconferencing mode, based on individual differences and on cultural background; the Chilean students preferred to interact face-to-face, rather than online, while no clear preference emerged for the Dutch students.
Language level considerations have emerged as playing a role as well, as shown by Wang (2006) who investigated negotiation of meaning in video-conferencing. The author reported that the participants’ low level of listening and speaking skills, as well as limited vocabulary, were a major trigger for breakdowns in communication, since participants did not have the language resources to clarify meaning or check understanding.
Finally, the body of literature on video-conferencing in education has shown the importance of pedagogic considerations for the success of the learning experience. One such consideration addressed the question of what education formats videoconferencing is best suited for, with research indicating that it does not seems well suited to didactic lectures, since they do not exploit the interactive potential of the medium: ‘video-conferencing as a medium offers less than the lecture in terms of pedagogy, and wins mainly on the logistical value of bringing people together across a distance’ (Laurillard, 2002: 158).
2.2. Video-conferencing in language assessment
The use of a video-conferencing system in English language assessment has been around for at least 25 years. As long ago as 1992, Clark and Hooshmand reported on an exploratory study designed to compare face-to-face and video-conferencing modes of delivery in tests of Arabic and Russian. The researchers reported no significant difference in performance in terms of scores but did find an overall preference by test-takers for the face-to-face mode, although no preference for either test mode was reported by examiners. For the next 20 years or so, there was little follow-up to these early studies as researchers tended to concentrate on investigating the similarities and differences of the oral construct under face-to-face and semi-direct, computer-delivered assessments (cf. Bernstein, Van Moere & Cheng, 2010; Kenyon & Malabonga, 2001; Kiddle & Kormos, 2011; Shohamy, 1994; Stansfield, 1990; Stansfield & Kenyon, 1992; inter alia).
In a recent study which returned to an examination of live test performances and which focused on investigating a technology-based group discussion test, Davis, Timpe-Laughlin, Gu and Ockey (2017) used video-conferencing for group discussion tests requiring interaction between a moderator and several participants. Sessions were conducted in four different states in the United States and in three mainland Chinese cities. In the U.S. sessions, participants and moderator were in different states, and in the Chinese sessions, the participants were in one of three cities, with the moderator in the U.S. Participants generally expressed favourable opinions of the tasks and technology, although Internet instability in China caused some disruption. The researchers concluded that video-mediated group discussion tests hold much promise for the future, although technological issues remain to be fully resolved.
Another group discussion test study (Ockey, Gu & Keehner, 2017) was designed to use web-based virtual environment (VE) technology to minimise problems associated with getting test-takers and examiners together in the same physical environment. Groups of three test-takers were connected by web-based technology from three remote sites with a moderator who asked them to discuss a topic together. Test-takers could see avatars of other test-takers in their group and a static image of the moderator. When test-takers spoke, their avatar’s arms and head moved thus providing a semblance of body language which the researchers claim assisted in effective turn-taking. The technology appears to have functioned satisfactorily and only a few instances were reported when test-takers could not hear each other. Participants stated that they felt they were present with another person in the VE environment but not to the same extent as in face-to-face oral communication. The researchers hypothesise that, although this may limit the authenticity of the assessment, it could perhaps lead to less anxiety which may, in turn, lead to discourse which better represents what the test-taker is capable of producing in a non-testing situation.
In other studies of mode-of-delivery of speaking tests and anxiety, Craig and Kim (2010, 2012) and Kim and Craig (2012) compared the face-to-face and video-conferencing modes of an interview speaking test with 40 English language learners whose first language was Korean. Their data comprised analytic scores on both modes (on Fluency, Functional Competence, Accuracy, Coherence, Interactiveness) and test-taker feedback on ‘anxiety’ in the two modes, operationalised as ‘nervousness’ before/after the test and ‘comfort’ with the interviewer, test environment and speaking test (Craig & Kim, 2010: 17). They found no statistically significant difference between global and analytic scores on the two modes, and interview data indicated that most test-takers ‘were comfortable with both test modes and interested in them’ (Kim & Craig, 2012: 268). However, in terms of test-taker anxiety, a significant difference emerged, with anxiety before the face-to-face mode found to be higher, thus providing some evidence to support Ockey et al.’s hypothesis.
There are several implications of the empirical findings mentioned above for the successful use of video-conferencing in assessment settings. Firstly, these insights signal the need for explicit tutoring in how to use video-conferencing, with a focus on body language and facial expressions. Warm-up sessions and tutorials for participants - both learners and instructors/examiners - seem essential in order to increase familiarity with the video-conferencing experience (Lee, 2007). Secondly, they indicate that supportive conditions need to be created for effective interaction, such as the need to provide scaffolding in the case of communication breakdowns. Thirdly, the level of English competence of the students needs to be taken into consideration, with a minimal language threshold defined for the use of video-conferencing in language learning (and assessment). Finally, the role of affective factors involved in the experience should not be underestimated, since that can affect the success of the video-conferencing experience. It is therefore vital to collect evidence on test takers’ perceptions of taking a VC test.
The current study: research questions
Following completion of the Phase 2 study, and in preparation for this third study, the same experienced IELTS examiner trainer was commissioned to develop further materials for examiner training in the use of VC delivery. Training materials to prepare candidates for the VC delivered speaking test were also adapted and translated into Spanish. In addition, technical requirements, such as the development of on-screen prompts and appropriate delivery mechanisms, were initiated.
Based on findings from Phases 1 and 2 that the mode of test delivery has no significant impact on the scores achieved by test-takers, the study reported here is a follow-up investigation designed for four main purposes to:
- confirm how well the scoring validity of the VC tests is supported by the four facets modelled (i.e. test-taker, rater, test version and rating category) in a Many-Facet Rasch Model (MFRM) analysis
- investigate the effect of perceptions of sound quality on scores
- investigate perceptions of the newly developed on-screen prompts by examiners and test-takers
- examine the effectiveness of the extended training for the VC test for examiners and test-takers.
To support the four purposes of this phase of the study, the research questions that we will address in Phase 3 are as follows:
- How well is the scoring validity of the video-conferencing tests supported by the four-facet MFRM analysis (i.e. test-taker, rater, test version and rating category)?
- To what extent did sound quality affect performance on the videoconferencing test (as perceived by examiners, as perceived by test-takers, as observed in test scores)?
- How did test-takers perceive the video-conferencing (VC) test, the new platform and training for the VC test?
- How did examiners perceive the video-conferencing (VC) test, the new platform and training for the VC test?
4 Methodology
As in the previous two phases of the project, this study also used a convergent parallel mixed-methods design (Creswell & Plano Clark, 2011), where quantitative and qualitative data were collected in two parallel strands, were analysed separately and findings were integrated. Figure 1 presents an overview of the Phase 3 research design, showing what data were collected, analysed and triangulated to explore and give detailed insights from multiple perspectives into various aspects of the video-conferencing delivery mode.

Figure 1: Phase 3 research design
4.1 Location and technology
Detailed discussion of the choice of locations and the development of a bespoke technological solution for delivery of the IELTS test in Phase 3 of the study are beyond the scope of this report. For further information regarding the selection of Latin America, and specifically Argentina, Colombia, Mexico and Venezuela as locations for the study, plus details of the technical requirements and specifications, please see information extracted from internal reports submitted to the British Council by Patel (2016) and Ruiz (2016), reproduced in Appendix 6.
4.2 Participants
Three cohorts of volunteer test-takers participated in this study: 20 in Medellín, Colombia; 25 in Mexico City, Mexico; and 44 in Caracas, Venezuela - giving 89 test-takers in total. As requested by the research team, the 89 test-takers had balanced profiles in terms of gender and estimated IELTS Speaking test bands: 42 of them were male (47.19%), 45 were female (50.56%), gender identification of two test-takers was missing (2.25%). The overall mean age was 30.53 (SD=8.42). The range of the live IELTS Speaking scores (rounded overall Speaking scores) of these test-takers was from Band 4.0 to Band 8.5 (Mean=6.15, SD=0.915), and the distribution of scores was reasonably normal (see Figure 3 in Section 5.1).
Eight trained, certificated and experienced IELTS examiners (i.e. Examiners K-R), also participated in the research, with permission from IELTS managers. Four examiners conducted interviews in Bogotá, Colombia, and the other four carried out interviews in Buenos Aires, Argentina.
Table 1 summarises the data collection arrangements of this research. Each examiner had originally been scheduled to interview 13 test-takers in one of the four days of data collection but, for a variety of reasons, not all 104 test-takers who originally signed up were able to participate, eventually leaving a total of 89 test-takers to be assessed by the four examiners.
Table 1: Examiner and test-taker arrangements
| Date of data collection | Examiner ID | Examiner location | Test-taker location | No. of candidates |
|---|---|---|---|---|
| Day 1 (26 April 2016) | Examiners Q and R | Bogotá | Medellín | 20 |
| Day 2 (28 April 2016) | Examiners O and P | Bogotá | Mexico | 25 |
| Day 3 (5 May 2016) | Examiners L and N | Buenos Aires | Caracas | 23 |
| Day 4 (6 May 2016) | Examiners K and M | Buenos Aires | Caracas | 21 |
| TOTAL | 89 |
4.2.1. Participants experience with the Internet and VC technology
Unlike Phases 1 and 2 of the study, Phase 3 focused only on the video-conferencing mode of delivery of the IELTS Speaking test. Consequently, it was critical to determine from the outset, participants’ relative experience of using the Internet and VC technology.
Examiners’ and test-takers’ experience with the Internet and VC technology was self-reported in questionnaires. As shown in Table 2 and Figure 2, both the examiners and test-takers use the Internet almost ‘everyday’ for social purposes (Q1 Mean=4.88 and 4.38, respectively). However, when it comes to the use of the Internet for teaching and studying purposes, while the test-takers use it almost ‘everyday’, the examiners’ use was limited to ‘once or twice a week’ (Q2 Mean=4.28 and 2.88).
The use of VC technology was more comparable between the two groups. Both the examiner and test-taker groups use video-conferencing for social purposes ‘once or twice a week’ (Q3 Mean=3.00 and 2.54), but the use of it for teaching and studying was rather limited, with an average use of ‘never’ to ‘once or twice a week’ (Q4 Mean=1.63 and 1.63).
Table 2: Participants’ experience with the Internet and VC technology
| Participants | N | Mean | SD | ||
|---|---|---|---|---|---|
| Q1 | How often do you use the Internet socially to get in touch with people?(1.Never - 3.Once or twice a week - 5.Everyday) | Examiners | 8 | 4.88 | 0.35 |
| Q1 | How often do you use the Internet socially to get in touch with people?(1.Never - 3.Once or twice a week - 5.Everyday) | Test-takers | 87 | 4.38 | 0.99 |
| Q2 | How often do you use the Internet to teach (examiners) / for your studies (test-takers)?(1.Never - 3.Once or twice a week - 5.Everyday) | Examiners | 8 | 2.88 | 1.64 |
| Q2 | How often do you use the Internet to teach (examiners) / for your studies (test-takers)?(1.Never - 3.Once or twice a week - 5.Everyday) | Test-takers | 87 | 4.28 | 1.03 |
| Q3 | How often do you use video-conferencing (e.g. Skype, Facetime) socially to communicate with people?(1.Never - 3.Once or twice a week - 5.Everyday) | Examiners | 8 | 3.00 | 0.93 |
| Q3 | How often do you use video-conferencing (e.g. Skype, Facetime) socially to communicate with people?(1.Never - 3.Once or twice a week - 5.Everyday) | Test-takers | 87 | 2.54 | 1.11 |
| Q4 | How often do you use video-conferencing to teach (examiners) / for your studies (test-takers)?(1.Never - 3.Once or twice a week - 5.Everyday) | Examiners | 8 | 1.63 | 0.92 |
| Q4 | How often do you use video-conferencing to teach (examiners) / for your studies (test-takers)?(1.Never - 3.Once or twice a week - 5.Everyday) | Test-takers | 86 | 1.63 | 0.97 |

Figure 2: Participants’ experience with the Internet and VC technology
From the frequency responses of both examiners and test-takers, it became clear that Internet and video-conferencing familiarity was unlikely to constitute a negative issue in this research.
4.3 Materials
Five versions of the IELTS Speaking test (i.e. Travelling, Success, Teacher, Film, Website) were used1 and, as in operational IELTS Speaking tests, the examiners were asked to use the five versions in a randomised order. All five versions are retired tests obtained from Cambridge English Language Assessment.
4.4 Data collection
4.4.1 Test scores
Examiners in the live tests2 awarded scores on each analytic rating category (i.e. Fluency and Coherence, Lexical Resource, Grammatical Range and Accuracy, Pronunciation), according to the standard assessment criteria and rating scales used in operational IELTS tests. In the interest of space, the rating categories are hereafter referred to as Fluency, Lexis, Grammar and Pronunciation.
In addition to the live examiner mark, all test sessions were double-marked by one additional examiner using video-recorded performances. Special care was taken to design a double-marking matrix in order to obtain sufficient overlap between examiners for performing Many-Facet Rasch Model analysis (MFRM; see Section 5.1.2). The double-marking matrix was re-created after completion of the live examinations since the local administrators were unable to follow the exact assignment of test-takers to each of the eight examiners. In the revised double-marking matrix (see Appendix 1), each examiner carried out double marking of 10-13 test-takers.
4.4.2 Test-taker feedback questionnaires
On completion of the VC Speaking Test, all test-takers completed a questionnaire with the assistance of an administrative assistant if needed (see Appendix 2). The questionnaire consisted of 13 questions and test-takers were also asked to elaborate on their responses wherever appropriate. The first four questions (Q1-Q4) asked about their experience with technology and video-conferencing (see Table 2 in Section 4.2.1 for their responses to these questions). The next two questions (Q5-Q6) related to the usefulness of the test-taker guidelines.
The final seven questions (Q7-Q13) related to their feelings and experiences while taking the test, their perceptions of the sound quality and the extent to which they thought the quality of the sound in the VC test affected their performances, and finally, their opinion of the clarity of the on-screen prompt. Completion of the questionnaire took between five and ten minutes depending on the number of free responses given.
4.4.3 Examiner feedback questionnaires
Examiners responded to two questionnaires. The first was the examiner training feedback questionnaire (see Appendix 3) that they completed immediately following the training session provided prior to the four test days. The training feedback questionnaire had seven questions relating to the usefulness of the training session. A free comments space was also available for them to elaborate on their responses.
The second questionnaire was for the actual test administration and rating under the VC condition. After finishing all speaking tests, examiners were asked to complete an examiner feedback questionnaire (see Appendix 4) consisting of four parts. Part 1 (Q1-Q4) asked about their experience with technology and video-conferencing (see Table 2 in Section 4.2.1 for their responses to these questions). Part 2 (Q5-Q15) concerned their experience of administering the test and their behaviour as an interlocutor under the VC condition, as well as the extent to which they thought the training session had prepared them to administer the test. Part 3 (Q16-Q27) related to their experiences of rating the VC test and their preparedness based on the training that they had received. Part 4 (Q28-Q32) asked them to reflect on their previous experience of delivering the standard face-to-face IELTS Speaking test and consider their perceptions towards the two test delivery modes. The questions in Parts 2-4 were followed by free comments boxes requesting further elaboration. The questionnaire took approximately 20 minutes for examiners to complete.
4.4.4 Examiner focus group discussions
On completion of administering the VC Speaking tests, all examiners took part in paired focus-group discussions facilitated by trained, local British Council staff. On Days 1 and 2, examiners Q & R and O & P participated in discussions in Bogotá. On Days 3 and 4, examiners L & N and K & M participated in discussions in Buenos Aires. The discussions were semi-structured and were designed to achieve further elaboration of the comments made in the examiner feedback questionnaire relating to technical issues, in particular sound quality perceptions, examiner behaviour including the use of gestures and perceptions of the two modes of IELTS Speaking test delivery, especially issues relating to stress and comfort levels in the two modes.
This section has illustrated an overview of the data collection methods, to provide an overall picture of the research design. The next section will describe the methods used for data analysis.
4.5 Data analysis
4.5.1 Score data analysis
In order to address RQ1 (How well is the scoring validity of the video-conferencing tests supported by the four-facet MFRM analysis, i.e. test-taker, rater, test version and rating category?), scores awarded under the VC condition were first analysed descriptively, using SPSS 22 (IBM, 2013). Scores were then analysed by Many-Facet Rasch Model analysis (MFRM) using the FACETS 3.71 analysis software (Linacre, 2013). MFRM analysis offers accurate insights into the extent to which the scoring validity of the VC tests can be supported, by assessing examiner consistency and severity, and consistency and difficulty across the 5 test versions and the 4 analytic rating scales. As noted above, sufficient connectivity in the dataset to enable the MFRM analysis was achieved through the examiners’ double-marking system.
4.5.2 Test-taker feedback questionnaires
Closed questions in the test-taker feedback questionnaire were analysed using descriptive and inferential statistics to understand their perceptions of the sound quality and its possible effect on their test scores (RQ2: To what extent did sound quality affect performance on the video-conferencing test, as perceived by …. test-takers ….?), the effectiveness of the training for the VC test and any trends in their test-taking experience in the VC delivery mode (RQ3: How did test-takers perceive the videoconferencing (VC) test, the new platform and training for the VC test?). Their open-ended comments were used to interpret and elaborate on the statistical results and to illuminate the results obtained from other data sources.
Whenever appropriate, test-takers’ feedback responses were compared to those obtained in the Phase 1 and Phase 2 studies, in order to identify the effectiveness of the training provided in this phase of the study and highlight any ongoing issues.
4.5.3 Examiner feedback questionnaires
As with the test-taker feedback questionnaires, the examiner training feedback questionnaire and the examiner feedback questionnaire were analysed to inform RQ2 (To what extent did sound quality affect performance on the video-conferencing test, as perceived by examiners….?), and RQ4 (How did examiners perceive the videoconferencing (VC) test, the new platform and training for the VC test?). Closed questions in both questionnaires were analysed statistically, and open-ended comments were used to interpret and elaborate on the statistical results and to illuminate the results obtained by other data sources. Wherever possible, the results were compared with those of the Phase 1 and Phase 2 studies.
4.5.4 Examiner focus group discussions
All four focus group discussions were recorded but, due to technical problems beyond our control, the sound on one of the recordings was unintelligible. Consequently, only three discussions could be fully transcribed and reviewed by the researchers to identify key topics and perceptions discussed by the examiners. These topics and perceptions were then captured in spreadsheet format, so they could be coded and categorised according to different themes, such as ‘extra time required to administer the VC test’ and ‘suggested modifications for the VC test’, in order to inform RQ4 (How did examiners perceive the VC test, the new platform and the effect of examiner training?).
5. Results
5.1 Score results
5.1.1 Initial descriptive analysis of test scores
Figures 3 and 4 present the overall Speaking scores that test-takers received during the live tests, and the average overall Speaking scores of live and double marking, respectively. As in the operational IELTS tests, the overall Speaking scores in Figure 3 are rounded down (i.e. where 6.75 becomes 6.5, 6.25 becomes 6.0, etc.), but Figure 4 shows mean live and double-marked Speaking scores.
The mean of the overall Speaking scores during the live tests was 6.15 (SD=0.915, N=89) and the mean of the average overall Speaking scores under the live and double-marking conditions was 6.14 (SD=0.849, N=823). Therefore, the South American cohort in this phase of the research scored approximately one band higher than the Chinese cohort in Phase 2 (VC condition: Mean=5.04, SD=0.967, N=99; see Nakatsuhara et al., 2017b). However, the scores of the South American cohort were similar to those obtained by the first multi-national cohort in London (VC condition: Mean=6.57, SD=.982, N=32; see Nakatsuhara et al., 2016).

Figure 3: Live Speaking test scores: overall (rounded down)
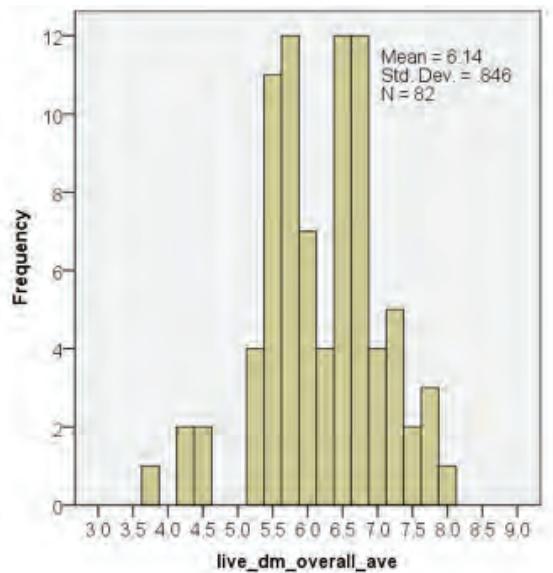
Figure 4: Average of live and double-marking Speaking scores: overall (not rounded)
5.1.2 Many-Facet Rasch Model (MFRM) Analysis
Following the descriptive analysis of test scores, MFRM analyses were carried out, using a rating scale model with 4 facets for score variance: test-takers, test versions, examiners, and rating scales, to address RQ1: How well is the scoring validity of the video-conferencing tests supported by the four-facet MFRM analysis (i.e. test-taker, rater, test version and rating category)?
Figure 5 shows the overview of the results of the 4-facet rating scale model analysis, plotting estimates of test-taker ability, test version difficulty, examiner harshness, and rating scale difficulty. They were all measured by the uniform unit (logits) shown on the left side of the map labelled “measr” (measure), making it possible to directly compare all the facets. In Figure 5, the more able test-takers are placed towards the top and the less able towards the bottom. All the other facets are negatively scaled, placing the more difficult items and harsher examiners towards the top.

Figure 5: All facet vertical rulers (4-facet analysis with a rating scale model)
As shown in Tables 3 to 5 below, the FACETS program produces a measurement report for each facet in the model. The reports include the difficulty of items in each facet in terms of the Rasch logit scale (Measure) and Fair Averages, which indicate expected average raw score values transformed from the Rasch measures. It also shows the Infit Mean Square (Infit MnSq) index which is commonly used as a measure of fit in terms of meeting the assumptions of the Rasch model. Although the program provides two measures of fit, Infit and Outfit, only Infit is addressed here, as it is less susceptible to outliers in terms of a few random unexpected responses. Unacceptable Infit results are thus more indicative of some underlying inconsistency in an element.
Infit values in the range of 0.5 to 1.5 are ‘productive for measurement’ (Wright & Linacre, 1994), and the commonly acceptable range of Infit is from 0.7 to 1.3 (Bond & Fox, 2007). Infit values for all items included in the four facets fall within the acceptable range, except for Examiner N, who was slightly overfitting (Infit Mnsq=0.62) rather than misfitting, indicating that his scores were too predictable. Overfit is not productive for measurement but it does not distort or degrade the measurement system.
The lack of misfit gives us confidence in the results of the analyses and the Rasch measures derived on the common scale. This suggests lack of systematic inconsistency in test scores, and provides further evidence for the scoring validity of the VC tests conducted in this phase of the project.
Table 3: Test version measurement report
| Measure | Real S.E. | Observed Average | Fair (M) Average | Infit MnSq | |
|---|---|---|---|---|---|
| Success | -.25 | .15 | 6.26 | 6.17 | .95 |
| Travelling | -.15 | .16 | 6.21 | 6.14 | .89 |
| Website | -.06 | .17 | 6.13 | 6.12 | .88 |
| Film | .05 | .17 | 6.11 | 6.09 | 1.06 |
| Teacher | .40 | .22 | 5.85 | 5.00 | 1.14 |
| Fixed (all same) chi-square: 6.9, d.f.: 4, significance: .14 |
Table 4: Examiner measurement report
| Measure | Real S.E. | Observed Average | Fair (M) Average | Infit MnSq | |
|---|---|---|---|---|---|
| Examiner Q | -1.40 | .20 | 6.69 | 6.50 | .92 |
| Examiner O | -.45 | .24 | 6.52 | 6.22 | 1.31 |
| Examiner R | -.41 | .23 | 6.17 | 6.21 | 1.03 |
| Examiner P | .06 | .21 | 6.16 | 6.08 | .91 |
| Examiner M | .13 | .20 | 5.96 | 6.07 | .95 |
| Examiner N | .34 | .22 | 6.00 | 6.01 | .62 |
| Examiner L | .35 | .22 | 5.85 | 6.01 | 1.08 |
| Examiner K | 1.38 | .22 | 5.72 | 5.74 | .92 |
Fixed (all same) chi-square: 103.5, d.f.: 7, significance: .00 Inter-rater agreement opportunities: 328 Exact agreements: 136 = 41.5% Expected: 160.3 = 48.9%
Table 5: Rating scales measurement report
| Measure | Real S.E. | Observed Average | Fair (M) Average | Infit MnSq | |
|---|---|---|---|---|---|
| Fluency | -.38 | .15 | 6.25 | 6.20 | 1.08 |
| Pronunciation | -.15 | .15 | 6.18 | 6.14 | .91 |
| Lexis | .11 | .15 | 6.11 | 6.07 | 1.05 |
| Grammar | .42 | .15 | 6.03 | 5.99 | .84 |
Fixed (all same) chi-square: 15.8, d.f.: 3, significance: .00
Three observations can be made from Tables 3 to 5. Firstly, the five versions used in this phase of the research were comparable in terms of difficulty. Secondly, the eight examiners differed significantly in their severity. Of the eight examiners, Examiner Q was the most lenient (Fair average=6.50) and Examiner K was the harshest (Fair average=5.74), indicating the difference of 0.76 in fair average scores which is larger than the examiner severity differences identified in Phases 1 and 2 (0.36 in Phase 1 and 0.52 in Phase 2). However, such severity differences among examiners are commonly found in speaking assessment and have been described by McNamara as ‘a fact of life’ (1996:127) since ‘rating remains intractably subjective’ (McNamara, 2000:37). Lastly, the four rating categories differed significantly in their difficulty levels. The Fluency category turned out to be the easiest, followed by Pronunciation, Lexis and Grammar, but the fair average differences were negligibly small (Fluency: 6.25, Grammar: 6.03).
5.1.3 Summary of score results
The main findings of the score analyses are summarised below.
a) Dataset
The range of proficiency levels of the Phase 3 participants was higher than that of Phase 2 in China. The wide range of proficiency (Bands 4.0-8.5), with many of the test-takers scoring around Bands 5.5, 6.0 and 6.5, represents a range typical of international IELTS candidates4.
b) MFRM analysis with FACETS
MFRM analyses were carried out, using a rating scale model with 4 facets for score variance: test-takers, test versions, examiners, and rating scales. There was no misfitting item in any facet. This is encouraging as lack of misfit in these MFRM analyses is associated with unidimensionality (Bonk & Ockey, 2003) and lack of systematic inconsistency.
The results of the MRFM analysis provide further evidence of the scoring validity of the VC delivered IELTS Speaking test. However, a difference of 0.76 in severity between examiner/raters gives cause for concern and possible ways of minimising it should be considered, such as full or partial double marking. This is in line with the suggestions made following the Phase 2 study (Nakatsuhara et al., 2017b).
While the differences observed may be related to mode of delivery of the Speaking test, it is equally feasible that there may be other issues at play. In order to explore this further, additional analysis of these data is required.
5.2 Sound quality analysis
We now report on the analysis and findings on sound quality and its perceived and actual effects on test performance, to address RQ2: To what extent did sound quality affect performance on the test: as (a) perceived by examiners, (b) as perceived by test-takers, (c) as observed in test scores?
- See https://www.ielts.org/ teaching-and-research/test taker-performance for mean band scores for male and female test-takers and mean band scores by country.
5.2.1 Perceptions of sound quality by examiners and test-takers
As in the Phase 2 research, the following two questions5 were included in the examiner’s rating sheet and the test-taker feedback questionnaire, and they were asked to elaborate on their responses if they wished.
Q1. Do you think the quality of the sound in the VC test was… [1. Not clear at all, 2. Not always clear, 3. OK, 4. Clear, 5. Very clear]
Q2. Do you think the quality of the sound in the VC test affected test-takers’ (or ‘your’ in the test-taker questionnaire) performance?
[1. No, 2. Not much, 3. Somewhat, 4. Yes, 5. Very much]
Table 6 shows the perception of sound quality and its effect on performance by the examiners and test-takers. Table 6: Sound quality perception by examiners and test-takers
| Perceived by | Mean | SD | Paired samples t-test | |
|---|---|---|---|---|
| Q1. Sound quality[1. Not clear at all, 2. Not always clear, 3. OK, 4. Clear, 5. Very clear] | Examiners | 3.98 | 0.64 | t(79)=1.03, p=0.306 (n.s.) |
| Q1. Sound quality[1. Not clear at all, 2. Not always clear, 3. OK, 4. Clear, 5. Very clear] | Test-taker | 3.83 | 1.21 | t(79)=1.03, p=0.306 (n.s.) |
| Q2. Affecting performance[1. No, 2. Not much, 3. Somewhat, 4. Yes, 5. Very much] | Examiners | 1.73 | 0.81 | t(78)=-0.88, p=0.384 (n.s.) |
| Q2. Affecting performance[1. No, 2. Not much, 3. Somewhat, 4. Yes, 5. Very much] | Test-taker | 1.86 | 1.20 | t(78)=-0.88, p=0.384 (n.s.) |
The mean values for Q1 indicate that both the examiners (M=3.98) and test-takers (M=3.83) felt that the sound quality was on average ‘clear’. Although the examiners seemed to perceive it as being slightly better than the test-takers, the mean difference was not statistically significant. Similarly, there was no significant difference for their perceptions about the extent to which the sound quality impacted test-takers performance, and the average response by both the examiners (M=1.73) and test-takers (M=1.86) was ‘not much’. The results contrast with our Phase 2 results which showed significant differences between examiner and test-taker perceptions of sound quality and its’ effect on test-taker performance (i.e. better sound quality perceived by examiners, larger effect of sound quality perceived by test-takers).
5.2.2 Perceptions of sound quality re: test-taker proficiency
Test-takers were then divided into three groups according to their overall VC test scores: Low (Band 5.5 and below), Medium (Between Band 6 and Band 6.5) and High (Band 7 and above). This was to see whether there were any differences in the perception of sound quality across the three proficiency groups. Table 7 shows that there was no difference across the three proficiency groups in terms of the sound quality perception by any of the groups (Q1). When it came to the perception of the sound quality affecting performance, ANOVA indicated that low level test-takers (Band 5.5 and below) thought that sound quality affected them more than the Medium (Band 6.0-6.5) or High (Band 7.0 and above) level groups did (Q2). However, none of the post-hoc tests with Tukey HSD showed significant differences between groups.
Table 7: ANOVA on test-takers’ proficiency levels and sound quality perception by examiners and test-takers
| Prof level | Mean | SD | ANOVA | Post-hoc test (Tukey HSD) | |
|---|---|---|---|---|---|
| Q1: Sound quality [1. Not clear at all, 2. Not always clear, 3. OK, 4. Clear, 5. Very clear] | |||||
| Examiners | Low (N=28) | 3.82 | 0.67 | F(2,80)=1.30, p=0.28 | - |
| Examiners | Medium (N=36) | 4.06 | 0.58 | F(2,80)=1.30, p=0.28 | - |
| Examiners | High (N=19) | 4.05 | 0.62 | F(2,80)=1.30, p=0.28 | - |
| Test-takers | Low (N=27) | 3.93 | 1.11 | F(2,82)=0.14, p=0.87 | - |
| Test-takers | Medium (N=39) | 3.87 | 1.28 | F(2,82)=0.14, p=0.87 | - |
| Test-takers | High (N=19) | 3.74 | 1.19 | F(2,82)=0.14, p=0.87 | - |
| Q2: Affecting performance [1. No, 2. Not much, 3. Somewhat, 4. Yes, 5. Very much] | |||||
| Examiners | Low (N=27) | 1.81 | .879 | F(2,79)=0.62, p=0.54 | - |
| Examiners | Medium (N=37) | 1.78 | .854 | F(2,79)=0.62, p=0.54 | - |
| Examiners | High (N=18) | 1.56 | .616 | F(2,79)=0.62, p=0.54 | - |
| Test-takers | Low (N=27) | 2.33 | 1.33 | F(2.82)=3.19, p=0.46 partial eta sq=0.72 | Low vs Med (p=0.08) Low vs High (p=0.08) Med vs High (p=0.93) |
| Test-takers | Medium (N=39) | 1.69 | 1.08 | F(2.82)=3.19, p=0.46 partial eta sq=0.72 | Low vs Med (p=0.08) Low vs High (p=0.08) Med vs High (p=0.93) |
| Test-takers | High (N=19) | 1.58 | 1.07 | F(2.82)=3.19, p=0.46 partial eta sq=0.72 | Low vs Med (p=0.08) Low vs High (p=0.08) Med vs High (p=0.93) |
Table 8 summarises correlations between test-takers’ proficiency levels and examiners and test-taker’s perceptions of sound quality (Q1) and its effect on test-taker performance (Q2).
Table 8: Correlations between test-takers’ proficiency levels and examiner/test-taker perceptions of sound quality
| Perceived by | Pearson correlation with test-taker s prof. level | |
|---|---|---|
| Q1. Sound quality[1. Not clear at all, 2. Not always clear, 3. OK, 4. Clear, 5. Very clear] | Examiners | r=0.12, N=83, p=0.28 |
| Q1. Sound quality[1. Not clear at all, 2. Not always clear, 3. OK, 4. Clear, 5. Very clear] | Test-taker | r=0.01, N=85, p=0.96 |
| Q2. Affecting performance[1. No, 2. Not much, 3. Somewhat, 4. Yes, 5. Very much] | Examiners | r=-0.11, N=82, p=0.31 |
| Q2. Affecting performance[1. No, 2. Not much, 3. Somewhat, 4. Yes, 5. Very much] | Test-taker | r=-0.28, N=85, p=0.01 (sig.) |
The results also confirm the ANOVA results above, indicating a significant negative correlation between test-takers’ perception of the impact of sound quality and their proficiency level (r=-0.28, p=0.01), although the correlation was relatively low. Therefore, despite the comparable experience reported for Q1, there was a weak tendency for lower proficiency-level test-takers to feel that their performance was more susceptible to sound quality (Q2). This is understandable, as even slight lack of clarity in examiner input could be a source of communication breakdown for weaker test-takers, while this could easily be rectified by higher-level test-takers who are likely to be more able to compensate for the gap of understanding based on context or background knowledge. They may also be more capable of initiating repairs by making clarification requests effortlessly. This means that, contrary to the observation made in the first phase of the project, lower proficiency-level test-takers did not blame their limited performance on the poor quality of sound in the VC test (Q1). However, they felt that their performance was slightly more susceptible to sound quality than higher proficiency-level test-takers.
To summarise, the sound quality analysis in this study confirms our Phase 2 result that the VC technology generally functioned sufficiently well to enable the speaking test to be delivered in this mode. On average, the sound quality was perceived as ‘clear’ by both the examiners and test-takers. Unlike the Phase 2 research, sound quality perceptions between the examiners and test-takers were not significantly different. There may be various reasons for the more comparable perceptions, but one reason could be the introduction of the bespoke platform in this phase of the project, which might have helped offer a more comparable experience to the examiners and test-takers. Furthermore, in line with the Phase 2 results, the examiner and test-taker perceptions of sound quality (Q1) did not differ significantly across different levels of test-taker ability. However, it seems that weaker test-takers felt that their performance might be more easily affected by the sound quality problems that they might encounter.
5.2.3 Perceptions of sound quality and problems encountered during test administration
Although the VC technology in this study appeared to function well, and the sound quality was perceived positively in as much as it was not considered to have impacted on scores awarded, nevertheless it should be noted that 70 out of the 89 test sessions had some technical problems as reported by the examiners. Although some problems seemed relatively minor, we cannot ignore the fact that nearly 80% of the sessions encountered some problems.
Examiners’ comments on technical and sound problems encountered are presented in full in Appendix 5, but selected comments are presented below, under two categories:
(i) comments relating to sound delays, (ii) comments relating to image freezing.
i) Comments relating to sound delays
- Slight delay 1-2 secs (ExQ, C007)
- Consistent delays in audio/video. This seemed to affect the candidate. (ExR, C016)
- Slight delay in sound - a little echo/delay when I spoke to candidate. (ExO, C024)
- Delay continues to be the main problem. I find it more difficult to come up with questions (part 3) than usual. (ExP, C035)
- Some problem with delay and synching of video/sound - this was more apparent at the beginning. (ExN, C062)
- Still a slight delay of 3/4 seconds and so we interrupted each other a lot. (ExM, C094)
ii) Comments relating to image freezing
- One small freeze, generally OK. (ExQ, C017)
- There were a few times when the image froze but the audio was on, so it was not much of a problem. (ExP, C036)
- Image froze. I can hear the candidate and she can hear me, so carried on until the end of Part 2 - then called the administrator and asked for help. (ExL, C054)
- Video froze for a few seconds in the middle. (ExN, C060)
- Image froze at some points but audio was OK. (ExK, C076)
- At one point the image froze. We just carried on. (ExM, C088)
Given that the IELTS Speaking test is a high-stakes test, the fact that almost 80% of the sessions had some problems, albeit generally seen as minor, does raise concerns and should be addressed carefully if the VC mode is to be operationalised in the future.
Of course, in any test that relies on technology, some glitches will inevitably occur, and ways should be considered for minimising and/or handling them, such as providing further guidelines for examiners and test-takers.
5.3 Perceptions of video-conferencing test, training and guidelines
We have thus far looked at data related to test-takers’ scores (RQ1), test-takers’ and examiners’ perception of sound quality and the possible effect that this may have had on performances and scores awarded (RQ2). We now turn our attention to RQ3: How did test-takers perceive the video-conferencing (VC) test, the new platform and training for the VC test?
5.3.1 Test-takers’ perceptions of the VC test
Table 9 shows the test-takers’ perceptions of the training guidelines we provided prior to the test. As described in Section 1.2.3, the guidelines in this study were slightly revised based on the recommendations from our Phase 2 research and to be suited to the new delivery platform used in this study. It appears that the revisions worked well, since the test-takers in this study thought that the guidelines were on average ‘useful’ (Q5 M=4.07) and they found the picture in the guidelines ‘helpful’ (Q6 M=3.93), and both the means increased from those of Phase 2 (M=3.87 and 3.65, respectively).
Table 9: Test-takers’ perceptions of the test-taker guidelines for the VC test
| N | Mean | SD | ||
|---|---|---|---|---|
| Q5 | Were the test-taker guidelines for the test… (1.Not useful - 3.OK - 5.Very useful) | 87 | 4.07 | 0.96 |
| Q6 | Was the picture in the guidelines… (1.Not helpful - 3.OK - 5.Very helpful) | 84 | 3.93 | 1.15 |
The test-takers also seemed to perceive the VC test positively. As shown in Table 10, on average they almost always understood the examiner (Q7 M=4.46), they found taking the VC test ‘OK’ to ‘comfortable’ (Q8 Mean: 3.46). These questions were also included in the Phase 2 feedback questionnaire, and it was encouraging to find that the Phase 3 feedback was more positive than that of Phase 2 (M=3.76 and 3.15, respectively). The Phase 3 test-takers also reported that they found the VC test ‘easy’ (Q9 Mean: 3.89) and felt ‘much’ opportunity to demonstrate their speaking ability (Q10 M=4.05). As noted earlier, this study developed a bespoke platform to display Phase 2 prompts on the screen. The functionality seemed to be satisfactory, as the test-takers reported that the prompt on the screen was ‘clear’ on average (Q13 M=4.12).
Table 10: Test-takers’ perceptions of the VC test
| N | Mean | SD | ||
|---|---|---|---|---|
| Q7 | How often did you understand the examiner in the VC test?(1.Never - 3.Sometimes - 5.Always) | 87 | 4.46 | 0.76 |
| Q8 | Did taking the VC test make you feel…(1.Very nervous - 3.OK - 5.Very comfortable) | 87 | 3.46 | 1.35 |
| Q9 | Did you feel taking the VC test was…(1.Very difficult - 3.OK - 5.Very easy) | 87 | 3.89 | 0.88 |
| Q10 | Did you feel you had enough opportunity in the VC test to demonstrate your speaking ability? (1.Not at all - 3.OK - 5.Very much) | 84 | 4.05 | 1.10 |
| Q13 | In Part 2 (long turn), the prompt on the screen was…(1.Not clear at all - 3.OK - 5.Very clear) | 86 | 4.12 | 1.00 |
It can therefore be suggested that the test-taker perceptions of the VC guidelines, the VC test and the new platform were, in general, positive and that their perceptions were more positive than those of the Phase 2 research, indicating that our revisions of the guidelines and the development of the platform were successful.
The test-takers were also asked to provide open-ended comments, as well as the feedback ratings provided above. All comments are included in Appendix 2, but selected comments are presented below, under three categories: (i) comments that welcome the VC test, (ii) comments that include constructive feedback for improvements, and (iii) comments that related to the sound quality and technical concerns.
(i) Comments that welcome the VC test
- It was a good experience, modern and useful. (C002)
- In comparison with regular exam, it is very similar and could be a good solution. Not too much difference to the personal interview. (C016)
- I’d like to do this frequently. (C049)
- It was an excellent initiative and I’m proud of be part of it. I hope it will be a part of a regular way of evaluation. The interaction with native English speakers is very welcome. (C064)
- I have been presented this exam with a real teacher and is almost the same. It would be an excellent opportunity to make this project a reality because you will be evaluated for someone who has the expertise. The economical situation does not allow to have English teachers in Venezuela, so this is an excellent opportunity to have a real interaction with English professors abroad. (C090)
(ii) Comments that include constructive feedback for improvements
- I think the guidelines has lot of information and in some cases I didn’t read properly, also I think is important that you cannot see the invigilators on the screen because you feel embarrassed. (C007)
- In the second part it would be nice to have a timer to manage your speech. (C009)
- In part 2, a bigger prompt on the screen would be better. (C068)
- Maybe would be better with headphones. (C086)
(iii) Comments that related to the sound quality and technical concerns
- The audio must be improve a little bit. (C057)
- I really like the idea but you need to take in consideration the problems with the connection to Internet that we have in Venezuela where is too easy to lose conversation, conferences or reading because of that. You need to guarantee that the quality of the sound from the speaker is good for the person who is taking the test. (C091)
- There was 3 moments where the transmission freeze. (C094)
5.3.2 Examiners’ perceptions of the VC test
After the examiners finished the training session and the VC tests, their feedback was collected through questionnaires and focus group discussions to address RQ4: How did examiners perceive the VC test, the new platform and training for the VC test? The results from the questionnaires are presented in conjunction with excerpts from the free comment boxes on the questionnaires and comments made in the focus group discussions.
Regarding the content of the VC training they received, all eight examiners found it useful, clear and helpful, as shown in Table 11, which summarises the results of the Examiner Training Feedback Questionnaire (see Appendix 3).
Table 11: Results of Examiner Training Feedback Questionnaire
| 1. Strongly disagree | 2. Disagree | 3. Neutral | 4. Agree | 5. Strongly agree | ||
|---|---|---|---|---|---|---|
| Q1 | I found the training session useful. | 0 (0.00%) | 0 (0.00%) | 0 (0.00%) | 0 (0.00%) | 8 (100%) |
| Q2 | The differences between the standard f2f test and the VC test were clearly explained. | 0 (0.00%) | 0 (0.00%) | 0 (0.00%) | 0 (0.00%) | 8 (100%) |
| Q3 | What the VC room will look like was clearly explained. | 0 (0.00%) | 0 (0.00%) | 0 (0.00%) | 3 (37.5%) | 5 (62.5%) |
| Q4 | VC specific techniques (e.g. use of preamble, back-channelling, gestures, how to interrupt) were thoroughly discussed. | 0 (0.00%) | 0 (0.00%) | 0 (0.00%) | 0 (0.00%) | 8 (100%) |
| Q5 | The rating procedures in the VC test were thoroughly discussed. | 0 (0.00%) | 0 (0.00%) | 0 (0.00%) | 0 (0.00%) | 8 (100%) |
| Q6 | The training videos that we watched together were helpful. | 0 (0.00%) | 0 (0.00%) | 0 (0.00%) | 0 (0.00%) | 8 (100%) |
| Q7 | I had enough opportunities to discuss all my concern(s)/question(s) about the VC test. | 0 (0.00%) | 0 (0.00%) | 0 (0.00%) | 0 (0.00%) | 8 (100%) |
Also, two examiners left positive comments in the free comment box of the questionnaire:
Very clear review of procedures and relation to the VC project. (Examiner N) The training was excellent. Very thorough as all the procedures explained etc. Most useful for me was the inclusion of the training videos as this provided extra, in-depth understanding as well as a clear visual insight into the exam. I also liked the role play of mini invigilator/examiner/candidate - this eased any concerns I had and provided practice. (Examiner O)
5.3.3 Administration of the VC test
After administering the VC tests, the examiners responded to another questionnaire: Examiner Feedback Questionnaire, (see Appendix 4) on their overall experience and perceptions of the adequacy of the training in terms of test administration, rating and comparison between face-to-face and VC tests. Table 12 summarises the results (based on a 5-point Likert scale; 1: Strongly disagree, 2: Disagree, 3: Neutral, 4: Agree, 5: Strongly agree) relating to test administration. The means for all the questions are between 4 and 5, which suggests that the examiners generally felt comfortable and found it straightforward to administer the VC tests. It is also apparent that the training provided to the examiners was received positively, and the contents of the training and the selection of materials were regarded as adequate.
Table 12: Results of Examiner Feedback Questionnaire on test administration
| N | Mean | SD | ||
|---|---|---|---|---|
| Q5 | Overall I felt comfortable in administering the IELTS Speaking Test in the VC mode. | 8 | 4.38 | 0.74 |
| Q6 | Overall the examiner training adequately prepared me for administering the VC test | 8 | 4.63 | 0.74 |
| Q7 | I found it straightforward to administer Part 1 (frames) of the IELTS Speaking Test in the VC mode. | 8 | 4.50 | 0.76 |
| Q8 | The examiner training adequately prepared me for administering Part 1 of the VC test. | 8 | 4.63 | 0.52 |
| Q9 | I found it straightforward to administer Part 2 (long turn) of the IELTS Speaking Test in the VC mode. | 8 | 4.25 | 0.71 |
| Q10 | The examiner training adequately prepared me for administering Part 2 of the VC test. | 8 | 4.50 | 0.53 |
| Q11 | I found it easy to handle task prompts on the screen in Part 2 of the VC test. | 8 | 4.63 | 0.74 |
| Q12 | I found it straightforward to administer Part 3 (2-way discussion) of the IELTS Speaking Test in the VC mode. | 8 | 4.50 | 0.76 |
| Q13 | The examiner training adequately prepared me for administering Part 3 of the VC test. | 8 | 4.88 | 0.35 |
| Q14 | The examiner’s interlocutor frame was straightforward to handle and use in the VC mode. | 8 | 4.63 | 0.74 |
| Q15 | The examiner training gave me confidence in handling the interlocutor frame in the VC test. | 8 | 4.50 | 1.41 |
NB: The results of Q1 to Q4 are presented in Table 2 in Section 4.2.1.
It is worth noting, however, that Q9 on Part 2 (long turn) administration has a slightly lower mean than the other questions. While the examiners found that putting the Part 2 task prompt on the candidate’s screen was straightforward (Q11), they had “to delay two seconds to get the card up (Examiner N)” and they “had to pause while the invigilator hands over the paper and pencil so that eats into four minutes [that are allocated to Part 2] (Examiner L)” when administering Part 2.
Furthermore, Q15 revealed a higher SD than the other questions, and one of the examiners left a comment regarding why he did not feel that the examiner training gave him confidence in handling the interlocutor frame in the VC test:
I found the delays affected the timings for the Parts, especially Part 1. A few seconds delay for each question adds up and I found it difficult to deliver 3 frames [in time]. (Examiner N)
The VC mode required an extra few seconds in many aspects of administration (e.g. interrupting test-takers, putting up and taking down Part 2 prompt cards) that the face-to-face mode does not. Other examiners echoed this issue in focus group discussions, which will be discussed in Section 6.2.3.
5.3.4 Rating the VC test
Table 13 shows the results from the ‘Rating’ section of the Examiner Feedback
Questionnaire, regarding how they felt about rating test-takers on the VC tests. Again, the means for all questions are between 4 and 5, showing a high degree of agreement to the positive statements on the ease of rating scale application and the adequacy of training.
Table 13: Results of Examiner Feedback Questionnaire on rating
| N | Mean | SD | ||
|---|---|---|---|---|
| Q16 | Overall I felt comfortable in rating candidate performance in the VC test. | 8 | 4.25 | 0.46 |
| Q17 | Overall the examiner training adequately prepared me for rating candidate performance in the VC test. | 8 | 4.75 | 0.46 |
| Q18 | I found it straightforward to apply the Fluency and Coherence scale in the VC test. | 8 | 4.63 | 0.52 |
| Q19 | The examiner training adequately prepared me for applying the Fluency and Coherence scale in the VC test. | 8 | 4.63 | 0.52 |
| Q20 | I found it straightforward to apply the Lexical Resource scale in the VC test. | 8 | 4.63 | 0.52 |
| Q21 | The examiner training adequately prepared me for applying the Lexical Resource scale in the VC test | 8 | 4.63 | 0.52 |
| Q22 | I found it straightforward to apply the Grammatical Range and Accuracy scale in the VC test. | 8 | 4.63 | 0.52 |
| Q23 | The examiner training adequately prepared me for applying the Grammatical Range and Accuracy scale in the VC test. | 8 | 4.63 | 0.52 |
| Q24 | I found it straightforward to apply the Pronunciation scale in the VC test. | 8 | 4.50 | 0.76 |
| Q25 | The examiner training adequately prepared me for applying the Pronunciation scale in the VC test. | 8 | 4.63 | 0.52 |
| Q26 | I feel confident about the accuracy of my ratings in the VC test. | 8 | 4.13 | 0.99 |
| Q27 | The examiner training helped me to feel confident with the accuracy of my ratings on the VC test. | 8 | 4.63 | 0.74 |
Although some examiners felt less confident about the accuracy of their rating (Q26 with a mean of 4.13 and highest SD of 0.99), all examiners said in the focus groups that as they did more tests, they felt more comfortable and confident in rating test-takers on the VC tests. Below are some excerpts from the focus group discussions which underline this:
I feel slower with rating them [in VC tests than face-to-face tests]. Maybe because it’s new but I also felt like I need time to just go over what I’ve graded and make sure. (Examiner O) [There was not much of a problem rating on VC tests] because I was able to filter out some of the things like syncing and the delay and I was still listening to what they were saying. (Examiner N) At the beginning, I had too many concerns on my mind (connectivity, script, timing, topic card) and I didn’t feel as comfortable rating the candidate as I did earlier on in the day, once I’d become more familiar with everything I felt more relaxed. (Examiner L)
5.3.5 Comparison between VC and face-to-face tests
The final section of the Examiner Feedback Questionnaire asked the eight examiners to compare the VC tests with the face-to-face (f2f) tests that they normally conduct, and their responses are summarised in Figure 6. The majority of examiners (N=6) felt there was no difference in ease of rating between f2f and VC tests (Q30) and the majority (n=7) also felt that the VC mode gave test-takers an equal chance to demonstrate their proficiency (Q31). However, half the examiners (n=4) felt more comfortable with face-to-face tests (Q28), which is not surprising given their unfamiliarity and lack of experience with the VC mode.
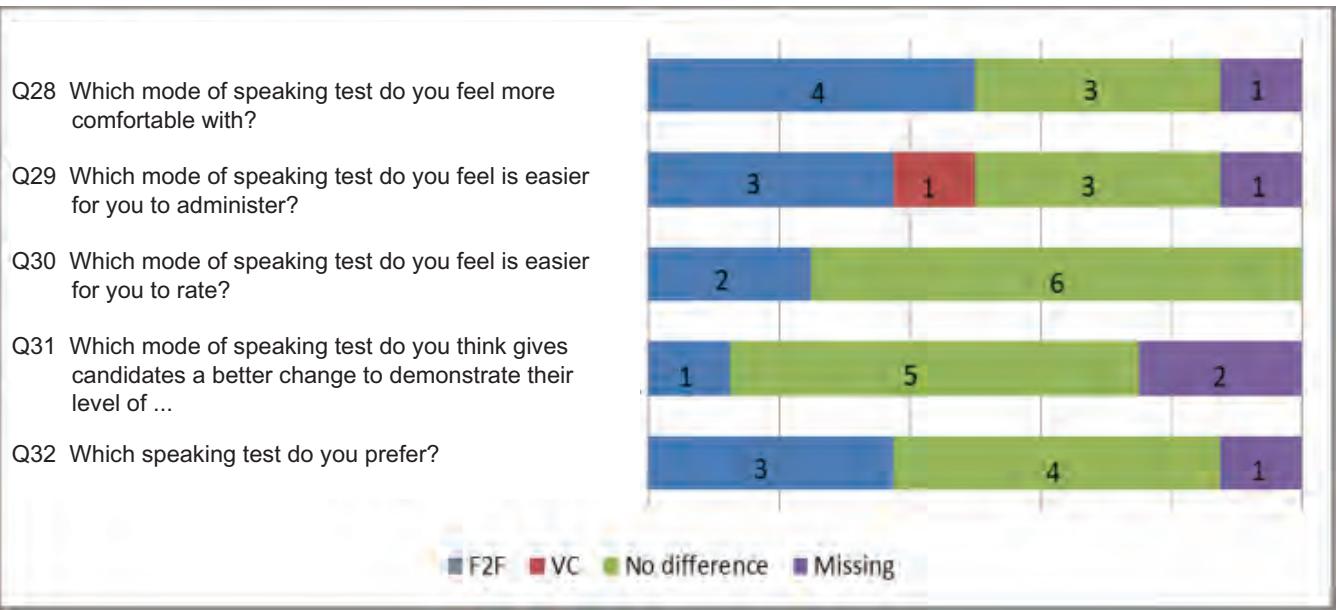
Figure 6: Results of Examiner Feedback Questionnaire on comparison between VC and face-to-face tests
From the open-ended comments box at the end of the questionnaire and the focus group discussions afterwards (excerpts below), it was clear that they felt they would find hardly any difference between the two modes if the delays are improved and they get more used to the VC tests.
I don’t think I can answer these questions (Q28 to Q32) now. I think that it’s probably a bit too early in the process to decide whether I feel comfortable administering VC tests. I certainly felt a lot more comfortable as the day progressed and even sort of forgot the candidate was not actually sitting across the table from me (last couple of interviews). I think that given a bit of time, I wouldn’t feel any difference between the two modes. For now, of course, I feel more at ease with face-to-face tests. (Examiner L) Perhaps having to remember to record both on the computer and with recording device made it a little more complicated at the beginning of the day but by the 3rd or 4th candidate I was fine. When there is a slight delay, it often meant we were speaking at the same time on occasions. However, this was only true with a few candidates. (Examiner M) At this moment, I have to say face-to-face is my preference. However, if the delays between asking the questions and the candidates hearing the questions was reduced then I wouldn’t mind either delivery method. (Examiner N) I expected posture and eye-contact would feel awkward in VC speaking tests but wasn’t like that. Once you get used to the delay, and therefore are able to avoid overlapping, the interaction seems as natural as if you are in the same room as the candidates. (Examiner K)
I think I would just need more time getting used to this platform. Most of my answers are pro f2f. Also, I think if there were less delays, there would be no difference. (Examiner O)
5.3.6 Suggestions for modifications for the VC mode
The topics covered in the focus group discussions mostly echoed the results of the feedback questionnaires, but what the focus groups uniquely elicited was comments and suggestions about potential modifications that the VC tests might benefit from. These suggestions related to timing within the test, the interlocutor frame and scheduling of IELTS tests.
Firstly, in terms of time allocated for the test, all eight examiners agreed that the four minutes allocated for Part 2 was too short in the VC tests because extra seconds are needed to put up the prompt card on the screen, wait for the invigilator to hand the paper and pencil to the test-taker for note-taking, and wait for the test-taker to give back the paper and pencil to the invigilator after the monologue. Many of them reported that it was difficult to keep to the time, and some examiners said they did not ask a rounding-off question at the end of Part 2 simply because there was simply “not enough time to ask the rounding-off question for Part 2” (Examiner Q). Examiner N suggested extending Part 2 of the VC tests by 30 seconds:
I’m not asking rounding-off questions, it’s the only way to keep it within the four minutes so my question really is: if we’re going to deliver this as scripted and there’s no modifications, if we want to deliver the rounding-off questions on a regular basis, then I think certainly for this, there needs to be an extension of time for Part 2 of about 30 seconds and make it about four and a half minutes for this version. (Examiner N)
If the VC tests become operational, it is possible that the invigilator might not be present, but if it was decided to continue with an invigilator handing out and retrieving the paper and pencil in Part 2 and to retain the rounding-off question, there might be scope for slightly extending the duration of the test, to take into consideration the fact that these delays are inherent in VC communication.
The second suggestion relates to the Interlocutor Frame in Part 2. In face-to-face IELTS tests, examiners are not allowed to add or deviate from the IF scripts, and Examiner K raised the concern that there is no non-verbal way to elicit more speech from test-takers if/when they finish early in Part 2 on the VC tests, while they can simply point to the bullet points on the topic card in face-to-face tests:
In Part 2, when a candidate gets stuck and has not covered some of the prompts, the examiner cannot “point” at the prompts not used, for example. The only possible help is [to ask] “Can you tell me more about…?” Would it be possible to include some back-up prompts in the script? (Examiner K)
The difficulty in encouraging quiet test-takers to talk more in Part 2 under the VC mode was indeed reported by examiners who participated in the previous two phases of the research too.
Another examiner suggested a one-word addition to the Interlocutor Frame in Part 2:
Slight change to the Interlocutor Frame - for example, at the end of Part 2 where it says “please give back the paper and pencil”, I would add a ‘now’ which I said… it’s just little things that make the whole thing a bit smoother. (Examiner L)
The third category of suggestions is about IELTS test scheduling. Because VC tests are heavily dependent on a stable Internet connection, it is vital to be prepared for if/when the connection fails.
This has so many possibilities of failing: poor Internet connection, or it might be an area has a power cut…so I think the administrators need to have a plan B of what they’re going to do with a candidate who couldn’t be tested on that day for whatever reason. (Examiner N) Maybe the tests can be carried out early in the day so that they have another chance later in the day. (Examiner L)
In addition, all the examiners pointed out the importance of having IT support on site, as they did for this project. Examiner O also highlighted the importance of these support people to be trained and become familiar with VC testing.
6. Conclusions
6.1 Summary of main findings
This follow-up study has carried out further exploration and comparison of test-takers’ test scores and test-taker and examiner behaviour across the VC delivery mode for the IELTS Speaking Test.
The findings for each of the research questions raised in Section 3 are summarised in Table 14.
Table 14: Summary of findings
| Research question | Findings |
|---|---|
| RQ1: How well is the scoring validity of the video-conferencing tests supported by the four-facet MFRM analysis (i.e. test-taker, rater, test version and rating category)? | Infit values for all items included in the four facets fell within the acceptable range. The lack of misfit suggests lack of systematic inconsistency in test scores, and provides further evidence for the scoring validity of the VC tests conducted in this phase of the project. |
| RQ2: To what extent did sound quality affect performance on the video-conferencing test (as perceived by examiners, as perceived by test-takers, as observed in test scores)? | Examiners and test-takers both felt that the sound quality was clear and there were no significant differences in their perceptions about the extent to which sound quality impacted on test-takers’ performance. However, lower proficiency-level test-takers felt that their performance was slightly more susceptible to sound quality than higher proficiency-level test-takers. While the sound quality was generally perceived positively, examiners reported that nearly 80% of the test sessions had some (mostly minor) technical and/or sound problems. |
| RQ3: How did test-takers perceive the video-conferencing (VC) test, the new platform and training for the VC test? | Test-takers perceived the VC test positively. The functionality of the bespoke platform was satisfactory as the prompt on the screen was reported to be clear. Revised guidelines were useful, and the pictures were helpful. |
| RQ4: How did examiners perceive the video-conferencing (VC) test, the new platform and training for the VC test? | Examiners perceived the VC test positively as they felt comfortable with it and found it easy to administer. In terms of ease of rating, 6 of the 8 examiners found no differences between the two modes and 5 of them thought both modes gave candidates equal opportunity to display their proficiency. Half of them had no preference between modes of delivery (although 3 stated that they preferred the f2f mode). There were concerns about the bespoke platform, mainly regarding the extra time required for Part 2. Training for the VC test was comprehensive, clear and useful but further training in the use of the platform and potential modifications to the interlocutor frame were recommended. |
The results of this study investigating aspects of VC delivery of the IELTS Speaking Test confirm that, in common with the findings from the Phase 1 and Phase 2 studies, the scoring validity of the IELTS Speaking test is firmly established. However, also in common with results of the Phase 1 and Phase 2 studies, this study has highlighted problems inherent in video-conferencing which must be thoroughly resolved before the mode can become operational. A number of suggestions are presented below.
6.2 Implications of the study
Discussion of the implications of the study will relate to the four purposes of the study as outlined in Section 1.2.3. These are concerned with: 1) how well the scoring validity of the VC tests is supported by the four facets modelled (i.e. test-taker, rater, test version and rating category) in a Many-Facet Rasch Model (MFRM) analysis; 2) the effect of perceptions of sound quality on scores awarded; 3) perceptions of the newly developed on-screen prompts by examiners and test-takers; and 4) the effectiveness of the extended training for the VC test for examiners and test-takers. In addition, certain other observations which we believe might be of interest and value to the test developers, will be offered for consideration.
6.2.1 Scoring validity of the video-conferencing mode of delivery
As shown in the results of Phase 1 and Phase 2 of the project and confirmed by the results obtained in this third phase, the four facets modelled in the MFRM analysis provide further evidence of the scoring validity of the VC-delivered mode of the IELTS Speaking test. Although the range of proficiency of the Phase 3 participants was higher than that of Phase 2 in China, the wide range of proficiency found in this study (Bands 4.0-8.5), with many of the test-takers scoring around Bands 5.5, 6.0 and 6.5, was similar to that found in Phase 1 in London and represents a range typical of international IELTS candidates.
The eight examiners in this study differed significantly in their severity. Such differences among examiners are commonly found in other IELTS studies and in face-to-face speaking assessment in general, but the 0.76 difference in fair average scores between the most lenient and the harshest examiners in this study was considerably larger than the 0.36 difference in fair average scores found in the Phase 2 study in China. One possible explanation for this phenomenon may be that the examiners in China are used to examining a fairly homogeneous population in terms of language proficiency and therefore, there is less likelihood of them differing in their evaluations of oral performance. However, while the differences observed may be related to the VC mode of delivery of this Speaking test, it is equally feasible that there may be other issues at play and further investigation is surely warranted.
6.2.2 Sound quality and perceptions of the effect on scores
Stable Internet connections are required for clear sound quality, and meticulous preparation at the local site is an absolute necessity for smooth administration of the VC delivered mode. The sound quality analysis in this study confirms our Phases 1 and 2 results that the VC technology generally functioned sufficiently well to enable the speaking test to be delivered in this mode. Sound quality perceptions between the examiners and test-takers were not significantly different. This may be due to the introduction of the bespoke platform in this phase of the project, which might have offered more comparable experiences to the examiners and test-takers.
In line with the Phase 2 results, the examiner and test-taker perceptions of sound quality also did not differ across different levels of test-taker ability, but lower proficiency-level test-takers felt that their performance was slightly more susceptible to sound quality than higher proficiency-level test-takers.
The VC technology in this study thus appeared to function well, and the sound quality was perceived positively. Nevertheless, examiners reported that 70 out of the 89 test sessions had some (mostly minor) technical problems. While the fact that almost 80% of the sessions had problems gives cause for concern, this suggests that test providers need to recognise that some technical glitches will inevitably occur in video-conferencing tests, even in the future when technology is further advanced. As reported in Phases 1 and 2, video-conferencing tests elicit more explicit language to negotiate meaning (e.g. making clarification requests) and manage turn-taking from both examiners and test-takers, than face-to-face tests. This relates to the nature of video-conferencing communication which does not always allow subtle ways of establishing mutual understanding and negotiating turns. The explicitness was even more salient when communication breakdowns occurred owing to sound quality and technical problems. Given that these interactional features are attributes of video-conferencing communication in real life, it seems vital for test providers to recognise that these features, which are specific to video-conferencing communication, should be part of the speaking construct measured in the VC test. In other words, as well as making efforts to minimise technical problems, careful consideration about the ways in which the video-conferencing test can embrace the nature of communication via digital technology seems key to successful administration of VC tests and appropriate interpretation of VC test scores (see the newly developed Council of Europe Framework of Reference for Languages (CEFR) descriptors for online interaction (Council of Europe, 2017)).
6.2.3 Perceptions of on-screen prompts by examiners and test-takers
The introduction of an on-screen prompt for Part 2 (long turn) in this phase of the project did not cause any problems for the test-takers who considered it to be clear, although it was suggested that perhaps the prompt could be larger.
Examiners also considered the on-screen prompts to be easy to handle. However, although they had no difficulty in randomly selecting the prompts, examiners commented that putting up and taking down the on-screen prompts and waiting while the invigilator handed over and retrieved paper and pencil for notetaking could add as much as 30 seconds to this part of the test. In order to keep to the timing as specifed (4 minutes), this often meant that they were unable to ask a rounding-off question, which they did not consider to be good practice. To enable the rounding-off question to be asked, it may therefore be necessary to consider adding an extra 30 seconds to Part 2 of the Speaking test when delivered in VC mode, making Part 2 of the Speaking test last four and a half minutes in total.
At this stage, it is not clear whether there would always be an invigilator present in the VC test room to provide materials for note-taking. However, unless this task is revised in such a way that the test-taker is not required/allowed to take notes, some standardised method of delivery of materials for notetaking will have to be found. It may be useful to consider the possibility of harnessing the computer/laptop capabilities for notetaking when the VC test is delivered but further discussion of this suggestion is outside the scope of this report.
6.2.4 Perceptions of training for the VC Speaking test by examiners and test-takers
Analysis of questionnaire data shows that both examiners and test-takers found the training for the VC Speaking test to be useful. Additionally, test-takers found the pictures in the guidelines to be helpful. However, based on examiners’ comments from the post-test administration focus groups, it seems that they would also like the examiner training program to cover additional topics, such as how to deal with technical equipment and how to handle technical problems that may occur. They also think it essential to have technical help available at all times, as was the case in this phase of the project.
However, the recurrent theme that appeared in the Examiner Feedback Questionnaire and the examiner focus group discussions was similar to that in the Phase 2 study, namely initial lack of familiarity with the VC Speaking test. While the one-day training was perceived as very useful, after the actual live test sessions, some of the examiners commented that they wished they could have had more training and practice test sessions in order to be completely familiar with the modified Interlocutor Frame for the VC test. The wording that they normally use in the face-to-face test is memorised and automatised in their test administration practice and some of the examiners found it difficult to pay additional attention to the revised Interlocutor Frame, when they were busy playing the dual role of interlocutor and rater under the live VC test condition. They also suggested that the modified Interlocutor Frame should be further modified to take more account of facets which are specific to the VC mode of delivery of the Speaking test, such as the on-screen prompt and the interlocutor’s role in the notetaking process.
As noted in the Phase 2 report, the current Interlocutor Frame was originally developed for the traditional face-to-face speaking test. In addition to some necessary adjustments to the Interlocutor Frame required to administer the VC test, it seems essential to revisit the degree of flexibility embedded in the Frame in order to embrace the construct measured under the VC condition.
6.2.5 Overall conclusion
A total of 220 test-takers and 22 examiners participated in the three phases of the study, which were conducted in London, Shanghai, China and four countries in Latin America. The scoring validity of the IELTS Speaking test has been established with supporting evidence provided in each phase. However, it was noted in Phases 1 and 2 of the study that the VC-delivered Speaking test seems to assess a slightly different speaking construct from the face-to-face test. That is, even without technical glitches as discussed earlier, test-takers are less likely to be able to supplement their understanding by the examiner’s subtle cues, such as gestures and voice inflection, which might be available under the face-to-face condition. This appears to be due to the nature of video-conference communication where sound and visual information is transmitted via computer. Hence, it would make sense to recognise that the interactive communication construct in the VC test is operationalised in the form of more explicit negotiation of meaning and turn management, and to embrace those aspects of test-taker language as part of the construct measured in the VC delivered test. As discussed in all three phases of the project, this suggestion would entail: a) revisiting the test specifications to include explicit negotiation of meaning and turn management as part of the test construct, and b) revising the Interlocutor Frame to allow for more flexibility in making and responding to clarification requests and different ways of initiating, developing and terminating interaction. This is, of course, perfectly in line with changes in the speaking construct in real-life communication, where communication via digital technology is widely used in distance-learning degree courses and oral examination situations, as well as social and business interactions, and can therefore be welcomed (for further discussion, see Nakatsuhara et al, 2017b). It is interesting to note, in fact, that the Council of Europe has recently found it necessary to revise the CEFR to include updated descriptors of the speaking construct in relation to online interaction (Council of Europe, 2017).
The three phases of the study also demonstrated the importance of training examiners and test-takers for the VC test. In addition, the Interlocutor Frame and every aspect of the test administration needs to be carefully scrutinised and made suitable for the VC test. The insights obtained throughout the three phases of the project from test-takers and examiners are believed to be useful for informing the revisions. Finally, like other studies cited in the literature review, the three phases of this project also point to the significance of stable Internet connection and IT support. As suggested by examiners in Phases 2 and 3, examiner guidelines should also include a set of ‘trouble-shooting’ guidelines in case something goes wrong during the VC test.
Final remarks
The results of the first phase of this study were reported in 2014, which was the 25th anniversary of the introduction of IELTS in 1989. In the past year, over 3 million IELTS tests were taken in around 140 countries, and the test is recognised by more than 10,000 education institutions, faculties, government agencies and professional organisations worldwide (http://www.ielts.org/media\_centre.aspx). Since the last IELTS Speaking test revision in 2001, over 15 years have passed, and the ways in which we communicate in social and academic contexts have greatly changed since then, due to advances in VC technology.
The three phases of this project were motivated by the need for the IELTS Partners to keep under constant review the extent to which the IELTS Speaking test is accessible and fair to as wide a constituency of test users as possible and the extent to which new technology can be utilised for this purpose, as well as to reflect a more up-to-date construct of real-life social and academic communication.
It is hoped that the three phases of this project provide sufficient insights into the extent to which the VC mode of the IELTS Speaking test can be considered as a viable option in the future, as well as offering suggestions as to what further research is necessary and what caveats should be kept in mind for this mode.
References
- Abbott, L., Austin, R., Mulkeen, A. and Metcalfe, N. (2004). The global classroom: Advancing cultural awareness in special schools through collaborative work using ICT. European Journal of Special Needs Education, 19(2), 225-240.
- Abrams, Z. I. (2003). The effect of synchronous and asynchronous CMC on oral performance in German. The Modern Language Journal, 87(2), 157-167.
- Bernstein, J., Van Moere, A. and Cheng, J. (2010). Validating automated speaking tests. Language Testing, 27(3), 355-377.
- Bond, T. G. and Fox, C.M. (2007). Applying the Rasch model. Fundamental measurement in the human sciences (2nd edition). Marwah, NJ: Lawrence Erlbaum Associates.
- Bonk, W. J. and Ockey, G. J. (2003). A many-facet Rasch analysis of the second language group oral discussion task. Language Testing, 20(1), 89-110.
- Brown, A. and Hill, K. (1997/2007). Interviewer style and candidate performance in the IELTS oral interview. In L. Taylor and P. Falvey (Eds.), IELTS collected papers: Research in speaking and writing assessment (pp.37-61). Cambridge: Cambridge University Press.
- Chen, A. (2009). Perception of paralinguistic intonational meaning in a second language. Language Learning, 59(2), 367-409.
- Clark, J. L. D. and Hooshmand, D. (1992). ‘Screen-to-screen’ testing: An exploratory study of oral proficiency interviewing using video-conferencing. System, 20(3), 293-304.
- Council of Europe. (2017). Common European Framework of Reference for Languages: Learning, Teaching, Assessment; Companion Volume with New Descriptors. Strasbourg: Council of Europe.
- Craig, D. A. and Kim, J. (2010). Anxiety and performance in videoconferenced and face-to-face oral interviews. Multimedia-assisted Language Learning, 13(3), 9-32.
- Craig, D.A. & Kim, J. (2012). Performance and anxiety in videoconferencing. In F. Zhang (Ed.), Computer-Enhanced and Mobile-Assisted Language Learning: Emerging Issues and Trends (pp. 137-157). Hershey, PA: IGI Global. doi:10.4018/978-1-61350-065-1.
- Eales, R. T. J., Neale, D. C. and Carroll, J. M. (1999). Desktop conferencing as a basis for computer supported collaborative learning in K-12 classrooms. In B. Collis and R. Oliver (Eds.), Proceedings of the World Conference in Educational Multimedia, Hypermedia and Telecommunications 1999, 1 (pp. 628-633). Chesapeake, VA: Association for the Advancement of Computing in Education.
- Ellis, R. (2005). Instructed Second Language Acquisition: A Literature Review. New Zealand: Ministry of Education.
- Gillies, D. (2008). Student perspectives on videoconferencing in teacher education as a distance. Distance Education, 29(1), 107-118.
- Guichon, N. (2010). Preparatory study for the design of a desktop videoconferencing platform for synchronous language teaching. Computer Assisted Language Learning, 23(2), 169-182.
- IBM (2013). SPSS Statistics V22.0. Available from: https://www.ibm.com/support/knowledgecenter/en/
- Jauregi, K., & Baňados, E. (2008). Virtual interaction through video-web communication: A step towards enriching and internationalizing language learning programs. ReCALL, 20(2), 183-207.
- Kenyon, D. and Malabonga, V. (2001). Comparing examinee attitudes toward computerassisted and other proficiency assessments. Language Learning and Technology, 5(2), 60-83.
- Kern, R. (2014). Technology as Pharmakon: The promise and perils of the Internet for foreign language education. The Modern Language Journal, 98(1), 340-357.
- Kiddle, T. and Kormos, J. (2011). The effect of mode of response on a semi-direct test of oral proficiency. Language Assessment Quarterly, 8(4), 342-360.
- Kim, J. and Craig, D. A. (2012). Validation of a videoconferenced speaking test. Computer Assisted Language Learning, 25(3), 257-275.
- Kinginger, C. (1998). Videoconferencing as access to spoken French. Modern Language Journal, 82(4), 502-513.
- Laurillard, D. (2002). Rethinking University Teaching (2nd Ed.). London: Routledge.
- Lawson, T., Comber, C., Gage, J. and Cullum-Hanshaw, A. (2010). Images of the future for education? Videoconferencing: a literature review. Technology, Pedagogy and Education, 19(3), 295-314.
- Lee, L. (2007). Fostering second language oral communication through constructivist interaction in desktop videoconferencing. Foreign Language Annals, 40(4), 635-649.
- Linacre, M. (2013). Facets computer program for many-facet Rasch measurement, version 3.71.2. Beaverton, Oregon: Winsteps.com.
- McNamara, T. (1996). Measuring Second Language Performance. New York: Longman.
- McNamara, T. (2000). Language Testing. Oxford: Oxford University Press.
- Nakatsuhara, F., Inoue, C., Berry, V. and Galaczi, E. (2016). Exploring performance across two delivery modes for the same L2 speaking test: Face-to-face and videoconferencing delivery - A preliminary comparison of test-taker and examiner behaviour. IELTS Partnership Research Papers 1/2016. IELTS Partners: British Council, Cambridge English Language Assessment and IDP: IELTS Australia. Available online at: https://www.ielts.org/\~/media/research-reports/ielts-partnership-research-paper-1.ashx
- Nakatsuhara, F., Inoue, C., Berry, V. and Galaczi, E. (2017a). Exploring the use of videoconferencing technology in the assessment of spoken language: A mixed-methods study. Language Assessment Quarterly, 14(1), 1-18.
- Nakatsuhara, F., Inoue, C., Berry, V. and Galaczi, E. (2017b). Exploring performance across two delivery modes for the IELTS Speaking Test: Face-to-face and videoconferencing delivery (Phase 2). IELTS Partnership Research Papers 3/2017. IELTS Partners: British Council, Cambridge English Language Assessment and IDP: IELTS Australia. Available online at: https://www.ielts.org/-/media/research-reports/ieltsresearch-partner-paper-3.ashx
- Ockey, G., Gu, L. and Keehner, M. (2017). Web-based virtual environments for facilitating assessment of L2 oral communication ability. Language Assessment Quarterly, 14(4), 346-359.
- Pitcher, N., Davidson, K. and Goldfnch, J. (2000). Videoconferencing in higher education. Innovations in Education and Training International, 37(3), 199-209.
- Shohamy, E. (1994). The validity of direct versus semi-direct oral tests. Language Testing, 11(2), 99-123.
- Smith, B. (2003). Computer-mediated negotiated interaction: An expanded model. The Modern Language Journal, 87(1), 25-38.
- Stansfield, C. (1990). An evaluation of simulated oral proficiency interviews as measures of oral proficiency. In J. E. Alatis (Ed.), Georgetown University Roundtable of Languages and Linguistics 1990 (pp. 228-234). Washington, D.C.: Georgetown University Press.
- Stansfield, C. and Kenyon, D. (1992). Research on the comparability of the Oral Proficiency Interview and the Simulated Oral Proficiency Interview. System, 20(3), 347-364.
- Smyth, R. (2005). Broadband videoconferencing as a tool for learner-centred distance learning in higher education. British Journal of Educational Technology, 36(5), 805-820.
- Wang, Y. (2004). Internet-based desktop videoconferencing in supporting synchronous distance language learning. Language Learning and Technology, 8(3), 90-121.
- Wang, Y. (2006). Negotiation of meaning in desktop videoconferencing-supported distance language learning. ReCALL, 18(1), 122-146.
- Wright, B. and Linacre, M. (1994). Reasonable mean-square fit values. Retrieved 27 March 2012 from http://www.rasch.org
- Yanguas, I. (2010). Oral computer-mediated interaction between L2 learners: It’s about time! Language Learning and Technology, 14(3), 72-93.
- Zhou, Y.J. (2015). Computer-delivered or face-to-face: Effects of delivery mode on the testing of second language speaking. Language Testing in Asia, 5:2, DOI 10.1186/s40468-014-0012-y.
Appendix 1: Double marking matrix
Note: In each examiner column, test-taker IDs (e.g. C001) indicate the test-takers each examiner rated during the live test sessions, and DMs indicate the test-takers whose video-recorded performances the examiner double-marked.
| Test-taker ID | Live test | Examiner Q | Examiner R | Examiner O | Examiner P | Examiner L | Examiner N | Examiner K | Examiner M |
|---|---|---|---|---|---|---|---|---|---|
| C001 | Day 1 | C001 | DM | ||||||
| C003 | Day 1 | C003 | DM | ||||||
| C005 | Day 1 | C005 | DM | ||||||
| C007 | Day 1 | C007 | DM | ||||||
| C009 | Day 1 | C009 | DM | ||||||
| C011 | Day 1 | C011 | DM | ||||||
| C013 | Day 1 | C013 | DM | ||||||
| C015 | Day 1 | C015 | DM | ||||||
| C017 | Day 1 | C017 | DM | ||||||
| C019 | Day 1 | C019 | DM | ||||||
| C021 | Day 1 | C021 | DM | ||||||
| C002 | Day 1 | C002 | DM | ||||||
| C004 | Day 1 | C004 | DM | ||||||
| C006 | Day 1 | C006 | DM | ||||||
| C008 | Day 1 | C008 | DM | ||||||
| C010 | Day 1 | C010 | DM | ||||||
| C012 | Day 1 | C012 | DM | ||||||
| C014 | Day 1 | C014 | DM | ||||||
| C016 | Day 1 | C016 | DM | ||||||
| C020 | Day 1 | DM | C020 | ||||||
| C023 | Day 2 | C023 | DM | ||||||
| C024 | Day 2 | C024 | DM | ||||||
| C027 | Day 2 | C027 | DM | ||||||
| C030 | Day 2 | C030 | DM | ||||||
| C031 | Day 2 | C031 | DM | ||||||
| C032 | Day 2 | C032 | DM | ||||||
| C034 | Day 2 | C034 | DM | ||||||
| C037 | Day 2 | C037 | DM | ||||||
| C040 | Day 2 | C040 | DM | ||||||
| C041 | Day 2 | C041 | DM | ||||||
| C043 | Day 2 | C043 | DM | ||||||
| C045 | Day 2 | DM | C045 | ||||||
| C048 | Day 2 | DM | C048 | ||||||
| C025 | Day 2 | C025 | DM | ||||||
| C026 | Day 2 | C026 | DM | ||||||
| C028 | Day 2 | C028 | DM | ||||||
| C029 | Day 2 | C029 | DM | ||||||
| C033 | Day 2 | C033 | DM | ||||||
| C035 | Day 2 | C035 | DM | ||||||
| C036 | Day 2 | C036 | DM | ||||||
| C039 | Day 2 | C039 | DM | ||||||
| C042 | Day 2 | DM | C042 | ||||||
| C044 | Day 2 | DM | C044 | ||||||
| C046 | Day 2 | DM | C046 | ||||||
| C047 | Day 2 | DM | C047 | ||||||
| C049 | Day 3 | C049 | DM | ||||||
| C050 | Day 3 | C050 | DM | ||||||
| C051 | Day 3 | C051 | DM | ||||||
| C052 | Day 3 | C052 | DM | ||||||
| C053 | Day 3 | C053 | DM | ||||||
| C054 | Day 3 | C054 | DM | ||||||
| C055 | Day 3 | DM | C055 | ||||||
| C056 | Day 3 | DM | C056 | ||||||
| C057 | Day 3 | DM | C057 | ||||||
| C058 | Day 3 | DM | C058 | ||||||
| C059 | Day 3 | DM | C059 | ||||||
| C073 | Day 3 | DM | C073 | ||||||
| C060 | Day 3 | C060 | DM | ||||||
| C061 | Day 3 | C061 | DM | ||||||
| C062 | Day 3 | C062 | DM | ||||||
| C063 | Day 3 | C063 | DM | ||||||
| C064 | Day 3 | DM | C064 | ||||||
| C065 | Day 3 | DM | C065 | ||||||
| C066 | Day 3 | DM | C066 | ||||||
| C067 | Day 3 | DM | C067 | ||||||
| C068 | Day 3 | DM | C068 | ||||||
| C070 | Day 3 | DM | C070 | ||||||
| C071 | Day 3 | DM | C071 | ||||||
| C075 | Day 4 | C075 | DM | ||||||
| C076 | Day 4 | C076 | DM | ||||||
| C077 | Day 4 | DM | C077 | ||||||
| C078 | Day 4 | DM | C078 | ||||||
| C079 | Day 4 | DM | C079 | ||||||
| C080 | Day 4 | DM | C080 | ||||||
| C081 | Day 4 | DM | C081 | ||||||
| C082 | Day 4 | DM | C082 | ||||||
| C083 | Day 4 | DM | C083 | ||||||
| C086 | Day 4 | DM | C086 | ||||||
| C088 | Day 4 | DM | C088 | ||||||
| C089 | Day 4 | DM | C089 | ||||||
| C090 | Day 4 | DM | C090 | ||||||
| C091 | Day 4 | DM | C091 | ||||||
| C092 | Day 4 | DM | C092 | ||||||
| C093 | Day 4 | DM | C093 | ||||||
| C094 | Day 4 | DM | C094 | ||||||
| C095 | Day 4 | DM | C095 | ||||||
| C096 | Day 4 | DM | C096 | ||||||
| C098 | Day 4 | DM | C098 | ||||||
| C100 | Day 4 | DM | C100 |
Appendix 2: Test-taker Feedback Questionnaire
Name: ID No:
Gender: (please circle) Male / Female Age:
Please complete this questionnaire together with the candidates, while showing all available options (1-5) to them.
Tick the relevant boxes (1-5) according to the candidate’s responses.
YOUR EXPERIENCE WITH TECHNOLOGY (please tick):
| Question | 1. Never | 2. | 3. Once or twice a week | 4. | 5. Everyday |
|---|---|---|---|---|---|
| Q1. How often do you use the Internet socially to get in touch with people? | |||||
| Q2. How often do you use the Internet for your studies? | |||||
| Q3. How often do you use video-conferencing (e.g. Skype, Facetime) socially to communicate with people? | |||||
| Q4. How often do you use video-conferencing for your studies? |
BEFORE THE TEST
| Item | 1 | 2 | 3 | 4 | 5 |
|---|---|---|---|---|---|
| Q5. Were the candidate guidelines for the test … | Not useful | OK | Very useful | ||
| Q6. Was the picture in the guidelines… | Not helpful | OK | Very helpful |
DURING THE TEST
| Question | Option 1 | Option 2 | Option 3 | Option 4 | Option 5 |
|---|---|---|---|---|---|
| Q7. How often did you understand the examiner in the VC test? | 1. Never | 2. | 3. Sometimes | 4. | 5. Always |
| Q8. Did taking the VC test make you feel… | 1. Very nervous | 2. | 3. OK | 4. | 5. Very comfortable |
| Q9. Did you feel taking the VC test was … | 1. Very difficult | 2. | 3. OK | 4. | 5. Very easy |
| Q10. Did you feel you had enough opportunity in the VC test to demonstrate your speaking ability? | 1. Not at all | 2. | 3. OK | 4. | 5. Very much |
| Q11. Do you think the quality of the sound in the VC test was… | 1. Not clear at all | 2. | 3. OK | 4. | 5. Very clear |
| Q12. Do you think the quality of the sound in the VC test affected your performance? | 1. No | 2. | 3. Somewhat | 4. | 5. Very much |
| Q13. In Part 2 (long turn), the prompt on the screen was… | 1. Not clear at all | 2. | 3. OK | 4. | 5. Very clear |
If you chose Option 1 or 2 for any questions from Q5 to Q13, please explain why?
C003 The window of the screen cut part of the document (word). C004 After Part 2, screen was frozen and there was a delay of 2-3 seconds. So, we interrupted to each other twice. C005 In part 2, when the prompt appears the face of the examiner is there and could not read all the text the examiner explained. C008 Twice I could not understand because examiner spoke very soft. C012 It was so impersonal, if you felt the energy of the other person you will have a better performance. I couldn’t connect with the interview. I like to feel and see the reactions of the examiner. C014 No, the sound was really good, I could hear the examiner pretty well. C016 Three times I felt the sound was interrupted. I asked the examiner to repeat and she repeated again. C017 Because through screen the interview is very impersonal, is very cold. C019 Q11. I didn’t hear very well because the connection was a bit bad. C020 It’s more because the pressure of the test. No VC itself. Feel nervous. C024 I felt nervous because I don’t like exams. The sound in the VC test was perfect. C025 The quality of the sound didn’t affect my performance because it was fine and clear. C029 The quality of the sound was very good. C030 Well, it didn’t affect my performance. It was good and I felt great. C031 The quality of the sound was good, and I don’t think it affected my performance, but I do think that it would’ve been better face-to-face, the VC test made me a little nervous and sometimes the communication was not very good due to this. C033 I don’t think my performance were affected because the sound of the video was good, she could understand me if I understand what she was asking me. C037 The sound of the VC test was a bit behind, so one would view her moving before the sound was clear. C039 Sound was ok. It did not affect my performance. C040 I felt no time enough to answer questions -Quite short. C043 As candidate I believe is very important to have a clock to measure our time. Sometimes the screen was not really clear so I don’t know why but could be better to improve the video-conference program, technology or the quality of the Internet. C045 You would add a clock time during the second part just to help you giving a better answer. And the delay in the VC doesn’t help you to be focus on your speech. C047 1. Not many schools offer you this kind of tools for studies. 2. It did not affect but the connection was slow and sometimes the image got frozen and the sound was having interference. C048 I was not affected by the VC. C049 Q5. It was a very useful test because let me show or know what should I better and how is my fluency. Q3. Sometimes the prompt used to be slow but in general it was OK. C052 It was a convenient because the quality of the sound was perfect. C053 I felt very well, it was amazing and I loved it. C054 Q3 - I use more Whatsapp than Skype or video-conferencing socially to communicate with people. Q12 - No, the evaluator heard me fine. C055 Q4. Because usually I study by myself, if I need someone to explain something to me I’d rather be face-to-face. Q3. I’d rather to text. Q12. It didn’t affect my performance. C057 I felt nervous because is not common for me to speak English with a stranger that is testing my speaking ability. C059 I felt nervous because it was my first time on VC in English. It’s a good option for the student to improve on his learning path. C062 The quality of the sound was very good so I think it did not affect my performance at all. C063 In Q12 because the sound in the test was good and I was very nervous. C064 I felt that the sound was too soft sometimes, not enough loud for me.
C065 Because I can notice his facial expression and make me lost eye contact. Because sometime the sound was interrupted (Q7 and Q13)
C067 I am a very nervous person.
C071 Quality of the sound: sometimes (a few times) the sound came and went and I usually read the lips (“leer los labios”) of my examiner, in order to understand him/her better, and using VC I find it that doing this is not so easy. There was a delay between the audio and the screen. Another point is that in fact the label didn’t appear on the screen, there was some difficulty until the problem was solved.
C077 I would prefer an interview face to face, defnitely.
C078 Q8. I always feel nervous when I have to speak English (especially if I’m being evaluated). Q10. I think I was too fast, maybe if you add 10 more minutes because we can’t build an opinion in few seconds.
C080 I was very nervous but I could handle it. I always feel nervous when I have to talk in English. The quality of the sound was perfect for me, so it doesn’t affect time.
C081 It was very good, I liked the experience, with talked with someone with Skype. It was very helpful. I want to do again this experience.
C082 Sound was good enough to show my performance.
C083 I do not chose that option until Q12 where I say no because it is not affect my performance the quality of the sound in any moment.
C086 The sound need to be improved, maybe putting and stereo speakers.
C091 Q4. To study I use other communication channels like youtube videos. I don’t like to use video-conferencing form of study because of the connection problems we have in Venezuela. Q8. Make me feel a little nervous because I was worry about the efficiency of the connection with Internet. Q12. My performance was not affected by the quality of the sound.
C092 Q3 - Not enough time. Q11 - The sound was low.
C093 Q3. I prefer to use Whatsapp. Q4. I don’t need it.
C094 I could not understand some parts cause the audio quality.
C095 The quality of the sound was very good. It didn’t affect my performance.
C098 I think it is necessary to put other speaker and it is not necessary to focus on screen.
C100 I choose option 2 in Q6 because I didn’t see any picture in the guidelines.
Are there any other positive or negative points that you’d like to highlight?
C002 You feel nervous when getting into the room, so it would be good to have a minute to test sound and find all is ok. It is a good experience, modern and useful. Examiner was kind and polite.
C003 It was interesting. Not very common and different. The experience was positive.
C004 I found it is a positive experience, the sound was good. Maybe the first minute was weird but after I felt comfortable with the examiner and the exam.
C005 It was very positive. Video and sound was my concern but they were good. Examiner was very professional.
C006 All is positive. Help you to feel good and comfortable. Maybe is not good for shy people, but for me is ok.
C007 I think the guidelines has lot of information and in some cases I didn’t read properly, also I think is important that you cannot see the invigilators on the screen because you feel embarrassed.
C008 It is a good way to take the exam. It is a good experience. But I prefer to have someone in front not video.
C009 In the second part it would be nice to have a timer to manage your speech.
C010 The methodology is positive, I think this is a good platform and technology.
C011 I felt very nervous, more than normal when you talk face-to-face with someone. Quite cold. It went so fast. No time to think.
C012 Sound, video. Scale 1 to 5: 4.
C013 Me sentia nervioso per la persona que estaba detias mio. (I felt nervous about the person behind me.)
C014 I really like this interview, the sound was great. I don’t have negative points about the interview.
C015 Most of things are positive. Sometimes I asked to repeat the question and examiner did it. C016 In comparison with regular exam, it is very similar and could be a good solution. Not too much difference to the personal interview. C020 Body expression is lost for the interviewer. C021 It’s very important to check sound (connection) quality. C049 I’d like to do this frequently. C050 It was ok. Sometime the sound wasn’t ok. But in general is a good experience and the questions because I felt comfortable. I feel a little nervous because was my first time. C051 Sometimes there was a delay with the VC and I couldn’t understand properly what the examiner was saying, she had to repeat me the words C054 The experience was very interesting and useful to me and it helped me to understand better this kind of experience. C055 At some point I didn’t have the time to finish what I was saying. C057 The audio must be improve a little bit. C058 Everything was good. C060 Say how much time it is available for every question. C063 It was a good experience to practice. C064 It was an excellent initiative and I’m proud of be part of it. I hope it will be a part of a regular way of evaluation. The interaction with native English speakers is very welcome. C065 Negative, maybe a bigger screen should be better. Try to improve the speed of Internet. Positive, was quickly. C066 Too long the waiting time, make more nervous the person. If you give us more video exams options, we should improve our performance. C068 In part 2, there could be a bigger prompt on the screen. C071 In my opinion, I’d rather take the exam person-to-person. I took the IELTS 5 years ago, and comparing that event with this, I find easier the face-to-face way (and taking into the account that I’m at intermediate level). C080 The examiner makes me feel comfortable, was really nice. Great experience. C081 The sound was a little low, but screen was good, I could see the teacher. C082 The candidate should receive printed the question for part II (long turn). This avoids taking note of the question and allows the candidate to focus on taking notes about the answer. C083 Nothing, it was a great experience to know more or less my knowledge in this moment. C086 Maybe would be better with headphones. C089 It was a very nice experience. C090 I have been presented this exam with a real teacher and is almost the same. It would be an excellent opportunity to make this project a reality because you will be evaluated for someone who has the expertise. The economical situation does not allow to have English teachers in Venezuela, so this is an excellent opportunity to have a real interaction with English professors abroad. C091 I really like the idea but you need to take in consideration the problems with the connection to Internet that we have in Venezuela where is too easy to lose conversation, conferences or reading because of that. You need to guarantee that the quality of the sound from the speaker is good for the person who is taking the test. C092 Improve the sound. C094 There was 3 moments where the transmission freeze. C095 Positive - the examiner was very helpful and friendly. She made me feel comfortable. C100 It was a great experience and I recommend use it for IELTS test, thanks.
Appendix 3: Examiner Training Feedback Questionnaire
Please circle your Examiner ID: K L M N O P Q R
Tick the relevant boxes according to how far you agree or disagree with the statements below.
| 1. Strongly disagree | 2. Disagree | 3. Neutral | 4. Agree | 5. Strongly agree | |
|---|---|---|---|---|---|
| Q1. I found the training session useful. | 8 (100%) | ||||
| Q2. The differences between the standard F2F test and the VC test were clearly explained. | 8 (100%) | ||||
| Q3. What the VC room will look like was clearly explained. | 3 (37.5%) | 5 (62.5%) | |||
| Q4. VC specific techniques (e.g. use of preamble, back-channelling, gestures, how to interrupt) were thoroughly discussed. | 8 (100%) | ||||
| Q5. The rating procedures in the VC test were thoroughly discussed. | 8 (100%) | ||||
| Q6. The training videos that we watched together were helpful. | 8 (100%) | ||||
| Q7. I had enough opportunities to discuss all my concern(s)/question(s) about the VC test. | 8 (100%) |
Additional comments? Do you have any suggestions for improving the training session?
Examiner N: Very clear review of procedures and relation to the VC project.
Examiner O: The training was excellent. Very thorough as all the procedures explained etc.
Most useful for me was the inclusion of the training videos as this provided extra, in-depth, as
well as a clear visual insight into the exam. I also liked the role play of mini invigilator/examiner/
candidate - this eased any concerns I had and provided practice.
Thank you very much.
Your feedback will be very useful for improving the training session.
Appendix 4: Examiner Feedback Questionnaire
Today you administered and rated a number of IELTS Speaking Tests using videoconferencing (VC) technology.
To help inform an evaluation of this mode of delivery and rating, we’d welcome comments on your experience of administering and rating the IELTS Speaking Tests.
1. BACKGROUND DATA
NAME:
Years of experience as an EFL/ESL teacher? years months
Years of experience as an IELTS examiner? years months
YOUR EXPERIENCE WITH TECHNOLOGY (please tick):
| 1. Never | 2. | 3. Once or twice a week | 4. | 5. Everyday | Results | |
|---|---|---|---|---|---|---|
| Q1. How often do you use the Internet socially to get in touch with people? | M=4.88 SD=0.35 | |||||
| Q2. How often do you use the Internet to teach? | M=2.88 SD=1.64 | |||||
| Q3. How often do you use video-conferencing (e.g. Skype, Facetime) socially to communicate with people? | M=3.00 SD=0.93 | |||||
| Q4. How often do you use video-conferencing to teach? | M=1.63 SD=0.92 |
2. ADMINISTERING THE TEST
| 1. Strongly disagree | 2. Disagree | 3. Neutral | 4. Agree | 5. Strongly agree | Results | |
|---|---|---|---|---|---|---|
| Q5. Overall I felt comfortable in administering the IELTS Speaking Test in the VC mode. | M=4.38 SD=0.74 | |||||
| Q6. Overall the examiner training adequately prepared me for administering the VC test | M=4.63 SD=0.74 | |||||
| Q7. I found it straightforward to administer Part 1 (frames) of the IELTS Speaking Test in the VC mode. | M=4.50 SD=0.76 | |||||
| Q8. The examiner training adequately prepared me for administering Part 1 of the VC test. | M=4.63 SD=0.52 | |||||
| Q9. I found it straightforward to administer Part 2 (long turn) of the IELTS Speaking Test in the VC mode. | M=4.25 SD=0.71 | |||||
| Q10. The examiner training adequately prepared me for administering Part 2 of the VC test. | M=4.50 SD=0.53 | |||||
| Q11. I found it easy to handle task prompts on the screen in Part 2 of the VC test. | M=4.63 SD=0.74 | |||||
| Q12. I found it straightforward to administer Part 3 (2-way discussion) of the IELTS Speaking Test in the VC mode. | M=4.50 SD=0.76 | |||||
| Q13. The examiner training adequately prepared me for administering Part 3 of the VC test. | M=4.88 SD=0.35 | |||||
| Q14. The examiner’s interlocutor frame was straightforward to handle and use in the VC mode. | M=4.63 SD=0.74 | |||||
| Q15. The examiner training gave me confidence in handling the interlocutor frame in the VC test. | M=4.50 SD=1.41 |
If you chose Option 1 or 2 for any of the questions from Q5 to Q15, please explain why?
Examiner N: I found the delays affected the timings for the Parts, especially Part 1. A few seconds delay for each question adds up and I found it difficult to deliver 3 frames.
Examiner O: It did feel weird, very weird at first as an examiner. I felt nervous as this is a new platform for me; initially I was really speaking loudly.
Are there any other positive or negative points that you’d like to highlight?
Examiner K: In part 2, when a candidate gets stuck and has not covered some of the prompts, the examiner cannot “point” at the prompts not used, for example. The only possible help is “Can you tell me more…?” Would it be possible to include some back-up prompts in the script? Delay means that sometimes it is hard to keep to timing strictly. Interrupting the candidate or stopping him/her is not always possible to do in a very smooth way.
Examiner L: I hardly even had enough time to ask Refs. The … bits we have to say “You will now be …” or the time we wait for invigilators to hand over paper and pencil eat into the 4’ and I was left without any time for Refs (except for a couple of exceptional cases).
Examiner M: Generally felt very comfortable with the tests. Perhaps with weaker students it was more challenging, as some didn’t seem to know about all the different parts.
Examiner N: The delays do impact on the interactions, however, I do feel that a good sample can be elicited and the candidates’ level can be assessed.
Examiner O: Positives: sound was very clear and great. It’s just that the sound although clear was delayed.
Examiner P: I found it harder to handle timing during the VC test, mainly because of the image/ voice delay. Sometimes when you try to interrupt the candidate’s speech, a few seconds will pass before he/she realises you have asked him/her to stop.
Examiner Q: Camera level: If face of candidate was higher (closer to the candidate) it would be better for eye contact reasons. Could add “what’s your name?” to pre-test script. No time for follow up Qs in Part II.
Examiner R: The “new” short conversation with candidate prior to starting the test itself is very useful. The highlighted instructions and commands in red font in Part 2 are very helpful. Platform seemed easy to navigate although I would like more practice (i.e. mock interviews).
3. RATING THE TEST
| 1. Strongly disagree | 2. Disagree | 3. Neutral | 4. Agree | 5. Strongly agree | Results | |
|---|---|---|---|---|---|---|
| Q16. Overall I felt comfortable in rating candidate performance in the VC test. | M=4.25 SD=0.46 | |||||
| Q17. Overall the examiner training adequately prepared me for rating candidate performance in the VC test. | M=4.75 SD=0.46 | |||||
| Q18. I found it straightforward to apply the Fluency and Coherence scale in the VC test. | M=4.63 SD=0.52 | |||||
| Q19. The examiner training adequately prepared me for applying the Fluency and Coherence scale in the VC test | M=4.63 SD=0.52 | |||||
| Q20. I found it straightforward to apply the Lexical Resource scale in the VC test. | M=4.63 SD=0.52 | |||||
| Q21. The examiner training adequately prepared me for applying the Lexical Resource scale in the VC test | M=4.63 SD=0.52 | |||||
| Q22. I found it straightforward to apply the Grammatical Range and Accuracy scale in the VC test. | M=4.63 SD=0.52 | |||||
| Q23. The examiner training adequately prepared me for applying the Grammatical Range and Accuracy scale in the VC test. | M=4.63 SD=0.52 | |||||
| Q24. I found it straightforward to apply the Pronunciation scale in the VC test. | M=4.50 SD=0.76 | |||||
| Q25. The examiner training adequately prepared me for applying the Pronunciation scale in the VC test. | M=4.63 SD=0.52 | |||||
| Q26. I feel confident about the accuracy of my ratings in the VC test. | M=4.13 SD=0.99 | |||||
| Q27. The examiner training helped me to feel confident with the accuracy of my ratings on the VC test. | M=4.63 SD=0.74 |
If you chose Option 1 or 2 for any of the questions from Q16 to Q27, please explain why?
Examiner M: My issues relate to delays within the interactions only rating was not a problem.
Examiner O: I feel I need to spend more time on rating for the VC test. I must admit that I’m not as confident marking on the VC platform as during the live tests.
Are there any other positive or negative points that you’d like to highlight?
Examiner L: At the beginning of the lesson, I had too many concerns on my mind (connectivity, script, timing, topic cond.) and I didn’t feel as comfortable rating the candidate as I did earlier on in the day, once I’d become more familiar with every thing and felt more relaxed.
Examiner O: This was an exciting experience. The VC platform made for a more interesting dynamic at times. More so than the F2F.
Examiner P: Pronunciation is perhaps the most difficult grade to give because sometimes the audio is not as clear as it is during a F2F interview.
Examiner Q: Especially at first, I was focusing on the technology and not so much the ratings. After a while I felt more comfortable.
Examiner R: We had overall good connectivity throughout the day - this made it easy to rate all criteria without problem. My only concern/issue was the 2-3 second delay in video/audio with the candidate; this made it hard to time and pose the questions smoothly and naturally.
4. COMPARING THE EXPERIENCE OF THE STANDARD FACE-TO-FACE (F2F) AND THE VIDEO-CONFERENCING (VC) MODE FOR THE IELTS SPEAKING TEST
| F2F | VC | No difference | Missing | |
|---|---|---|---|---|
| Q28. Which mode of speaking test do you feel more comfortable with? | 4 (50.0%) | 0 | 3 (37.5%) | 1 (12.5%) |
| Q29. Which mode of speaking test do you feel is easier for you to administer? | 3 (37.5%) | 1 (12.5%) | 3 (37.5%) | 1 (12.5%) |
| Q30. Which mode of speaking test do you feel is easier for you to rate? | 2 (25.0%) | 0 | 6 (75.0%) | 0 |
| Q31. Which mode of speaking test do you think gives candidates a better chance to demonstrate their level of English proficiency? | 1 (12.5%) | 0 | 5 (62.5%) | 2 (25.0%) |
| Q32. Which speaking test do you prefer? | 3 (37.5%) | 0 | 4 (50.0%) | 1 (12.5%) |
Are you aware of doing anything differently in your examiner role across the two speaking test modes - face-to-face and video-conferencing? If yes, please give details…..
Examiner K: I tended to speak more deliberately (less naturally) as I wanted to make sure candidates understood me. Lower-level candidates asked for repetition quite often - which doesn’t usually occur in F2F interviews. I expected posture and eye-contact would feel awkward in VC speaking tests but wasn’t like that. Once you get used to the delay- and therefore are able to avoid overlapping, the interaction seems as natural as if you are in the same room as the candidates.
Examiner L: I don’t think I can answer these questions now. I think that its probably a bit too early in the process to decide whether I feel comfortable administering VC tests. I certainly felt a lot more comfortable as the day progressed and even sort of forgot the candidate was not actually sitting across the table from me (last couple of interviews). I think that given a bit of time I wouldn’t feel any difference between the two modes. For now, of course, I feel more at ease with F2F tests.
Examiner M: Perhaps having to remember to record both on the computer and with recording device made it a little more complicated at the beginning of the day but by the 3rd/4th candidate I was fine. When there is a slight delay it often meant we were speaking at the same time on occasions. However, this was only true with a few candidates.
Examiner N: At this moment, I have to say F2F is my preference however, if the delays between asking the questions and the candidates hearing the questions was reduced then I wouldn’t mind either delivery method. On occasion there were sync issues between video/sound, but I feel the delays had a greater impact than the sync.
Examiner O: I think I would just need more time getting used to this platform. Most of my answers are pro F2F. Also, I think if there were less delays, there would be no difference.
Examiner P: As I mentioned in the comments I wrote on the candidate rating sheets, the delay affects the way you deliver the exam frames. Even though I prefer the F2F speaking test, I believe the VC test will be a very good development if it finally goes live, especially for hard to reach locations. I usually take some time to adjust to new technologies, so I think I would probably get used to it and find no difference administering this kind of exam.
Examiner Q: Not enough time to ask follow-up Qs for Part II.
Examiner R: Nothing particularly different although the candidates’ “lack of experience” with VC mode may be a little off-putting - they may feel a little more nervous. With practice/training this could easily be avoided. Thank you for letting me participate.
Thank you for answering these questions.
Appendix 5: Sound and image problems encountered by examiners
| Cand ID | Exmr ID | Comments |
|---|---|---|
| C001 | Q | Slight 2 sec delay but didn’t interfere with process |
| C002 | R | Sound a little bit ‘muffled’, one is aware of a certain hollow/box-type sound/space in recording (audio), no problems handling ‘new format’ or tech, clear video image, very good to have highlighted/red instructions in Part 2 |
| C004 | R | Marked delay (2-3) seconds in both video and sound |
| C005 | Q | 1 sec delay but clear |
| C006 | R | It seemed as if the quality of the VC presented the candidate with many sustained difficulties |
| C007 | Q | Slight delay 1-2 secs |
| C008 | R | During the 2nd half of Part 3 the screen size (from my view) got larger and then it went back to normal. Some background noise (that I could hear in candidate’s venue) but did not seem to affect candidate. |
| C009 | Q | Slight delay 2 secs |
| C010 | R | Some noise (talking) coming from room in Medellin. There was some delay 2-3 secs in audio. Made it a little hard for me to time my next question. |
| C011 | Q | Delay had a slight negative affect (examiner and candidate spoke over each other) |
| C012 | R | Screen (from where I sat) kept changing size. Some delay in audio and some ‘freezing’ in video |
| C014 | R | Some delays in sound/video make it hard to “calculate” the right time to pose the following question. We had a lot of noise in our room in Bogota when I asked the invigilator, she said they couldn’t hear anything. |
| C015 | Q | Small freeze 1-2 secs |
| C016 | R | Consistent delays in audio/video; this seemed to affect the candidate |
| C017 | Q | One small freeze, generally OK. Slight 2 sec delay |
| C019 | Q | Slight issue at beginning. Candidate couldn’t hear question. |
| C020 | R | A lot of delays. It’s very hard to fathom when the candidate will have heard the entire question |
| C021 | Q | One Q broken up: asked for repetition. Frozen during Part 2. |
| C023 | O | Graded the candidate only up to Part 2. Major delays in sound - I felt like was speaking really unnaturally |
| C024 | O | Slight delay in sound - a little echo/delay when I spoke to candidate |
| C025 | P | It takes me longer to switch from Part 2 to Part 3. There was less delay in this interview. |
| C026 | P | Only the delay affects a little, sometimes it is difficult to let the candidate know they should stop/start speaking. It is also difficult to know when to start the recording as they send the candidate in without notice. Having the card on the screen (here) while the candidate speaks (long turn) does not allow to see the candidate well (only small screen) |
| C028 | P | Delay is always a problem and it takes me much longer to go from Instructions (Part 2) to the start of preparation time and also from the end of individual long turn to Part 3 |
| C030 | O | Slight beeps on the screen during interview. Split second green screen -* A good sound and visual - maybe this allowed me to interact even more? |
| C031 | O | Bleeps during intro part - delay (very slight) in part 1/3. At the beginning of the video recording the screen went green and froze ever so quickly like less than a second (screen green) and 1-2 seconds (screen freeze) but I could see/hear the candidate very clearly. |
| C032 | O | Delay in sound during the intro frame sound increased Delays in Part 1. At times I felt that it (sound delay) affected candidate’s response question. It was easy to navigate around this once aware that this was happening. |
| C033 | P | Delay causes the interview to be a little slower and pauses between sections are longer because you need to be sure the person has heard what you have just said and to wait until the person has finished speaking. |
| C034 | O | Quality was very good but delays in sound during interview. Sound delays throughout the interview. Part 3 there seemed to be a delay of btw 1-2 seconds. Volume needed to be increased on the candidate’s side (Mexico) as the candidate could not hear me well at the start. This issue was resolved. |
| C035 | P | Delay continues to be the main problem. I find it more difficult to come up with questions (Part 3) than usual. |
| C036 | P | There were a few times when the image froze but the audio was on so it was not much of a problem. |
| C040 | O | Delays in sound in Part 1 and 3. I could hear a slight echo got worse in Part 3 |
| C041 | O | Delay in sound made things seem a bit unnatural. I forgot to remove the instruction card in Part 2. |
| C042 | P | Delay! |
| C043 | O | In Part 1 sound cut out for a few seconds. The sound has always been very clear but delays - I think the delays meant that the candidate took longer to respond to candidates.*Delays in sound meant that we were…*speed/flow/candidate interaction |
| C045 | O | In Part 1 sound cut out for a few seconds. The sound has always been very clear but delays - I think the delays meant that the candidate took longer to respond to candidates.*Delays in sound meant that we were…*speed/flow/candidate interaction |
| C046 | P | I switched off the recording at some point at the end of Part 2, I think when I tried to switch off the topic card and I clicked the record button. The audio recording was on until the end of the interview. There was delay but gradually I think you learn to adjust the timings to it. The image froze for a few seconds but this did not affect the quality of the interview. |
| C047 | P | I switched off the recording at some point at the end of Part 2, I think when I tried to switch off the topic card and I clicked the record button. The audio recording was on until the end of the interview. There was delay but gradually I think you learn to adjust the timings to it. The image froze for a few seconds but this did not affect the quality of the interview. |
| C048 | O | Screen went blank - delay is sound |
| C054 | L | Image froze. I can hear the candidate and she can hear me carried on until the end of Part 2 - then called the administrator and asked for help. |
| C057 | L | I couldn’t take the topic card down at the end of Part 2. Had to call the administrator. Went on with card on screen. |
| C059 | L | The candidate said once or twice that he couldn’t hear me very well |
| C060 | N | Video froze for a few seconds in the middle |
| C061 | N | Candidate seemed to lose video feed of me. Problem corrected alone. Audio distortion at about 9 mins 40 secs, corrected after about 10 secs |
| C062 | N | Some problem with delay and synching of video/sound - this was more apparent at the beginning |
| C063 | N | Delay was about 3-5 seconds which affected dynamics a little |
| C064 | N | Due to the time taken at the beginning of Part 2, it is difficult to have the time to ask the ROQ without going over/delays still an issue |
| C065 | N | Delay but I am getting used to it. Invigilator reports some break up of sound on the candidate side but I didn’t notice it. |
| C066 | N | Delays - some impact Interestingly, the candidate didn’t hold eye contact for much of the test |
| C067 | N | The candidate didn’t understand - it isn’t clear to me if this was due to the quality of the sound of her language level. |
| C068 | N | Delays |
| C070 | N | Delays have some impact but not seriously |
| C071 | N | Problem with card seen by examiner but not candidate - hard to log out and re-enter Videocall and re-invite - problem solved |
| C073 | L | Towards the end of the interview the image froze for a couple of seconds. |
| C075 | K | Some delay - card was not showing |
| C076 | K | Image froze at some points but audio was OK. |
| C077 | K | Delays/candidate often needed repetition (language? Or sound quality?) |
| C078 | K | Some delay which caused overlapping (very fluent candidate) |
| C079 | K | Some delay - slight pixilation - did not interfere |
| C081 | K | Candidate’s slow delivery plus delay made communication awkward sometimes. Timing was affected. |
| C082 | K | Some overlapping due to delays and candidate style of delivery |
| C083 | K | In Part 2 when candidate gets stuck you cannot point at items on the card. Shall we read them to the candidate? |
| C086 | K | Image froze in Part 3 but audio was OK |
| C088 | M | At one point the image froze. We just carried on. |
| C089 | M | I forgot the recording again for the first 2 minutes. It froze for 20 seconds. |
| C091 | M | The sound was better in this exam. The delay, only occasionally. |
| C092 | M | Throughout the test there was a 3/4 second delay so there was some overlapping between me and the candidate. |
| C094 | M | Still a slight delay of 3/4 seconds and so we interrupted each other a lot. |
| C096 | M | Loud noise of plane(?) flying overhead at one moment on candidate’s side. |
Appendix 6: Location and technical specifications
(Extracted from unpublished technical reports submitted internally to the British Council by Patel (2016) and Ruiz (2016).)
1 Location
The specific locations selected for Study 3 are in Latin America, namely Bogotá, Colombia; Buenos Aires, Argentina; Caracas, Venezuela; Medellín, Colombia; Mexico City, Mexico. Each location was chosen because it could either make a specific contribution to the project or had a specific need.
2 Technical specifications
2.1 The platform
The platform used was a Virtual Meeting Room developed by Polycom and supplied by Videocall. Each test is essentially a virtual meeting with the examiner acting as the host and the candidate as the recipient of a meeting invitation.
For a telepresence project like this, the minimum required bandwidth is a 2mbps link, which is enough to establish a HD call. In all locations, a dedicated cable line was used. However, bandwidth was not standard during the test and varied from venue to venue.
The platform enabled individual tests to be videoed. The videos were sent to Videocall’s secure servers and then uploaded to a secure British Council server. Videos were usually sent within a few hours of the test being taken as Videocall staff in the server rooms operate on a 24 hour basis. The maximum time taken for a video to be delivered was 24 hours.
The platform also has a file-sharing facility. This allowed the candidate’s topic card for Part 2 of the test to appear on the screen for the candidate. At this point, the visual of the examiner remained on the screen for the candidate but was smaller and appeared in the top right-hand corner. The topic cards were uploaded at the beginning of the day and examiners chose which one they wanted to use and with a simple click, shared it with the candidate and removed it.
2.2 Security
Polycom RealPresence WebSuite: Encryption is generally considered a point-to-point protocol, requiring both ends to be capable of the same standards in order to work. Polycom RealPresence WebSuite is a SIP and WebRTC based software endpoint running on Microsoft Windows or Apple OSX on a variety of supporting browsers. Securely encrypting UC media transmitted via RP WebSuite is done using HTTPS and SIP security TLS+SRTP which is widely understood and accepted in the common market.
Further Polycom Security Practices: http://www.polycom.co.uk/content/dam/polycom/ common/documents/whitepapers/polycom-uc-security-best-practices-wp-enus.pdf
2.3 Hardware requirements
2.3.1 Laptops and PCs: In all of the venues, standard British Council GTI laptops with i5 processor and 4GB RAM and built-in webcam were used. In one venue, one laptop did not have a webcam and an external webcam was used.
2.3.2 Speakers: External Plantronics Calisto 610 Speakers were used.
2.3.3 MP3 players: Examiners were asked to audio-tape all the tests using regular MP3 players used for IELTS tests. These were used as a back-up in case the video failed.
Footnotes
-
In Phase 2, another test version was also used, but this version was dropped in this phase since both candidates and examiners in Phase 2 had experienced difficulty with a lexical item. ↩
-
In this report (as well as in our previous reports on Phases 1 and 2 of the project), ‘live tests’ refer to experimental IELTS Speaking tests that are performed by volunteer test-takers with trained and certified IELTS examiners. ↩
-
Double-marking was conducted for 82 performances, as seven videos had some technical problems and could not be reliably rated. ↩
-
See https://www.ielts.org/teaching-and-research/test-taker-performance for mean band scores for male and female test-takers and mean band scores by country. ↩
-
For convenience, the two questions are numbered as Q1 and Q2 in this section, though these items had different question numbers in both the test-taker and examiner feedback questionnaires. ↩