
Exploring performance across two delivery modes for the IELTS Speaking Test: Face-to-face and video-conferencing delivery (Phase 2)
Official IELTS research report on Examiners and Scoring - Speaking; IELTS Test - Speaking, published in 2017.
Abstract
Face-to-face speaking assessment is widespread as a form of assessment, since it allows the elicitation of interactional skills. However, face-to-face speaking test administration is also logistically complex, resource-intensive and can be difficult to conduct in geographically remote or politically sensitive areas. Recent advances in video-conferencing technology now make it possible to engage in online face-to-face interaction more successfully than was previously the case, thus reducing dependency upon physical proximity. A major study was, therefore, commissioned to investigate how new technologies could be harnessed to deliver the face-to-face version of the IELTS Speaking test.
Phase 1 of the study, carried out in London in January 2014, presented results and recommendations of a small-scale initial investigation designed to explore what similarities and differences, in scores, linguistic output and test-taker and examiner behaviour, could be discerned between face-to-face and internet-based video-conferencing delivery of the Speaking test (Nakatsuhara, Inoue, Berry and Galaczi, 2016). The results of the analyses suggested that the speaking construct remains essentially the same across both delivery modes.
This report presents results from Phase 2 of the study, which was a larger-scale follow-up investigation designed to:
(i) analyse test scores obtained using more sophisticated statistical methods than was possible in the Phase 1 study (ii) investigate the effectiveness of the training for the video-conferencing-delivered test which was developed based on findings from the Phase 1 study (iii) gain insights into the issue of sound quality perception and its (perceived) effect (iv) gain further insights into test-taker and examiner behaviours across the two delivery modes (v) confirm the results of the Phase 1 study.
Phase 2 of the study was carried out in Shanghai, People’s Republic of China in May 2015. Ninety-nine (99) test-takers each took two speaking tests under face-to-face and internet-based video-conferencing conditions. Performances were rated by 10 trained IELTS examiners. A convergent parallel mixed-methods design was used to allow for collection of an in-depth, comprehensive set of findings derived from multiple sources. The research included an analysis of rating scores under the two delivery conditions, test-takers’ linguistic output during the tests, as well as short interviews with test-takers following a questionnaire format. Examiners responded to two feedback questionnaires and participated in focus group discussions relating to their behaviour as interlocutors and raters, and to the effectiveness of the examiner training. Trained observers also took field notes from the test sessions and conducted interviews with the test-takers.
Many-Facet Rasch Model (MFRM) analysis of test scores indicated that, although the video-conferencing mode was slightly more difficult than the face-to-face mode, when the results of all analytic scoring categories were combined, the actual score difference was negligibly small, thus supporting the Phase 1 findings. Examination of language functions elicited from test-takers revealed that significantly more test-takers asked questions to clarify what the examiner said in the video-conferencing mode (63.3%) than in the face-to-face mode (26.7%) in Part 1 of the test. Sound quality was generally positively perceived in this study, being reported as ‘Clear’ or ‘Very clear’, although the examiners and observers tended to perceive it more positively than the test-takers. There did not seem to be any relationship between sound quality perceptions and the proficiency level of test-takers. While 71.7% of test-takers preferred the face-to-face mode, slightly more test-takers reported that they were more nervous in the face-to-face mode (38.4%) than in the video-conferencing mode (34.3%).
All examiners found the training useful and effective, the majority of them (80%) reporting that the two modes gave test-takers equal opportunity to demonstrate their level of English proficiency. They also reported that it was equally easy for them to rate test-taker performance in face-to-face and video-conferencing modes.
The report concludes with a list of recommendations for further research, including suggestions for further examiner and test-taker training, resolution of technical issues regarding video-conferencing delivery and issues related to rating, before any decisions about deploying a video-conferencing mode of delivery for the IELTS Speaking test are made.
1 Introduction
A preliminary study of test-taker and examiner behaviour across two different delivery modes for the same L2 speaking test - the standard face-to-face test (F2F) administration, and test administration using Zoom 1 technology, was carried out in London in January 2014. A report on the findings of the study was submitted to the IELTS partners (British Council, Cambridge English Language Assessment, IDP IELTS Australia) in June 2014, and was subsequently published on the IELTS website (Nakatsuhara, Inoue, Berry and Galaczi, 2016). (See also Nakatsuhara, Inoue, Berry and Galaczi (2017) for a theoretical, construct-focused discussion on delivering the IELTS Speaking test in face-to-face and video-conferencing modes.)
The initial study sought to compare performance features across the two delivery modes with regard to two key areas:
(i) an analysis of test-takers’ linguistic output and scores on the two modes and their perceptions of the two modes (ii) an analysis of examiners’ test management and rating behaviours across the two modes, including their perceptions of the two conditions for delivering the speaking test.
The findings suggested that, while the two modes generated non-significantly different test scores, there were some differences in functional output and examiner interviewing and rating behaviours. In particular, some interactional language functions were elicited differently from the test-takers in the two modes, and the examiners seemed to use different turn-taking techniques under the two conditions. Although the face-to-face model tended to be preferred, some examiners and test-takers felt more comfortable with the computer mode than face-to-face. The report concluded with recommendations for further research, including examiner and test-taker training, and resolution of technical issues which needed to be addressed before any decisions could be made about introducing (or not) a speaking test using video-conferencing technology.
Three specific recommendations of the first study which are addressed in the follow-up study reported here are as follows:
1.1. Examiner and test-taker training
- All comments from both examiners and test-takers pointed to the need for explicit examiner and test-taker training if the introduction of computer-based oral testing is to be considered in the future. The possibility that the interaction between the test mode and discourse features might have resulted in slightly lower Fluency scores, highlights the importance of counteracting the possible disadvantages under the video-conferencing mode through examiner training and awareness raising.
- It is also considered very important to train examiners in the use of the technology and also develop materials for test-takers to prepare themselves for video-conferencing delivery. The study could then be replicated and similar analyses performed without the confounding variable of computer familiarity.
1.2 Larger-scale replication and a multiple-marking design
- Replicating the study with a larger data set would reveal any possible differential effects of the delivery mode and would also enable more sophisticated, accurate statistical analysis, leading to more generalisable conclusions.
- A multiple rating design which allows more rigorous Many-Facet Rasch Model (MFRM) analysis should be implemented in future research. The group anchoring method used in the original study assumes that the groups were in effect equivalent.
However, the groups in that study contained small numbers of test-takers (N=8 each), which limits the generalisability of the results.
Although the assumption of equivalence was largely borne out by the very close mean raw scores for the four groups, one of the groups exhibited a slightly higher mean raw score than the other groups. It is important, therefore, to carry out a more rigorous MFRM study with a multiple rating design in order to confirm the results of this study.
1.3 Sound quality perception
- A concern was raised by the technical advisor in the Phase 1 study that some test-takers might blame the sound quality for their (poor) performance when the sound and transmission were both fine. The technical advisor recorded and monitored all test sessions in real time, and he was able to identify such cases. The researchers who observed the test sessions in real time also raised another concern regarding possible differential effects of the same sound quality on weaker and stronger test-takers, disadvantaging weaker test-takers. Although the score analysis in the Phase 1 study showed that test scores were comparable between the face-to-face and video-conferencing modes for both stronger and weaker test-takers (Nakatsuhara et al., 2016), it is important to investigate further how weaker and stronger test-takers perceive sound quality in the video-conferencing test and how it affects their performance.
Following completion of the initial study, and in preparation for this second study, two experienced IELTS examiners/examiner trainers were commissioned to develop materials for both examiner training in the use of video-conferencing delivery and to prepare test-takers for the video-conferencing delivered speaking test.
The study reported here is, therefore, a larger-scale, follow-up investigation that was designed for five main purposes:
- to analyse test scores using more sophisticated statistical methods
- to investigate the effectiveness of the training for the video-conferencing-delivered test which was developed based on the findings from the 2014 study
- to gain insights into the issue of sound quality perception and its (perceived) effect
- to gain further insights into test-taker and examiner behaviours across the two delivery modes
- to confirm the results of the 2014 study.
2 Literature review: Video-conferencing and speaking assessment
Face-to-face interaction no longer depends upon physical proximity within the same location, as recent technical advances in online video-conferencing technology have made it possible for users in two or more locations to successfully communicate in real time through audio and video. Video-conferencing applications, such as Skype and Facetime, are now commonly used to communicate in personal or professional settings when those involved are in different locations. The use of video-conferencing is also prevalent in educational contexts, including second/foreign (L2) learning (e.g. Abrams, 2003; Smith, 2003; Yanguas, 2010). Video-conferencing in L2 speaking assessment is less widely used, and research on this test mode is scarce, notable exceptions being studies by Clark and Hooshmand (1992), Craig and Kim (2010), Kim and Craig (2012) and Davis, Timpe-Laughlin, Gu and Ockey (forthcoming).
The research study reported here was motivated by the need for test providers to keep under constant review the extent to which their tests are accessible and fair to as wide a constituency of test users as possible. Face-to-face tests for assessing spoken language ability offer many benefits, particularly the opportunity for reciprocal interaction. However, face-to-face speaking test administration is usually logistically complex and resource-intensive, and the face-to-face mode may, therefore, be impossible to conduct in geographically remote or politically unstable areas. An alternative in such circumstances could be to use a semi-direct speaking test where the test-taker speaks in response to recorded input, usually delivered by computer. A disadvantage of this approach is that the delivery mode precludes reciprocal interaction between speakers, thus constraining the test construct.
It is appropriate, therefore, to explore how new technologies can be harnessed to deliver and conduct the face-to-face version of an existing speaking test, and to discern what similarities and differences between the two modes exist. Such an exploration holds the potential for a practical, theoretical and methodological contribution to the L2 assessment field. First, it contributes to an under-researched area which, due to technological advances, is now becoming a viable possibility in speaking assessment and, therefore, provides an opportunity to collect validity evidence supporting the use (or not) of the video-conferencing mode as a parallel alternative to the standard face-to-face variant. Second, such an investigation could contribute to theoretical construct-focused discussions about speaking assessment in general. Finally, the investigation presents a methodological contribution through the use of a mixed-methods approach which integrates quantitative and qualitative data.
2.1 Role of test mode in speaking assessment
Face-to-face speaking tests have been used in L2 assessment for over a century (Weir, Vidakovic and Galaczi, 2013) and, in the process, have been shown to offer many beneficial validity considerations, such as an underlying interactional construct and positive impact on learning. However, they are constrained by low practicality due to the ‘right-here-right-now’ nature of face-to-face tests and the need for the development and maintenance of a worldwide cadre of trained examiners. The resource-intensive demands of face-to-face speaking tests have given rise to several more practical alternatives, namely semi-direct speaking tests (involving the elicitation of test-taker speech with machine-delivered prompts and scoring by human raters) and automated speaking tests (both delivered and scored by computer). With several different test modes aiming to tap into communicative speaking ability, a fundamental question to ask is whether, and/or how, the delivery medium changes the nature of the construct being measured.
Despite research which has reported overall score and difficulty equivalence between computer-delivered and face-to-face tests and, by extension, construct comparability (Bernstein, Van Moere and Cheng, 2010; Kiddle and Kormos, 2011; Stansfield and Kenyon, 1992), theoretical discussions and empirical studies which go beyond sole score comparability have highlighted the fundamental construct-related differences between different test formats. Essentially, semi-direct and automated speaking tests are underpinned by a psycholinguistic construct, which places emphasis on the cognitive dimension of speaking, as opposed to the socio-cognitive construct of face-to-face tests, where speaking is seen both as a cognitive trait and a social, interactional one (Galaczi, 2010; McNamara and Roever, 2006; van Moere, 2012). Studies (Hoejke and Linnell, 1994; Luoma, 1997; O’Loughlin, 2001; O’Sullivan, Weir and Saville, 2002; Shohamy, 1994) have also highlighted differences in the language elicited in different formats.
Differences between different speaking test formats have also been reported from a cognitive validity perspective, since the choice of format impacts the cognitive processes which a test can activate. Field (2011) notes that interactional face-to-face formats entail processing input from interlocutor(s), keeping track of different points of view and topics, and forming judgements in real time about the extent of accommodation to the interlocutor’s language. These kinds of cognitive decisions impose processing demands on test-takers which are absent in computer-delivered tests.
Test-takers’ perceptions have also been found to differ according to test format, with research (Clark, 1988; Kenyon and Malabonga, 2001; Stansfield, 1990) indicating that test-takers report a sense of nervousness and lack of control when taking a semi-direct test in that the test-taker’s role is controlled by the machine, which cannot offer any support in cases of test-taker difficulty. It is also notable that if a group of test-takers expresses a significantly stronger preference for one mode over another, they seem to be in favour of the face-to-face mode (Kiddle and Kormos, 2011; Qian, 2009).
2.2 Video-conferencing and speaking assessment
The choice of speaking test format is, therefore, not without theoretical and practical consequences, as the different formats offer their own unique advantages, but inevitably come with certain limitations. As Qian (2009:124) reminds us in the context of a computer-based speaking test:
This technological development has come at a cost of real-life human interaction, which is of paramount importance for accurately tapping oral language proficiency in the real world. At present, it will be difficult to identify a perfect solution to the problem but it can certainly be a target for future research and development in language testing.
Such a development in language testing can be seen in recent technological advances which involve the use of video-conferencing in speaking assessment. This new mode preserves the co-constructed nature of face-to-face speaking tests while offering the practical advantage of remotely connecting test-takers and examiners who could be continents apart. As such, it reduces some of the practical difficulties of face-to-face tests while preserving the interactional construct of this test format.
The use of a video-conferencing system in English language testing is not a recent development. In 1992, a team at the U.S. Defense Language Institute’s Foreign Language Center conducted an exploratory study of ‘screen-to-screen testing’, i.e. testing using video-conferencing (Clark and Hooshmand, 1992). The study was enabled by
technical developments at the Defense Language Institute, such as the use of satellite-based video technology which could broadcast and receive, in (essentially) real-time, both audio and video. The technology had previously been mostly used for language instruction, and the possibility of incorporating it in assessment settings was explored in the study. The focus was a comparison of the face-to-face and video-conferencing modes in tests of Arabic and Russian. The researchers reported no significant difference in performance in terms of scores, but did find an overall preference by test-takers for the face-to-face mode; no preference for either test mode was reported by the examiners.
In two more recent studies, Craig and Kim (2010) and Kim and Craig (2012) compared the face-to-face and video-conferencing modes with 40 English language learners whose first language was Korean. Their data comprised analytic scores on both modes (on Fluency, Functional Competence, Accuracy, Coherence, Interactiveness) and also test-taker feedback on ‘anxiety’ in the two modes, operationalised as ‘nervousness’ before/after the test and ‘comfort’ with the interviewer, test environment and speaking test (Craig and Kim, 2010:17). The results showed no statistically significant difference between global and analytic scores on the two modes, and the interview data indicated that most test-takers ‘were comfortable with both test modes and interested in them’ (Kim and Craig, 2012:268). The authors concluded that the video-conferencing mode displayed a number of test usefulness characteristics (Bachman and Palmer, 1996), including reliability, construct validity, authenticity, interactiveness, impact and practicality. In terms of test-taker anxiety, a significant difference emerged, with anxiety before the face-to-face mode found to be higher.
In a further study which focused on investigating a technology-based group discussion test, Davis, Timpe-Laughlin, Gu and Ockey (forthcoming) describe a project carried out by Educational Testing Service (ETS) which evaluated the use of video-conferencing technology for group discussions in four speaking tasks requiring interaction between a moderator and several participants. Sessions were conducted in four different states in the United States and in three mainland Chinese cities. In the U.S. sessions, participants and moderator were located in different states, and in the Chinese sessions the participants were in one of three cities, with the moderator in the U.S. Focus group responses revealed that most participants expressed favourable opinions of the tasks and technology, although internet instability in China caused some disruption. The researchers concluded that video-mediated group discussions hold much promise for the future, although technological issues remain to be fully resolved.
3. Research questions
The research questions addressed in this phase of the project are as follows.
- RQ1: Are there any differences in scores awarded between face-to-face and video-conferencing conditions?
- RQ2: Are there any differences in linguistic features, specifically types of language function, found under face-to-face and video-conferencing conditions?
- RQ3: To what extent did sound quality affect performance on the test? a) as perceived by test-takers, examiners and observers? b) as found in test scores?
- RQ4: How effective was the training for the video-conferencing test? a) for examiners as administrators/interlocutors managing the interaction? b) for examiners as raters? c) for test-takers?
- RQ5: What are the examiners’ and test-takers’ perceptions of the two delivery modes?
4. Methodology
As in the Phase 1 study, this study used a convergent parallel mixed-methods design (Creswell and Plano Clark, 2011), where quantitative and qualitative data were collected in two parallel strands, were analysed separately and findings were integrated. The two data strands provide different types of information and will allow for an in-depth and comprehensive set of findings. Figure 1 gives an overview of the Phase 2 research design, showing what data were collected, analysed and triangulated to explore and give detailed insights from multiple perspectives into how the video-conferencing delivery mode compares with the more traditional face-to-face mode.

Figure 1: Phase 2 research design
4.1. Participants
One hundred and twenty students at the Sydney Institute of Language and
Communication (SILC) Business School, Shanghai University, signed up in advance to participate in the study. The research team requested balanced profiles of the participants in terms of gender (60 males and 60 females) and estimated IELTS Speaking test bands (approximately 24 students each at Bands 4/4.5, 5/5.5, 6/6.5, 7/7.5). However, due to practical constraints, the local test organisers had difficulty in matching the profiles of the available test-takers to the ones the research team had requested. Additionally, for a variety of reasons, not all test-takers who signed up were eventually able to participate.
The actual data were, therefore, collected from 99 test-takers, of which 26 were male (26.3%) and 73 were female (73.7%). The range of the face-to-face IELTS Speaking scores (rounded overall scores) of these test-takers was from Band 1.5 to Band 7.0 (Mean=5.11, SD=0.97), and the majority of their score bands clustered around Bands 5.0, 5.5 and 6.0 (see Figure 2 in Section 5.1). This score range was lower and narrower than originally planned by the research team, but was nevertheless considered adequate for the purposes of the study, since it was broadly representative of the IELTS test-taker population.
Ten trained, certificated and experienced IELTS examiners (i.e. Examiners A-J), also participated in the research, with permission from IELTS managers. Additionally, eight PhD Applied Linguistics students from Shanghai Jiao Tong University were trained to act as observers, observed all test sessions, took observation notes and interviewed test-takers on completion of both modes of the speaking test.
4.2. Data collection
Prior to the research data collection, a one-day examiner training session for administering and rating video-conferencing-delivered tests was conducted by an experienced examiner trainer. The training was carried out with materials that were developed by a team, based on the Phase 1 study. The team consisted of two researchers, one examiner, and one examiner trainer who were all involved in the Phase 1 study and the project manager of the current study. The team also developed bi-lingual (English and Mandarin Chinese) video-conferencing test guidelines for test-takers to familiarise themselves with video-conferencing delivered tests.
4.2.1. Speaking test performances and test-taker feedback questionnaire
All 99 test-takers took both face-to-face and video-conferencing-delivered tests in a counter-balanced order. Six versions of the IELTS Speaking test (i.e. Travelling, Success, Teacher, Film, Website, Event) were used, and examiners were instructed to use the six versions in a randomised order, but to use each one relatively equally. The counter-balancing of the two test modes and the six test versions seemed to work well, as evidenced by two-way between-groups ANOVAs which were carried out to explore the impact of test order and test version on both face-to-face and video-conferencing delivered test scores, respectively. There was no statistically significant main effect or interaction effect ([F2F] test order: , , test version: , , test order*test version: , ; [VC] test order: , , test version: , , test order*test version: , ).
Data collection was carried out over five days. On each day, four parallel test sessions were administered (two face-to-face and two video-conferencing sessions). Four examiners carried out test sessions on each day (i.e. Day 1 - Examiners A, B, C, D; Day 2 - Examiners E, F, G, H; Day 3 - Examiner I, J, B, H; Day 4 - Examiners A, I, C, G; Day 5 - Examiners D, F, E, J).
Each examiner examined 12 test-takers in both modes of delivery (i.e. 24 test sessions) across two days. Of the four examiners on each day, two examiners were paired to switch between F2F and video-conferencing examiner rooms, and they were paired with different examiners on the two days they participated in the research.
Table 1 shows the data collection matrix used for two examiners on Day 1.
| Time | Face-to-face room | Examiner Video-conferencing room | Test-taker Video-conferencing room |
|---|---|---|---|
| 9:30-9:50(inc. 5-min admin time) | Examiner A - Test-taker 1 (Ob 1) | Examiner B - Test-taker 7 (Ob 2) | Examiner B - Test-taker 7 (Ob 3) |
| 9:50-10:10 | Examiner B - Test-taker 7 (Ob 2) | Examiner A - Test-taker 1 (Ob 1) | Examiner A - Test-taker 1 (Ob 3) |
| 5 mins for Test-taker interview | Observer 2 - Test-taker 7 | Observer 3 - Test-taker 1 | |
| 10:15-10:35 | Examiner B - Test-taker 8 (Ob 2) | Examiner A - Test-taker 2 (Ob 1) | Examiner A - Test-taker 2 (Ob 3) |
| 10:35-10:55 | Examiner A - Test-taker 2 (Ob 1) | Examiner B - Test-taker 8 (Ob 2) | Examiner B - Test-taker 8 (Ob 3) |
| 5 mins for Test-taker interview | Observer 1 - Test-taker 2 | Observer 3 - Test-taker 8 | |
| 15 mins + 5 mins above | Examiner break | ||
| 11:15-11:35 | Examiner A - Test-taker 3 (Ob 1) | Examiner B - Test-taker 9 (Ob 2) | Examiner B - Test-taker 9 (Ob 3) |
| 11:35-11:55 | Examiner B - Test-taker 9 (Ob 2) | Examiner A - Test-taker 3 (Ob 1) | Examiner A - Test-taker 3 (Ob 3) |
| 5 mins for Test-taker interview | Observer 2 - Test-taker 9 | Observer 3 - Test-taker 3 | |
| 12:00-12:20 | Examiner B - Test-taker 10 (Ob 2) | Examiner A - Test-taker 4 (Ob 1) | Examiner A - Test-taker 4 (Ob 3) |
| 12:20-12:40 | Examiner A - Test-taker 4 (Ob 1) | Examiner B - Test-taker 10 (Ob 2) | Examiner B - Test-taker 10 (Ob 3) |
| 5 mins for Test-taker interview | Observer 1 - Test-taker 4 | Observer 3 - Test-taker 10 | |
| 1 hour | - Lunch break - | ||
| 13:45-14:05 | Examiner A - Test-taker 5 (Ob 1) | Examiner B - Test-taker 11 (Ob 2) | Examiner B - Test-taker 11 (Ob 3) |
| 14:05-14:25 | Examiner B - Test-taker 11 (Ob 2) | Examiner A - Test-taker 5 (Ob 1) | Examiner A - Test-taker 5 (Ob 3) |
| 5 mins for Test-taker interview | Observer 2 - Test-taker 11 | Observer 3 - Test-taker 5 | |
| 14:30-14:50 | Examiner B - Test-taker 12 (Ob 2) | Examiner A - Test-taker 6 (Ob 1) | Examiner A - Test-taker 6 (Ob 3) |
| 14:50-15:10 | Examiner A - Test-taker 6 (Ob 1) | Examiner B - Test-taker 12 (Ob 2) | Examiner B - Test-taker 12 (Ob 3) |
| 5 mins for Test-taker interview | Observer 1 - Test-taker 6 | Observer 3 - Test-taker 12 | |
| 15 mins + 5 mins above | Examiner break - | ||
| 15:30-15:50 | Examiners A and B: complete Examiner Questionnaire |
Key Examiner A with Observer 1; Examiner B with Observer 2; Observer 3 in Test-taker-VC Room Test-takers 1-12; Observer 1 observes all test sessions by Examiner A; Observer 2 observes all test sessions by Examiner B; Observer 3 observes all VC test-taker sessions
All test sessions were audio- and video-recorded. Digital audio recorders, as in the standard IELTS practice, were used for audio-recording. The face-to-face tests were filmed professionally using external cameras, and the video-conferencing tests were video-recorded using Zoom’s on-screen recording technology.
After two test sessions (i.e. one face-to-face test, one video-conferencing test), test-takers were interviewed by one of the observers. The interview followed 12 questions specified in a test-taker questionnaire, and test-takers were also asked to elaborate on their responses wherever appropriate. The first two questions (Q1-2) were about the usefulness of the test-taker guidelines for the video-conferencing delivered tests.
The next four questions (Q3-6) were on their test-taking experience in both face-to-face and video-conferencing modes. Q7 and Q8 related to their perception of the sound quality and the extent to which they thought the quality of the sound in the video-conferencing test affected their performances. The last four questions were comparative questions between the two modes of the test. (See Appendix 1 for a copy of the questionnaire). Interviews were conducted in either English or Chinese, according to test-takers’ preferences. The observers noted test-takers’ responses to the 12 questions and all elaborations on the questionnaire (translated into English where necessary). Each interview took approximately five minutes.
4.2.2. Observers’ field notes
On each of the five data collection days, six observers stayed in six different test rooms and took field notes (i.e. two in face-to-face rooms, two in video-conferencing-examiner rooms, and two in video-conferencing-test-taker rooms). Two of them stayed in the video-conferencing-test-taker rooms so that they could see all test-takers performing under the video-conferencing test condition.
The other four observers observed test sessions in both face-to-face and video-conferencing examiner rooms. Each of them followed one particular examiner on the day, to enable them to observe the same examiner’s behaviour under the two test delivery conditions. The research design ensured that different observers observed different examiners across the five days.
The observers used a template for their field notes. The template included blank spaces for each part of the test and a blank space for general comments, such as technical issues and delay in starting. At the bottom of the template, there were two questions regarding their perceptions of the sound quality and the extent to which they thought the quality of the sound in the video-conferencing test affected test-takers’ performances.
During training, the observers had been advised that they could take observation notes in either English or Chinese or a combination of both. Following completion of each day’s test sessions, the observers typed up their notes (translated into English if necessary) and submitted them electronically to one of the researchers.
4.2.3. Examiner ratings
Examiners in the live tests awarded scores on each analytic rating category (i.e. Fluency and Coherence, Lexical Resource, Grammatical Range and Accuracy, Pronunciation), according to the standard assessment criteria and rating scales used in operational IELTS tests. In the interest of space, the rating categories are hereafter referred to as Fluency, Lexis, Grammar and Pronunciation.
After the video-conferencing tests, they also responded to two questions that were included at the bottom of each rating sheet. These were the same questions asked of test-takers and observers regarding their perceptions of the sound quality and the extent to which they thought the quality of the sound in the video-conferencing test affected test-takers’ performances.
All test sessions were double-marked by different examiners using the video-recorded performances. Special care was taken to design a double-marking matrix, in order to obtain sufficient overlap between examiners to carry out Many-Facet Rasch Model analysis (MFRM; see Section 4.2). The participating test-takers were divided into groups of six, and each group of six was examined by different combinations of live-test and double-marking examiners (e.g. Test-takers 1-6 were examined by Examiner A in the live face-to-face and video-conferencing test sessions, their face-to-face videos were double-marked by Examiner B, and their video-conferencing videos were double-marked by Examiner J). Each examiner carried out double marking of 24 test-takers (i.e. four groups of six test-takers who were examined by four different live-test examiners.)
4.2.4. Examiner feedback questionnaires
Examiners responded to two questionnaires. The first was the examiner training feedback questionnaire (see Appendix 2) that they completed immediately following the training session provided prior to the five test days. The training feedback questionnaire had 10 questions related to the usefulness of the training session. A free comments space was also available for them to elaborate on their responses.
The second questionnaire was for the actual test administration and rating under the face-to-face and video-conferencing conditions. After finishing all speaking tests on their first examination day, examiners were asked to complete an examiner feedback questionnaire (see Appendix 3) about: a) the effectiveness of examiner training; b) their own behaviour as interlocutor under video-conferencing and face-to-face test conditions; and c) their perceptions towards the two test delivery modes. The questionnaire consisted of 41 questions, including free comments boxes, and took approximately 20 minutes for examiners to complete.
4.2.5. Examiner focus group discussions
As indicated in Table 2, nine of the examiners took part in a focus group discussion following completion of two days of conducting both face-to-face and video-conferencing delivered speaking tests. For logistical reasons, Examiner I was only available to participate in a focus group on Day 3, which represented the first day of his two days of tests. Three or four examiners participated in each discussion, which was facilitated by one of the researchers. The discussions were semi-structured and were designed to achieve further elaboration of the comments made in the examiner feedback questionnaire relating to technical issues, in particular sound quality perceptions, examiner behaviour including the use of gestures and perceptions of the two modes, especially issues relating to stress and comfort levels in the two modes.
Table 2: Focus group schedule
| Day | Live test examiner | Focus groups |
|---|---|---|
| Day 1 | A, B, C, D | - |
| Day 2 | E, F, G, H | - |
| Day 3 | I, J, B, H | B, H, I |
| Day 4 | A, I, C, G | A, C, G |
| Day 5 | D, F, E, J | D, F, E, J |
This section has illustrated an overview of the data collection methods, to provide an overall picture of the research design. The next section will describe the methods used for data analysis.
4.3. Data analysis
4.3.1. Examiner ratings
To address RQ1 of this study (Are there any differences in scores awarded between face-to-face and video-conferencing conditions?), scores awarded under each condition were compared using both Classical Test Theory (CTT) analysis with paired samples t-tests, and Many-Facet Rasch Model (MFRM) analysis using the FACETS 3.71 analysis software (Linacre, 2013). The two analyses are complementary and add insights from different perspectives, but in this study, the MFRM analysis is considered to be the main analytical method due to its greater statistical power.
Although the data distributions indicated slight non-normality, parametric tests were selected for the CTT analysis, since they were thought to be more appropriate to avoid potential Type 2 errors, given the purpose of this research (N. Verhelst, personal communication, 6 May 2016). It should, however, be noted that the CTT analysis does not allow for the identification of variables potentially contributing to score variance, such as rater harshness and test version difficulty.
To overcome this shortcoming, we then carried out a MFRM analysis. The MFRM analysis offers more accurate insights into the impact of delivery mode on the scores, and also helps us to investigate rater consistency, as well as potential differences in difficulty across the test versions and the analytic rating scales used in the two modes. Sufficient connectivity in the dataset to enable the MFRM analysis was achieved through a double-marking model.
4.3.2. Language functions
Due to time constraints, of the 99 recordings that were judged to be viable for further analysis, 30 recordings were selected for language function analysis to examine whether or not the two modes of delivery elicited comparable language functions from test-takers. Special care was taken to select representative samples of the entire 99 samples in terms of the levels of proficiency. Selected test-takers included one test-taker at Band 7.5, two at Band 6.5, eleven at Band 6.0, six at Band 5.5, six at Band 5.0 and four at Band 4.5. The 30 test sessions also involved all 10 examiners.
Following the methodology used in the Phase 1 study, a modified version of O’Sullivan et al.’s (2002) observation checklist was used. For the modifications made to the checklist and the justifications, see Nakatsuhara et al.’s (2016) Phase 1 report. Two researchers who are familiar with the checklist watched all videos and coded elicited language functions specified in the list. Since the two researchers had been standardised one year previously for the use of the checklist in the Phase 1 study, only two performances were first of all coded together to help them to refresh their memories. Any discrepancies that arose in their coding results were discussed until agreement was reached. The remaining data set was then divided into two groups and coded by one of the researchers independently. However, for any uncertainties that occurred while coding, a consensus was reached between them.
Based on the methodology employed in Phase 1 of the project, the focus of the coding was on whether each function was elicited in each part of the test, rather than how many instances of each function were observed. The researchers also took notes of any salient and/or typical ways in which each language function was elicited under the two test conditions. This was to enable transcription of relevant parts of the speech samples and detailed analysis of them. The results obtained from the face-to-face and video-conferencing delivered tests were then compared using McNemar’s tests to address RQ2 (Are there any differences in linguistic features, specifically types of language function, found under face-to-face and video-conferencing conditions?).
4.3.3. Test-taker feedback questionnaire
Closed questions in the test-taker feedback questionnaire were analysed using descriptive and inferential statistics to understand their perceptions of the sound quality (RQ3a: To what extent did sound quality affect performance on the test?), the usefulness of the test-taker guidelines (RQ4c: How effective was the training for the video-conferencing test?) and any trends in their test-taking experience under the two delivery conditions (RQ5: What are the [examiners’ and] test-takers’ perceptions of the two delivery modes?).
Their open-ended comments were used to interpret the statistical results and to illuminate the results obtained by other data sources.
The responses to the following two questions on sound quality, included in the test-taker feedback questionnaire, as well as the examiner’s rating sheet and the observer’s observation sheet, were compared among the three groups.
- Do you think the quality of the sound in the video-conferencing test was… [1. Not clear at all, 2. Not always clear, 3. OK, 4. Clear, 5. Very clear]
- Do you think the quality of the sound in the video-conferencing test affected test-takers’ (or ‘your’ in the test-taker questionnaire) performance? [1. No, 2. Not much, 3. Somewhat, 4. Yes, 5. Very much]
Whenever appropriate, test-takers’ feedback responses were compared to those obtained in the Phase 1 study, in order to identify the effectiveness of the training provided in this phase of the study.
4.3.4. Examiner feedback questionnaires
As with the test-taker feedback questionnaires, the examiner training feedback questionnaire and the examiner feedback questionnaire were analysed to inform RQ3 (sound quality perceptions), RQ4 (examiner behaviour and the effect of examiner training) and RQ5 (examiners’ perceptions of the two modes). Closed questions in both questionnaires were analysed statistically, and open-ended comments were used to interpret the statistical results and to illuminate the results obtained by other data sources. Wherever possible, the results were compared with those of the Phase 1 study.
4.3.5. Observers’ field notes
As described in Section 4.2.2, three observation notes were produced for each of the 99 pairs of an examiner and a test-taker: one from the face-to-face (F2F) room, one from the examiner video-conferencing (VC) room, and one from the test-taker VC room. All the notes were collated and put into an Excel datasheet, with each line representing a test-taker and columns containing notes from all three parts of the IELTS Speaking tests on both delivery modes from three different exam rooms (i.e. F2F room, test-taker VC room, examiner VC room).
NVivo Version 11 (QSR International, 2016) was then used to thematically analyse the notes, coding what types of examiner and test-taker behaviour were observed across the two different delivery modes. This analysis was to gain further insights into the extent to which the examiners and test-takers seem to have used what was taught in the training, and to identify any further needs for training.
4.3.6. Examiner focus group discussions
All three focus group discussions were fully transcribed and reviewed by the researchers to identify key topics and perceptions discussed by the examiners. These topics and perceptions were then captured in spreadsheet format so they could be coded and categorised according to different themes, such as ‘speed and articulation of speech’, ‘nodding and gestures’ and ‘comfort levels of examiners and test-takers’, in order to inform RQ4 (examiner behaviour and the effect of examiner training) and RQ5 (examiners’ perceptions of the two modes).
5. Results
5.1. Rating scores
5.1.1. Classical Test Theory (CTT) analysis
Figures 2 and 3 present the overall scores that test-takers received during the live tests under the two test delivery conditions. As mentioned earlier, most of the score bands cluster around Bands 5.0, 5.5 and 6.0.
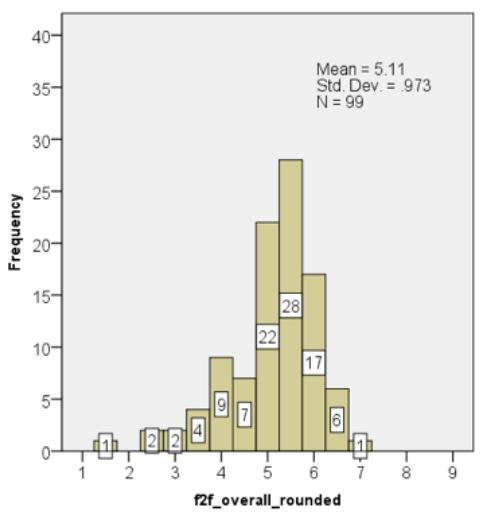
Figure 2: F2F overall scores (rounded)

Figure 3: VC overall scores (rounded)
Table 3 shows both descriptive statistics and inferential statistics on live-test scores using paired samples t-tests.
Table 3: Paired-samples t-tests on test scores awarded in live 2 tests (N=99)
| Rating category | Test mode | Mean | SD | Max | Min | Mean diff. | t | Sig. (2-tailed) | Effect size (d) |
|---|---|---|---|---|---|---|---|---|---|
| Fluency | F2F | 5.152 | 1.082 | 7.00 | 1.00 | .040 | .754 | .452 | - |
| Fluency | VC | 5.111 | 1.151 | 7.00 | 1.00 | .040 | .754 | .452 | - |
| Lexis | F2F | 5.091 | 1.070 | 7.00 | 1.00 | .111 | 2.006 | .048 | .201 |
| Lexis | VC | 4.980 | 1.069 | 7.00 | 2.00 | .111 | 2.006 | .048 | .201 |
| Grammar | F2F | 5.242 | 1.000 | 7.00 | 2.00 | .081 | 1.581 | .117 | - |
| Grammar | VC | 5.162 | 1.027 | 7.00 | 2.00 | .081 | 1.581 | .117 | - |
| Pronunciation | F2F | 5.333 | 1.030 | 8.00 | 2.00 | .091 | 1.901 | .060 | - |
| Pronunciation | VC | 5.242 | .970 | 7.00 | 2.00 | .091 | 1.901 | .060 | - |
| Overall (mean) | F2F | 5.205 | .978 | 7.25 | 1.50 | .081 | 2.754 | .007 | .276 |
| Overall (mean) | VC | 5.124 | .976 | 6.75 | 1.75 | .081 | 2.754 | .007 | .276 |
| Overall (rounded) | F2F | 5.111 | .973 | 7.00 | 1.50 | .076 | 2.283 | .025 | .229 |
| Overall (rounded) | VC | 5.035 | .967 | 6.50 | 1.50 | .076 | 2.283 | .025 | .229 |
Note: The first overall category shows mean overall scores, and the second overall category shows overall scores that are rounded down as in the operational IELTS test (i.e. where 6.75 becomes 6.5, 6.25 becomes 6.0, etc.).
Descriptive statistics show that the mean scores of all four rating categories and of two overall scores (mean and rounded) under the face-to-face (F2F) condition were slightly higher than those under the video-conferencing (VC) condition, although the actual score differences were very small. There were significant differences in test scores awarded to the Lexis category and two overall scores . However, the effect sizes of these significant differences were all small (Cohen’s d=0.201, 0.276 and 0.229, respectively), according to Cohen’s (1988) criteria, i.e. small: r=.2, medium: r=.5, large: r=.8.
Another set of CTT analysis was carried out, using average scores from live-test and double-marking examiners. As presented in Table 4 below, while mean scores were still consistently higher in the face-to-face mode, none of the score differences was statistically significant. This indicates that the statistical significance shown in Table 3 was obtained as a result of scoring errors related to the single rating system. That is, relying only on live-test examiners’ scores could potentially inflate the difference between the two test delivery modes, and this could perhaps be ameliorated if double marking became possible.
Table 4: Paired samples t-tests on average test scores from live-test and double-marking examiners (N=99)
| Rating category | Test mode | Mean | SD | Max | Min | Mean diff. | t | Sig. (2-tailed) |
|---|---|---|---|---|---|---|---|---|
| Fluency | F2F | 5.106 | 1.026 | 7.50 | 1.50 | .020 | .411 | .682 |
| Fluency | VC | 5.086 | 1.020 | 7.00 | 1.50 | .020 | .411 | .682 |
| Lexis | F2F | 5.111 | 1.046 | 7.50 | 1.50 | .061 | 1.298 | .197 |
| Lexis | VC | 5.051 | 1.009 | 7.00 | 1.50 | .061 | 1.298 | .197 |
| Grammar | F2F | 5.227 | 0.921 | 7.50 | 2.00 | .056 | 1.257 | .212 |
| Grammar | VC | 5.172 | 0.912 | 7.00 | 2.00 | .056 | 1.257 | .212 |
| Pronunciation | F2F | 5.242 | 0.970 | 8.00 | 2.00 | .040 | .942 | .348 |
| Pronunciation | VC | 5.202 | 0.966 | 7.00 | 1.50 | .040 | .942 | .348 |
| Overall (mean) | F2F | 5.172 | 0.951 | 7.63 | 1.75 | .048 | 1.408 | .162 |
| Overall (mean) | VC | 5.124 | 0.976 | 6.75 | 1.75 | .048 | 1.408 | .162 |
| Overall (rounded) | F2F | 5.078 | 0.947 | 7.50 | 1.75 | .043 | 1.167 | .246 |
| Overall (rounded) | VC | 5.035 | 0.967 | 6.50 | 1.50 | .043 | 1.167 | .246 |
CTT analysis is based on the assumption that any rater severity differences and version difficulty differences have been controlled, and that scoring differences will be related only to test-taker performance and delivery mode. However, by averaging the scores awarded by live-test and double-marking examiners, the second analysis above reduced some scoring errors related to examiner bias.
To confirm these results, MFRM analysis that systematically factors in rater severity and version difficulty was then carried out.
5.1.2. Many-Facet Rasch Measurement (MFRM) analysis
Three sets of MFRM analyses were carried out. First of all, to gain an overall picture of the research results, a partial credit model analysis was carried out using five facets for score variance: test-takers, test versions, examiners, test delivery modes, and rating scales.
Figure 4 shows the overview of the results of the 5-facet partial credit model analysis, plotting estimates of test-taker ability, test version difficulty, examiner harshness, delivery mode difficulty, and rating scale difficulty. They were all measured by the uniform unit (logits) shown on the left side of the map labeled “measr” (measure), making it possible to directly compare all the facets.
In Figure 4, the more able test-takers are placed towards the top and the less able towards the bottom. All the other facets are negatively scaled, placing the more difficult prompts, scoring categories and harsher examiners towards the top. The right-hand columns (flu, lex, gra and pro) refer to the bands of the four analytic IELTS rating scales. From the figure, we can visually judge that the difficulty levels of the two delivery modes (i.e. F2F and VC) seem to be comparable.

Figure 4: All facet vertical rulers (5-facet analysis with Partial Credit Model)
As shown in Tables 5-8 below, the FACETS program produces a measurement report for each facet in the model. The reports include the difficulty of items in each facet in terms of the Rasch logit scale (Measure) and Fair Averages, which indicate expected average raw score values transformed from the Rasch measures. It also shows the Infit Mean Square (Infit MnSq) index which is commonly used as a measure of fit in terms of meeting the assumptions of the Rasch model. Although the program provides two measures of fit (Infit and Outfit), only Infit is addressed here, as it is less susceptible to outliers in terms of a few random unexpected responses. Infit results outside the acceptable range are thus indicative of some underlying inconsistency in that facet.
Infit values in the range of 0.5 to 1.5 are ‘productive for measurement’ (Wright and Linacre, 1994:370), and the commonly acceptable range of Infit is from 0.7 to 1.3 (Bond and Fox, 2007). Infit values for all items included in the five facets fall within the acceptable range, except for Examiner G in the examiner facet (see Table 6). Examiner G is, however, overfitting rather than misfitting, indicating that his scores were too predictable. Overfit is not productive for measurement but it does not distort or degrade the measurement system. The lack of misfit gives us confidence in the results of the analyses and the Rasch measures derived on the common scale.
Of most importance for answering RQ1a are the results for the test delivery mode facet in Table 7. The table shows that the video-conferencing mode is slightly more difficult than the face-to-face modes (F2F: -.12, VC: .12). Although fixed (all same) chi-square shows that the mode of delivery significantly affects rating scores awarded (, ), the raw score difference is very small, with the fair average scores 5.20 (F2F) and 5.16 (VC).
Table 5: Test version measurement report
| Measure | Real S.E. | Observed Average | Fair (M) Average | Infit MnSq | |
|---|---|---|---|---|---|
| Website | -.53 | .15 | 5.30 | 5.28 | .89 |
| Travelling | -.11 | .12 | 5.24 | 5.20 | .82 |
| Success | -.01 | .12 | 5.00 | 5.18 | .83 |
| Teacher | .05 | .13 | 5.03 | 5.17 | .94 |
| Film | .15 | .13 | 5.08 | 5.15 | .99 |
| Event | .45 | .15 | 5.28 | 5.10 | .87 |
Fixed (all same) chi-square: 24.3, d.f.: 5, significance: .00
Table 6: Examiner measurement report
| Measure | Real S.E. | Observed Average | Fair (M) Average | Infit MnSq | |
|---|---|---|---|---|---|
| Examiner C | -1.11 | .17 | 5.16 | 5.39 | 1.02 |
| Examiner I | -1.01 | .19 | 5.14 | 5.37 | 1.12 |
| Examiner E | -.87 | .17 | 5.10 | 5.34 | .81 |
| Examiner F | -.40 | .18 | 5.38 | 5.25 | .76 |
| Examiner A | -.36 | .17 | 5.34 | 5.25 | 1.01 |
| Examiner B | .07 | .17 | 5.53 | 5.17 | .90 |
| Examiner J | .35 | .18 | 4.74 | 5.12 | .95 |
| Examiner D | .77 | .17 | 5.15 | 5.04 | .83 |
| Examiner H | .80 | .14 | 5.15 | 5.03 | .89 |
| Examiner G | 1.75 | .21 | 4.53 | 5.03 | .44 |
Fixed (all same) chi-square: 231.7, d.f.: 9, significance: .00 Inter-rater agreement opportunities: 744 Exact agreements: 418 = 56.2% Expected: 406.7 = 54.7%
Table 7: Test delivery mode measurement report
| Measure | Real S.E. | Observed Average | Fair (M) Average | Infit MnSq | |
|---|---|---|---|---|---|
| F2F | -.12 | .08 | 5.17 | 5.20 | .89 |
| VC | .12 | .08 | 5.12 | 5.16 | .89 |
Fixed (all same) chi-square: 4.8, d.f.: 1, significance: .03
Table 8: Rating scales measurement report
| Measure | Real S.E. | Observed Average | Fair (M) Average | Infit MnSq | |
|---|---|---|---|---|---|
| Pronunciation | -1.01 | .11 | 5.22 | 5.18 | .89 |
| Fluency | -.27 | .11 | 5.09 | 5.10 | .89 |
| Lexis | -.22 | .10 | 5.07 | 5.07 | .87 |
| Grammar | 1.50 | .11 | 5.20 | 5.22 | .91 |
Fixed (all same) chi-square: 270.4, d.f.: 3, significance: .00
Following the 5-facet analysis, two more MFRM analyses were carried out with four facets in the measurement model: test-takers, examiners, test version, and rating scale as facets. The reason for conducting the 4-facet analyses is to investigate the performance of each analytic rating scale in each mode as a separate “item” in the 4-facet analysis. The difference from the 5-facet analysis lies in the conceptualisation of the rating scales as items.
In the 5-facet analysis, only four rating scales were designated as items, enabling us to identify overall difficulty levels of the two delivery modes in relation to the four rating scale items, Fluency, Lexis, Grammar, and Pronunciation. In contrast, in the 4-facet analysis, delivery mode was not designated as a facet, and each of the analytic rating scales was treated as a separate item in each mode resulting in eight items (i.e. F2F Fluency, VC Fluency, F2F Lexis, VC Lexis, F2F Grammar, VC Grammar, F2F Pronunciation, VC pronunciation). For the 4-facet analyses, the rating scale model was used rather than the partial credit model, since each rating scale in both F2F and VC modes should be interpreted in the same way (while the partial credit model specifies that each item, in this case each IELTS rating scale, has its own rating scale structure; see http://www.rasch.org/rmt/rmt1231.htm for more information).
The results of the 4-facet analysis are visually presented in Figure 5 below, suggesting that there is no major difference in the difficulty levels across the eight rating scales.
The measurement report of each facet was assessed in the same manner as the above 5-facet analysis, and it was found that there was no misfitting item in any facet. The test version and examiner measurement reports are not included here in the interest of space, but the rating scale measurement report is presented in Table 9 below. The lack of misfit not only provides us with confidence in the accuracy of the analysis, but also has important implications for the construct measured by the two modes being unidimensional.
Table 9 also shows that the video-conferencing mode was consistently more difficult than the face-to-face mode in all four rating categories, echoing the results of the CTT analyses and the above 5-facet analysis.

Figure 5: All facet vertical rulers (4-facet analysis with Rating Scale Model)
Table 9: Rating scale measurement report (4-facet analysis)
| Measure | Real S.E. | Observed Average | Fair (M) Average | Infit MnSq | |
|---|---|---|---|---|---|
| F2F - Pronunciation | -.43 | .15 | 5.24 | 5.24 | .94 |
| F2F - Grammar | -.36 | .15 | 5.23 | 5.22 | .90 |
| VC - Pronunciation | -.22 | .15 | 5.19 | 5.19 | .84 |
| VC - Grammar | -.11 | .15 | 5.17 | 5.17 | .79 |
| F2F - Lexis | .15 | .15 | 5.11 | 5.12 | .82 |
| F2F - Fluency | .18 | .15 | 5.11 | 5.11 | .91 |
| VC - Fluency | .32 | .15 | 5.07 | 5.09 | .93 |
| VC - Lexis | .47 | .15 | 5.04 | 5.06 | 1.06 |
Fixed (all same) chi-square: 32.8, d.f.: 7, significance: .00
Finally, in order to examine whether or not any of the differences between the two delivery modes in each rating category are statistically significant, the same 4-facet analysis was repeated for each of the four analytic categories respectively. None of the analyses detected any misfitting items.
As shown in the chi-square tests in Tables 10-13 below, none of the score differences between the F2F and VC conditions was statistically significant (Fluency , ; Lexis , ; Grammar , ; Pronunciation , ).
Table 10: Fluency rating scale measurement report (4-facet analysis)
| Measure | Real S.E. | Observed Average | Fair (M) Average | Infit MnSq | |
|---|---|---|---|---|---|
| F2F - Fluency | -.11 | .17 | 5.11 | 5.10 | .76 |
| VC - Fluency | .11 | .17 | 5.07 | 5.08 | .76 |
Fixed (all same) chi-square: .8, d.f.: 1, significance: .38
Table 11: Lexis rating scale measurement report (4-facet analysis)
| Measure | Real S.E. | Observed Average | Fair (M) Average | Infit MnSq | |
|---|---|---|---|---|---|
| F2F - Lexis | -.20 | .16 | 5.11 | 5.08 | .70 |
| VC - Lexis | .20 | .16 | 5.04 | 5.03 | .83 |
Fixed (all same) chi-square: 3.1, d.f.: 1, significance: .08
Table 12: Grammar rating scale measurement report (4-facet analysis)
| Measure | Real S.E. | Observed Average | Fair (M) Average | Infit MnSq | |
|---|---|---|---|---|---|
| F2F - Grammar | -.20 | .20 | 5.23 | 5.21 | .86 |
| VC - Grammar | .20 | .20 | 5.17 | 5.15 | .78 |
Fixed (all same) chi-square: 2.1, d.f.: 1, significance: .15
Table 13: Pronunciation rating scale measurement report (4-facet analysis)
| Measure | Real S.E. | Observed Average | Fair (M) Average | Infit MnSq | |
|---|---|---|---|---|---|
| F2F - Pronunciation | -.14 | .18 | 5.24 | 5.29 | .84 |
| VC - Pronunciation | .14 | .18 | 5.19 | 5.24 | .73 |
Fixed (all same) chi-square: 1.2, d.f.: 1, significance: .28
5.1.3 Bias analysis
The impact of each examiner on test scores under the two delivery conditions was further examined using an extension of the MFRM analysis known as bias analysis. Bias analysis identifies unexpected but consistent patterns of behaviour which may occur due to an interaction between a particular examiner (or group of examiners) and other facets of the rating situation. In the field of speaking assessment research, the technique has been used to examine, for example, the impact of test-taker and rater gender on test scores (O’Loughlin, 2002). Bias analysis was therefore used in this study to investigate any interactions between the examiner and delivery mode facets.
As in Section 5.1.2, three sets of analyses were performed: 1) overall 5-facet analysis with a partial credit model; 2) 4-facet analysis on all rating categories with a rating scale model; and 3) 4-facet analysis on each of the four categories with a rating scale model.
Among all analyses, the second analysis identified 12 significant interactions (see Table 14) and the third analysis identified one significant pairwise interaction (see Table 15).
Table 14: Bias/interaction report (4-facet analysis on all rating categories)
| Rater | Scales | Obs-Exp Average | Bias size | Model S.E. | t | d.f. | Sig. | ||
|---|---|---|---|---|---|---|---|---|---|
| ID | Measr | Measr | Obs-Exp Average | Bias size | Model S.E. | t | d.f. | Sig. | |
| J | .35 | VC-Grammar | -.11 | -.33 | -1.49 | .46 | -3.23 | 20 | .004 |
| F | -.43 | VC-Fluency | .32 | -.34 | -1.47 | .52 | -2.82 | 16 | .012 |
| H | .76 | F2F-Pronunciation | -.43 | -.27 | -1.17 | .37 | -3.15 | 31 | .004 |
| C | -1.08 | F2F-Pronunciation | -.43 | -.27 | -1.17 | .49 | -2.40 | 17 | .028 |
| F | -.43 | F2F-Fluency | .18 | -.25 | -1.11 | .49 | -2.29 | 18 | .034 |
| H | .76 | VC-Pronunciation | -.22 | -.23 | -1.01 | .40 | -2.54 | 27 | .017 |
| D | .80 | VC-Lexis | .47 | -.23 | -.99 | .46 | -2.15 | 19 | .045 |
| H | .76 | VC-Grammar | -.11 | .19 | .84 | .41 | 2.08 | 27 | .047 |
| D | .80 | F2F-Pronunciation | -.43 | .22 | 1.04 | .47 | 2.24 | 20 | .037 |
| C | -1.08 | VC-Lexis | .47 | .25 | 1.10 | .45 | 2.47 | 21 | .022 |
| C | -1.08 | F2F-Lexis | .15 | .25 | 1.13 | .52 | 2.18 | 17 | .044 |
| D | .80 | VC-Pronunciation | -.22 | .33 | 1.59 | .49 | 3.26 | 19 | .004 |
Table 15: Bias/interaction pairwise report (4-facet analysis on pronunciation)
| Rater | Mode | Target Measr | S.E | Obs-Exp Average | Target Contrast | Joint S.E. | t | Welch d.f. | Sig. |
|---|---|---|---|---|---|---|---|---|---|
| C | F2F | .68 | .55 | -.15 | 1.58 | .75 | 2.11 | 37 | .042 |
| C | VC | -.90 | .51 | .14 | 1.58 | .75 | 2.11 | 37 | .042 |
Table 14 indicates seven negative biases and five positive biases shown by five examiners (Examiners C, D, F, H, J) on all four rating categories. Among the seven negative biases, three biases were against the face-to-face mode and four biases were against the video-conferencing mode. Of the five positive biases, two were for the face-to-face mode and three were for the video-conferencing mode. Table 15 indicates that Examiner C was more lenient when rating Pronunciation on the video-conferencing mode than on the face-to-face mode, compared to the rest of the examiners.
However, these biases did not indicate any particular trends (e.g. in terms of bias direction, examiner, rating category) and none of the bias sizes exceeded half a band, which could potentially affect test-takers’ band scores. It should also be noted that these biases were only identified based on the rating patterns of the 10 examiners who participated in this study and they, therefore, apply only to the particular examiner group of this study. As such, the bias analysis results presented above do not seem to indicate anything to be concerned about.
5.1.4. Summary of findings from score analyses
The main findings of the score analyses are summarised below.
a) Dataset
- The range of proficiency levels of the participants was lower and narrower than originally planned by the research team, with the majority of the test-takers clustering around Bands 5.0, 5.5 and 6.0.
b) CTT analysis with paired samples t-tests
- Two sets of analyses were carried out, one with scores awarded by live-test examiners, and the other with average scores of the scores given by live-test examiners and those by double-marking examiners.
- Analysis with live-test scores: The mean scores of all four rating categories and of two overall scores (mean and rounded) under the face-to-face condition were consistently very slightly higher than those under the video-conferencing condition. The differences in the Lexis category and two overall scores were statistically significant, but the actual score differences were very small.
- Analysis with average scores from live-test and double-marking examiners: While mean scores were still consistently higher in the face-to-face mode, none of the score differences were statistically significant.
- The results of these CTT analyses need to be interpreted with caution, as the results might be confounded by variables such as examiner severity and test version difficulty. However, it seems that double marking successfully reduces possible scoring errors related to examiner severity.
c) MFRM analysis with FACETS
- Three sets of analyses were carried out, one with five facets and two with four facets.
- 5-facet analysis (overall): There were no misfitting items in any facet. The video-conferencing mode was significantly more difficult than the face-to-face mode, but the raw score difference was very small, with the fair average scores 5.20 (F2F) and 5.16 (VC).
- 4-facet analysis (overall): There were no misfitting items in any facet. The video-conferencing mode was consistently more difficult than the face-to-face mode in all four rating categories, echoing the results of the CTT analyses and the 5-facet analysis.
- 4-facet analysis (each rating category): There were no misfitting items in any facet. None of the analyses showed a significant difference between the face-to-face and video-conferencing scores on each rating category.
- The three sets of MFRM analyses indicate that, although the video-conferencing mode tends to be slightly more difficult than the face-to-face mode, when the results of all analytic categories are combined, the actual score difference is negligibly small. When each rating scale is individually analysed, there is no significant effect for delivery mode on scores.
- Lack of misfit in these MFRM analyses is associated with unidimensionality (Bonk and Ockey, 2003) and by extension can be interpreted as both delivery modes in fact measuring the same construct.
5.2. Language functions
This section reports on the analysis of language functions elicited in the two delivery modes, in order to address RQ2 (Are there any differences in linguistic features, specifically types of language function, found under face-to-face and video-conferencing conditions?). Figures 6, 7 and 8 illustrate the percentage of test-takers who employed each language function under the face-to-face and video-conferencing delivered conditions across the three parts of the IELTS test. As in the Phase 1 study, the results indicated that more advanced language functions (e.g. speculating) were elicited as the interviews proceeded in both modes and that Part 3 elicited more interactive language functions than Parts 1 and 2, just as the IELTS Speaking test was designed to do; this is encouraging evidence for the comparability of the two modes.
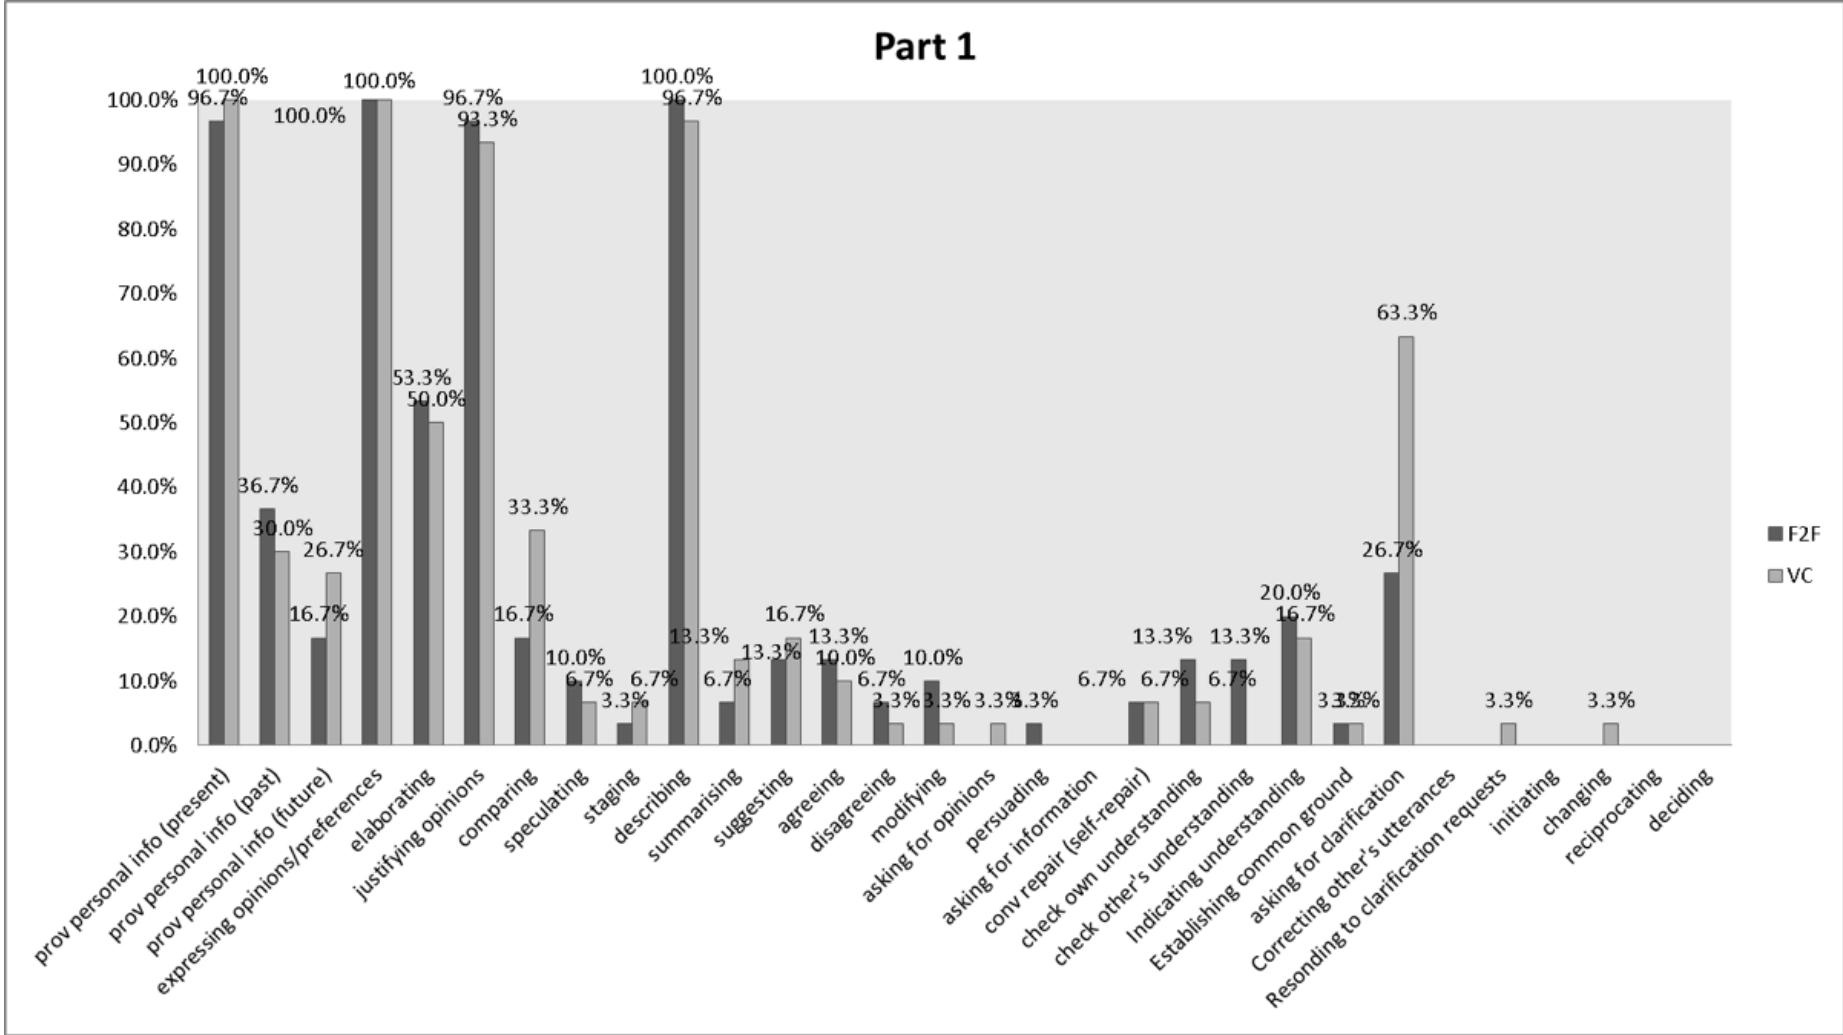
Figure 6: Language functions used in Part 1 by mode

Figure 7: Language functions used in Part 2 by mode

Figure 8: Language functions used in Part 3 by mode
For most of the functions, the percentages were very similar across the two modes. However, as shown in Table 16 below, there was one language function that test-takers used significantly differently under the two test modes: asking for clarification in Part 1 of the test (see Excerpt (1) for an example). While 26.7% of test-takers asked one or more questions to clarify what the examiner said in the face-to-face mode, 63.3% of them asked such questions in the video-conferencing mode. This is consistent with the Phase 1 study (Nakatsuhara et al., 2017), where a significant difference was found for asking for clarification in both Parts 1 and 3, as well as comparing and suggesting in Part 3. However, it is also worth noting that this difference emerged only in the first part of the test in the current research. There was no significant difference in Parts 2 and 3, indicating that the two delivery modes did not make a difference for individual long turns and the subsequent discussion.
Table 16: Language functions differently elicited in the two modes (N=30)
| [Part] Function | Test Mode | Count | Mean | SD | χ²(d.f.=1) | Sig.(2-tailed) |
|---|---|---|---|---|---|---|
| [Part 1]asking for clarification | Face-to-face | 8 | .267 | .450 | .210 | .013 |
| [Part 1]asking for clarification | Video-conferencing | 19 | .633 | .490 | .210 | .013 |
Excerpt (1) E: Examiner B, TT: S012, Video-conferencing
1 E: what kind of photos do you like (.) looking at? 2→ TT: .hhh I looking at (0.5) emmm (0.5) can you (.) can you speak? [Asking for clarification] 3 E: <what kind of photos (.) do you like looking at?>
It is also notable that the asking for clarification function observed in this study did not seem to be obviously caused by poor sound quality. Unlike the Phase 1 study, the sound quality was much improved in this study, and there were only limited numbers of sound-video synchronisation problems as shown in Section 5.3 below. This could suggest that the increased use of negotiation of meaning is still an attribute of the video-conferencing mode where the sound is transmitted via computer, even though it can be minimised to some extent with better technology. This may also be related to the reported difficulties in this mode for test-takers to supplement their understanding by the examiner’s subtle cues, such as gestures, which would normally be available under the face-to-face condition (Nakatsuhara et al., 2016).
While only 30 test-takers’ performances of the total 99 test-takers were selected for the function analysis of this study, given the careful selection of the 30 samples in terms of the level of proficiency and the range of examiner involvement (see Section 4.3.2), it is believed that this finding on asking for clarification would also represent the remaining data.
5.3. Sound quality analysis
This section reports on the analysis and findings on sound quality and its perceived and actual effects on test performance, to address RQ3 (To what extent did sound quality affect performance on the test: a) as perceived by test-takers, examiners and observers? b) as observed in test scores?).
As mentioned earlier, the following two questions were included in the test-taker feedback questionnaire, the examiner’s rating sheet and the observer’s observation sheet, and they were all asked to elaborate on their responses if they wished.
Q1. Do you think the quality of the sound in the VC test was… [1. Not clear at all, 2. Not always clear, 3. OK, 4. Clear, 5. Very clear] Q2. Do you think the quality of the sound in the VC test affected test-takers’ (or ‘your’ in the test-taker questionnaire) performance? [1. No, 2. Not much, 3. Somewhat, 4. Yes, 5. Very much]
Each test session generated four sets of responses by a) a test-taker, b) an examiner, c) an observer in the test-taker room, and d) an observer in the examiner room. Although their roles were different, test-takers and observers in the test-taker room experienced the same sound quality in the same room, and examiners and observers in the examiner room also experienced the same sound quality.
Table 17: Sound quality perception by test-takers (TT), examiners (E), observers in test-taker room (OTT) and observers in examiner room (OE)
| Perceived by | Median | Mean | SD | Friedman test | Post-hoc by Wilcoxon test* | |
|---|---|---|---|---|---|---|
| Q1. Sound quality [1. Not clear at all, 2. Not always clear, 3. OK, 4. Clear, 5. Very clear] | TT (N=99) | 4.00 | 3.72 | 1.06 | N=91, χ²=33.01, df=3, p<.001 | TT |
| Q1. Sound quality [1. Not clear at all, 2. Not always clear, 3. OK, 4. Clear, 5. Very clear] | E (N=99) | 5.00 | 4.36 | .94 | N=91, χ²=33.01, df=3, p<.001 | TT |
| Q1. Sound quality [1. Not clear at all, 2. Not always clear, 3. OK, 4. Clear, 5. Very clear] | OTT (N=98) | 5.00 | 4.50 | .78 | N=91, χ²=33.01, df=3, p<.001 | E=OTT (Z=-1.08, p=.282) E=OE (Z=-1.53, p=.127) OTT>OE (Z=-2.75, p=.006) |
| Q1. Sound quality [1. Not clear at all, 2. Not always clear, 3. OK, 4. Clear, 5. Very clear] | OE (N=92) | 4.00 | 4.21 | .87 | N=91, χ²=33.01, df=3, p<.001 | E=OTT (Z=-1.08, p=.282) E=OE (Z=-1.53, p=.127) OTT>OE (Z=-2.75, p=.006) |
| Q2. Affecting performance [1. No, 2. Not much, 3. Somewhat, 4. Yes, 5. Very much] | TT (N=99) | 3.00 | 2.52 | 1.16 | N=91, χ²=55.264, df=3, p<.001 | TT>E (Z=-5.60, p<.001) TT>OTT (Z=-5.96, p<.001) TT>OE (Z=-4.69, p<.001) E=OTT (Z=-3.00 p=.764) E |
| Q2. Affecting performance [1. No, 2. Not much, 3. Somewhat, 4. Yes, 5. Very much] | E (N=99) | 1.00 | 1.54 | .90 | N=91, χ²=55.264, df=3, p<.001 | E |
| Q2. Affecting performance [1. No, 2. Not much, 3. Somewhat, 4. Yes, 5. Very much] | OTT (N=98) | 1.00 | 1.54 | .66 | N=91, χ²=55.264, df=3, p<.001 | OTT |
| Q2. Affecting performance [1. No, 2. Not much, 3. Somewhat, 4. Yes, 5. Very much] | OE (N=92) | 2.00 | 1.78 | .82 | N=91, χ²=55.264, df=3, p<.001 | OTT |
* Note. Due to Bonferroni adjustment, the significance level for the post hoc tests is at 0.0083.
: Significantly larger than, < Significantly smaller than, =: No significant difference
Table 17 shows that the perception of sound quality and its effect on performance varied across the four groups of participants. Although the median values show that all groups felt that the sound quality was on average ‘Clear’ or ‘Very clear’, the examiners and observers seemed to perceive it as being better than the test-takers. Similarly, the effect of sound quality on performance was felt less by the examiners and the observers than by the test-takers. On average (judging by the median values), the test-takers felt that the degree of influence was ‘Somewhat’, while the examiners and observers’ responses were ‘No’ or ‘Not Much’. The Friedman tests and Wilcoxon post-hoc comparisons confirmed these differences in perception.
Next, the 99 test-takers were divided into three groups according to their overall video-conferencing test scores: Low (below Band 5; N=26), Middle (Between Band 5 and Band 6; N=61) and High (Band 6 and above; N=12). This was to see whether there were any differences in the perception of sound quality across the three proficiency groups.
Table 18 indicates that there was no difference across the three proficiency groups in terms of the sound quality perception by any of the four groups. However, when it came to the perception of the sound quality affecting performance, the observers in both test-taker and examiner rooms seemed to feel that sound quality affected low proficiency-level test-takers more than middle-level test-takers, although strictly speaking, a p-value of 0.023 in the result of observers in the test-taker room is not considered to be significant owing to the Bonferroni corrections made to the significance level of the multiple post-hoc comparisons (i.e. ) 3.
Table 18: Test-takers’ proficiency levels and sound quality perception by test-takers, examiners, observers in test-taker rooms and observers in examiner rooms
| Prof level | Median | Mean | SD | Kruskal Wallis Test | Post-hoc by Mann Whitney U test | |
|---|---|---|---|---|---|---|
| Q1: Sound quality [1. Not clear at all, 2. Not always clear, 3. OK, 4. Clear, 5. Very clear] | ||||||
| Test-takers | Low | 4.00 | 3.58 | 1.21 | χ²=1.17 | - |
| Test-takers | Middle | 4.00 | 3.72 | 1.00 | df=2 | - |
| Test-takers | High | 4.00 | 4.00 | 1.04 | p=.557 | - |
| Examiners | Low | 4.50 | 4.15 | 1.08 | χ²=1.67 | - |
| Examiners | Middle | 5.00 | 4.44 | .87 | df=2 | - |
| Examiners | High | 5.00 | 4.42 | 1.00 | p=.433 | - |
| Observers in Test-taker rooms | Low | 5.00 | 4.19 | 1.02 | χ²=3.54 | - |
| Observers in Test-taker rooms | Middle | 5.00 | 4.60 | .64 | df=2 | - |
| Observers in Test-taker rooms | High | 5.00 | 4.67 | .65 | p=.171 | - |
| Observers in Examiner rooms | Low | 4.00 | 4.08 | .76 | χ²=1.63 | - |
| Observers in Examiner rooms | Middle | 4.50 | 4.25 | .90 | df=2 | - |
| Observers in Examiner rooms | High | 5.00 | 4.27 | 1.01 | p=.442 | - |
| Q2: Affecting performance [1. No, 2. Not much, 3. Somewhat, 4. Yes, 5. Very much] | ||||||
| Test-takers | Low | 2.50 | 2.38 | 1.13 | χ²=.35 | - |
| Test-takers | Middle | 3.00 | 2.56 | 1.16 | df=2 | - |
| Test-takers | High | 2.50 | 2.58 | 1.31 | p=.840 | - |
| Examiners | Low | 1.00 | 1.50 | .81 | χ²=.04 | - |
| Examiners | Middle | 1.00 | 1.54 | .94 | df=2 | - |
| Examiners | High | 1.00 | 1.58 | .90 | p=.980 | - |
| Observers in Test-taker rooms | Low | 2.00 | 1.85 | .78 | χ²=6.35 | Low>Mid:U=564.00,W=2394.00,Z=-2.27,p=.023* |
| Observers in Test-taker rooms | Middle | 1.00 | 1.45 | .59 | df=2 | Low>Mid:U=564.00,W=2394.00,Z=-2.27,p=.023* |
| Observers in Test-taker rooms | High | 1.00 | 1.33 | .49 | p=.042 | Low>Mid:U=564.00,W=2394.00,Z=-2.27,p=.023* |
| Observers in Examiner rooms | Low | 2.00 | 2.20 | .96 | χ²=7.30 | Low>Mid:U=470.00,W=2066.00,Z=-2.52,p=0.012** |
| Observers in Examiner rooms | Middle | 1.50 | 1.64 | .72 | df=2 | Low>Mid:U=470.00,W=2066.00,Z=-2.52,p=0.012** |
| Observers in Examiner rooms | High | 1.00 | 1.55 | .69 | p=.026 | Low>Mid:U=470.00,W=2066.00,Z=-2.52,p=0.012** |
* Note: Low=High: U=100.00, W=178.00, Z=-1.918, p=.081; Mid=High: U=330.00, W=408.00, Z=-.531, p=.596 ** Note: Low=High: U=84.00, W=150.00, Z=-1.94, p=0.53; Mid=High: U=288.00, W=354.00, Z=-.374, p=.709
Finally, to understand the effect of sound quality better, we examined the relationship between the sound quality perception by the four groups and actual score differences between the face-to-face and video-conferencing delivery modes. Table 19 shows whether lower ratings in sound quality and higher rating in its influence on performance are related to actual score differences (i.e. F2F overall score minus VC overall score). Some of the results here need to be interpreted with caution, since the sample size of some response categories is very small.
Only the examiners’ perception of the sound quality suggested a significant overall difference in actual scores between the two delivery modes. However, post-hoc comparisons using the Mann Whitney U test indicates that none of the pairs showed a significant difference at the stringent significance level of 0.0125 after the Bonferroni correction is applied. Interestingly, when the examiners judged the sound quality ‘Not always clear’, test-takers tended to receive slightly higher ratings in the video-conferencing test than the face-to-face test than when the examiner judged ‘OK’ or ‘Clear’. Examiners, therefore, appear to have over-compensated for the poor sound quality they perceived. This result is congruent with McNamara and Lumley’s study (1997), which reported that raters tended to give higher scores to the test-takers who were interviewed by the interlocutors that they thought were less competent and built poor rapport with the test-taker.
Table 19: Perception of sound quality and its influence on performances and score differences between the two delivery modes
| Perceived by | Responses (N) | Score difference Median | Score difference Mean | Score difference SD | Kruskal Wallis Test | Post-hoc by Mann Whitney U test |
|---|---|---|---|---|---|---|
| Q1: Sound quality [1. Not clear at all, 2. Not always clear, 3. OK, 4. Clear, 5. Very clear] | ||||||
| Test-takers | 2 (N=16) | .000 | -.016 | .338 | χ²=1.851, df=3, p=.604 | - |
| Test-takers | 3 (N=25) | .000 | .090 | .281 | χ²=1.851, df=3, p=.604 | - |
| Test-takers | 4 (N=29) | .125 | .086 | .346 | χ²=1.851, df=3, p=.604 | - |
| Test-takers | 5 (N=29) | .000 | -.004 | .242 | χ²=1.851, df=3, p=.604 | - |
| Examiners | 2 (N=8) | -.188 | -.188 | .334 | χ²=8.130, df=3, p=.043 | Response 2<3:U=10.00, W=46.00,Z=-2.349, p=.019 * |
| Examiners | 3 (N=8) | .188 | .172 | .221 | χ²=8.130, df=3, p=.043 | Response 2<3:U=10.00, W=46.00,Z=-2.349, p=.019 * |
| Examiners | 4 (N=23) | .125 | .130 | .300 | χ²=8.130, df=3, p=.043 | Response 2<3:U=10.00, W=46.00,Z=-2.349, p=.019 * |
| Examiners | 5 (N=60) | .000 | .0250 | .290 | χ²=8.130, df=3, p=.043 | Response 2<3:U=10.00, W=46.00,Z=-2.349, p=.019 * |
| Observers in Test-taker rooms | 2 (N=2) | -.250 | -.250 | .884 | χ²=3.452, df=3, p=.327 | - |
| Observers in Test-taker rooms | 3 (N=11) | .125 | .205 | .318 | χ²=3.452, df=3, p=.327 | - |
| Observers in Test-taker rooms | 4 (N=21) | .125 | .101 | .325 | χ²=3.452, df=3, p=.327 | - |
| Observers in Test-taker rooms | 5 (N=64) | .000 | .006 | .261 | χ²=3.452, df=3, p=.327 | - |
| Observers in Examiner rooms | 2 (N=4) | .250 | .281 | .359 | χ²=2.283, df=3, p=.516 | - |
| Observers in Examiner rooms | 3 (N=15) | .000 | .008 | .319 | χ²=2.283, df=3, p=.516 | - |
| Observers in Examiner rooms | 4 (N=31) | .000 | .024 | .263 | χ²=2.283, df=3, p=.516 | - |
| Observers in Examiner rooms | 5 (N=42) | .125 | .042 | .312 | χ²=2.283, df=3, p=.516 | - |
| Q2: Affecting performance [1. No, 2. Not much, 3. Somewhat, 4. Yes, 5. Very much] | ||||||
| Test-takers | 1 (N=26) | .0625 | .0625 | .21866 | χ²=6.662, df=4, p=.115 | - |
| Test-takers | 2 (N=21) | .0000 | -.0298 | .23017 | χ²=6.662, df=4, p=.115 | - |
| Test-takers | 3 (N=30) | .1250 | .1333 | .37848 | χ²=6.662, df=4, p=.115 | - |
| Test-takers | 4 (N=19) | -.1250 | -.0592 | .26799 | χ²=6.662, df=4, p=.115 | - |
| Test-takers | 5 (N=3) | -.1250 | .1667 | .50518 | χ²=6.662, df=4, p=.115 | - |
| Examiners | 1 (N=66) | .0000 | .0492 | .27897 | χ²=2.300, df=4, p=.681 | - |
| Examiners | 2 (N=18) | .1250 | .0556 | .31571 | χ²=2.300, df=4, p=.681 | - |
| Examiners | 3 (N=12) | .0000 | .0313 | .42011 | χ²=2.300, df=4, p=.681 | - |
| Examiners | 4 (N=1) | .1250 | .1250 | - | χ²=2.300, df=4, p=.681 | - |
| Examiners | 5 (N=2) | -.1875 | -.1875 | .08839 | χ²=2.300, df=4, p=.681 | - |
| Observers in Test-taker rooms | 1 (N=54) | .0000 | .0231 | .27156 | χ²=2.015, df=2, p=.365 | - |
| Observers in Test-taker rooms | 2 (N=35) | .0000 | .0286 | .31373 | χ²=2.015, df=2, p=.365 | - |
| Observers in Test-taker rooms | 3 (N=9) | .1250 | .2222 | .39419 | χ²=2.015, df=2, p=.365 | - |
| Observers in Examiner rooms | 1 (N=41) | .0000 | .0030 | .27879 | χ²=3.980, df=3, p=.264 | - |
| Observers in Examiner rooms | 2 (N=32) | .0000 | .0664 | .29097 | χ²=3.980, df=3, p=.264 | - |
| Observers in Examiner rooms | 3 (N=17) | .1250 | .1397 | .28601 | χ²=3.980, df=3, p=.264 | - |
| Observers in Examiner rooms | 4 (N=2) | -.4375 | -.4375 | .61872 | χ²=3.980, df=3, p=.264 | - |
*Note: Response 2<4: U=41.50, W=77.50, Z=-2.30, p=.021; Response 2=5: U=155.50, W=191.50, Z=-1.626, p=.104; Response 3=4: U=84.50, W=360.50, Z=-.342, p=.732; Response 3=5: U=156.00, W=1986.00, Z=-1.617, p=.106; Response 4=5: U=544.50, W=2374.50, Z=-1.495, p=.135
To summarise the sound quality analysis, it seems that the video-conferencing technology generally functioned sufficiently well to enable the speaking test to be delivered in this mode. On average, the sound quality was perceived as ‘Clear’ or ‘Very clear’, although the examiners and observers perceived it more positively than the test-takers. Equally, the impact of sound quality on performance was perceived less by the examiners and observers (‘No’ or ‘Not much’) than the test-takers (‘Somewhat’). This is perhaps understandable, given that test-takers must consider the stakes of the test to be higher than examiners and observers.
Based on an expectation raised by the findings in the Phase 1 study, we were surprised that it was only the observers in both test-taker and examiner rooms who reported that sound quality seemed to affect lower proficiency-level test-takers more than middle-level test-takers. The lower proficiency test-takers themselves did not feel that they had poorer sound quality than middle or higher proficiency-level test-takers did. In other words, lower proficiency-level test-takers did not blame their limited performance on the poor quality of sound in the video-conferencing mode, as was the case in the Phase 1 study.
Regarding the relationship between sound quality perceptions and the actual score differences between the two modes of the test, only the examiners’ perceptions of the sound quality showed a significant relationship with actual score differences. It seems that when the examiners perceived the sound quality as ‘Not always clear’, they tended to award slightly higher scores to test-takers compared to when they thought the sound quality was ‘OK’ or ‘Clear’.
In general, therefore, the video-conferencing technology in this study seemed to function well and the sound quality was perceived positively. Nevertheless, the examiners’ comments also suggested that there were 18 cases where they encountered some major or minor technical/sound quality problems. Their comments, together with their ratings to Q1 and Q2, are presented in Table 20.
Table 20: Technical/sound quality problems reported by examiners
| Cand ID | Examiner | Q1 | Q2 | Comments |
|---|---|---|---|---|
| S20 | D | 5 | 2 | occasional millisecond freezes |
| S23 | D | 3 | 1 | audio had dips and rises in Part 1 |
| S40 | G | 2 | 5 | very long dropout and freeze 1 min added to time once the picture and sound resumed |
| S44 | H | 5 | 2 | computer shut down between end Part 1 and Part 2 |
| S57 | J | 2 | 5 | 5 min internet breakdown during test |
| S69 | H | 3 | 3 | 15 min internet breakdown - test-taker seemed unfazed |
| S74 | A | 3 | 2 | froze in Part 1 - sound cut out for only a second or two twice |
| S77 | A | 3 | 3 | a few audio glitches, esp. in the long turn |
| S78 | A | 3 | 3 | sounded as if she was underwater at times |
| S95 | G | 4 | 2 | ok - only a couple of glitches |
| S97 | D | 4 | 1 | occasional freezes, some words inaudible lots of gestures by test-taker affected how I heard the audio |
| S101 | D | 4 | 1 | a few glitches - nothing major |
| S102 | D | 4 | 1 | test-taker playing with table which affected sound throughout - esp. in Part 1 |
| S107 | F | 5 | 1 | micro-freezes of image |
| S114 | E | 2 | 4 | very distracting sound in Parts 1 and 3 affected the quality of her performance |
| S116 | J | 4 | 2 | slight skip - missed word |
| S117 | J | 2 | 3 | connection was slow - allowed extra time in Part 1 to compensate |
| S118 | J | 4 | 2 | couple of freezes - two sentences inaudible |
Even though the sound quality seems in general to have been adequate, these individual cases cannot be ignored if the video-conferencing test is to be operationalised as a comparable alternative delivery mode to the face-to-face mode.
5.4. Examiner and test-taker behaviour and training effects
We have looked at data relating to test-takers’ scores (RQ1), their output language in terms of language functions used (RQ2) and test-takers’ and examiners’ perception of sound quality and the possible effect this may have had on performances and scores awarded (RQ3). We now address RQ4 (How effective was the training for the video-conferencing test a) for examiners as administrators/interlocutors managing the action; b) for examiners as raters and c) for test-takers?) and RQ5 (What are the examiners and test-takers’ perceptions of the two delivery modes?). These questions will be discussed one by one, following analysis of five different sources of data: test-takers’ feedback questionnaire responses; examiners’ feedback on two questionnaires relating to training and to test administration and rating; observers’ notes; and examiners’ focus group discussions.
5.4.1. Test-taker perceptions of training materials and the two test modes
Table 21 presents the results of the test-taker feedback questionnaire, including their perceptions of the training materials and of the two delivery modes.
Table 21: Results of test-taker questionnaires (N=99)
| Question | Mean (SD) |
|---|---|
| Q1. Were the test-taker guidelines for the VC test … (1. Not useful - 3. OK - 5. Very useful) | 3.87 (0.99) |
| Q2. Were the pictures in the guidelines…(1. Not helpful - 3. OK - 5. Very helpful) | 3.65 (1.17) |
About each test mode (F2F=face-to-face, VC=video-conferencing)
| Question | Test mode | Median | Mean | SD | Wilcoxon Z (df=98) | Wilcoxon Sig. | Effect size (r) |
|---|---|---|---|---|---|---|---|
| Q3 + Q5: Did you understand the examiner? (1. Never - 3. Sometimes - 5. Always) | F2F | 4.00 | 4.18 | 0.86 | -4.327 | .000 | -0.308 |
| Q3 + Q5: Did you understand the examiner? (1. Never - 3. Sometimes - 5. Always) | VC | 4.00 | 3.76 | 1.02 | -4.327 | .000 | -0.308 |
| Q4 + Q6: Did you feel taking the test was… (1. V difficult - 3. OK - 5. V easy) | F2F | 3.00 | 3.39 | 0.83 | -2.241 | .025 | -0.159 |
| Q4 + Q6: Did you feel taking the test was… (1. V difficult - 3. OK - 5. V easy) | VC | 3.00 | 3.15 | 0.94 | -2.241 | .025 | -0.159 |
Comparison of the two test modes: frequency (%)
| Question | Face-to-face | Video-conferencing | No difference |
|---|---|---|---|
| Q5: Which speaking test made you more nervous - the face-to-face one, or the one using the computer? | 38(38.4%) | 34(34.3%) | 27(27.3%) |
| Q6: Which speaking test was more difficult for you - the face-to-face one, or the one using the computer? | 20(20.2%) | 40(40.4%) | 39(39.4%) |
| Q7: Which speaking test gave you more opportunity to speak English - the face-to-face one, or the one using the computer? | 57(57.6%) | 12(12.1%) | 30(30.3%) |
| Q8: Which speaking test did you prefer - the face-to-face one, or the one using the computer? | 71(71.7%) | 17(17.2%) | 10(10.1%) |
As noted earlier, following recommendations from the Phase 1 study, a trained IELTS examiner with a wealth of experience using video-conferencing for teaching, and who had also participated in the Phase 1 study as an examiner, led the development of the guidelines to help the test-takers understand the video-conferencing format of the test and prepare them for what they would have to deal with during the speaking interaction. The draft guidelines were then discussed within the research team, together with an IELTS examiner trainer, and were finalised after several modifications had been made. The guidelines were presented to the test-takers bilingually in English and Mandarin Chinese. As can be seen in test-takers’ responses to Questions 1 and 2 in Table 21, the test-taker guidelines were, in general, positively perceived, although there still seems to be some room for improvement.
There were, however, significant differences in test-takers’ ease of understanding the examiner (Q3), indicating that the video-conferencing mode tended to be perceived as more difficult. However, the mean difference is smaller than in the Phase 1 study and the effect size is much smaller (i.e. mean difference: Phase 1=1.00, Phase 2=0.42; effect size: Phase 1=0.512, Phase 2=0.308). In terms of test-takers’ perceptions of test difficulty (Q4), again there are significant differences in response to the two modes but the mean difference is again smaller and the effect size is much smaller in the current study than in the Phase 1 study (i.e. mean difference: Phase 1=0.71, Phase 2=0.24; effect size: Phase 1=0.381, Phase 2=0.159).
Responses to Questions 5-8 comparing the two modes were much more balanced in this study than in the Phase 1 study, with more test-takers responding positively to the video-conferencing mode. The specific training seemed to make some differences in the nervousness (Q5) and difficulty (Q6) they perceived during the video-conferencing test. In Phase 1, only 28.1% of the test-takers reported that they were more nervous in the face-to-face test, compared to 46.9% who reported being more nervous in the video-conferencing test, with 25.0% finding no difference in nervousness between the two modes. In contrast, in this study, slightly more test-takers expressed being more nervous in the face-to-face test (38.4%) than in the video-conferencing test (34.4%), with 27.3% reporting no difference between the two modes.
As for the perceived difficulty, while as many as 65.6% of the test-takers found the video-conferencing test more difficult than the face-to-face test in Phase 1, the percentage reduced to 40.4% in this study. Nevertheless, in line with virtually all other investigations into test-taker preferences between face-to-face and video-conferencing tests (see Clark and Hooshmand, 1992; Craig and Kim, 2010; Kim and Craig, 2012, as well as the results of Phase 1 of this study presented in Nakatsuhara et al., 2016, 2017), the majority of test-takers (almost 71.7%) still preferred the face-to-face mode, with only 10% of test-takers saying there were no differences between the two. There was, however, an 8% increase from the Phase 1 study in the percentage of test-takers who said they preferred the video-conferencing mode, which may be due to their familiarity to, and comfort in, talking via video-conferencing technology (see selected test-taker comments under (ii) below); most young people use video-conferencing for socialising in China and the majority of the participants in the study were students.
Selected test-taker comments are presented below, under three categories:
(i) comments in favour of the face-to-face mode (ii) comments in favour of the video-conferencing mode (iii) comments relatively neutral to both modes.
(i) Selected comments in favour of the face-to-face mode
S07: With VC, sometimes when the examiner and I spoke at the same time, I could not catch what the examiner said because of the sound effect. I was afraid not to be able to tell whether it was because of technical problems or myself causing the communication breakdowns. S10: Because face-to-face can let me feel more real, not just talking to the people in the computer. VC may be some kind of thing, like a robot. S12: I prefer face-to-face because it makes me feel closer to the interviewer and the sound is actually clearer. S40: I felt more nervous in F2F but I still preferred to have a real person sitting in front of me. S61: The F2F test was clearer and more comfortable. I felt more distance with the examiner in the VC test. In the VC test, it did not feel like a real conversation.
(ii) Selected comments in favour of the video-conferencing mode
S06: VC makes me less nervous and hopefully, I will be given a higher score. F2F makes me more nervous because I have to face a real man. S31: I felt nervous on F2F. I prefer VC because it is more comfortable. S63: In the VC test, I felt more comfortable. In the F2F test, the mode made me nervous and my brain went totally blank sometimes. S68: In the VC test, I felt less nervous. The computer screen made me more relaxed. S114: The VC test made me less nervous. During the VC test, I felt more relaxed.
(iii) Selected comments relatively neutral to both modes
S11: I think there was no difference between F2F and VC test. But VC test may be better because it is more convenient for the examiners. S28: The F2F is more familiar to me but the VC is ok as well. S89: Not so many differences. Mostly depends on one’s own English level. S94: A little bit more nervous in F2F. No differences except that. S96: The VC procedure was not as complicated as expected. Not many differences.
5.4.2. Examiner perceptions of training materials and training session
Also following recommendations from the Phase 1 study, training materials for examiners in the use of the video-conferencing mode were developed. A qualified IELTS examiner trainer, who had participated as an examiner in the Phase 1 study, led the development and conducted the training session in Shanghai. Training took place over a whole day, immediately prior to the first live test sessions and included explanations from the trainer, discussion amongst the participants, as well as practice in rating video sessions from the Phase 1 study. This was followed by peer practice with all examiners taking the different roles. Table 22 summarises the responses of the 10 examiners who participated in the one-day training session. These feedback responses were obtained immediately after the training session (i.e. before the live test administration).
Table 22: Effect of training materials on examiners’ preparation (N=10)
| Question | Min | Max | Mean (SD) | |
|---|---|---|---|---|
| Q1. | I found the training session useful. | 5 | 5 | 5.00 (0.00) |
| Q2. | The differences between the standard F2F test and the VC test were clearly explained. | 5 | 5 | 5.00 (0.00) |
| Q3. | What the VC room will look like was clearly explained. | 3 | 5 | 4.33 (0.71) |
| Q4. | VC specific techniques (e.g. use of preamble, back-channelling, gestures, how to interrupt) were thoroughly discussed. | 5 | 5 | 5.00 (0.00) |
| Q5. | The rating procedures in the VC test were thoroughly discussed. | 4 | 5 | 4.70 (0.48) |
| Q6. | The training videos that we watched together were helpful. | 4 | 5 | 4.70 (0.48) |
| Q7. | The peer practice sessions were useful. | 3 | 5 | 4.70 (0.67) |
| Q8. | I had enough opportunities to discuss all my concern(s)/question(s) about the VC test. | 5 | 5 | 5.00 (0.00) |
| Q9. | Having finished the training, I am confident in administering the VC test. | 4 | 5 | 4.80 (0.42) |
| Q10. | Having finished the training, I am confident in rating performance on the VC test. | 4 | 5 | 4.60 (0.52) |
Note: 1= strongly disagree, 2= disagree, 3= neutral, 4= agree, 5= strongly agree
As can be seen from Table 22, feedback from the examiners about the training session was extremely positive, with mean responses to all questions ‘agree’ to ‘strongly agree’. All examiners found that the training session was useful (Q1), that the differences between the two modes were clearly explained (Q2), that techniques specific to the video-conferencing test were thoroughly discussed (Q4), and that they had enough opportunities to discuss all their concerns and questions about the video-conferencing mode (Q8). However, some recommendations for improving the training session was also described in the free comment space of the questionnaire.
Examiner D: The only thing I would mention related to Q3 is that it would have been useful to see the actual rooms or a representation of them - e.g., so I could visualise where the computer would actually be, where the question booklet could be put, etc.
Examiner H: Sound quality impacts on confidence. Technical problems - laptop + program kept stalling/break down - might impact during the actual testing - once the laptop started working, the test went well. Overall the process was a very helpful dry run.
After the administration and rating of the video-conferencing tests, the 10 examiners were also asked (as a part of the examiner feedback questionnaire) to comment on the extent to which the examiner training had actually been useful during the live test sessions.
Table 23: Effect of training materials on administering and rating the tests (N=10)
| Question | Min | Max | Mean (SD) | |
|---|---|---|---|---|
| Q3. | Overall the examiner training adequately prepared me for administering the VC test. | 4 | 5 | 4.70 (0.48) |
| Q6. | The examiner training adequately prepared me for administering Part 1 of the VC test. | 4 | 5 | 4.90 (0.32) |
| Q9. | The examiner training adequately prepared me for administering Part 2 of the VC test. | 4 | 5 | 4.70 (0.48) |
| Q12. | The examiner training adequately prepared me for administering Part 3 of the VC test. | 3 | 5 | 4.70 (0.67) |
| Q15. | The examiner training gave me confidence in handling the interlocutor frame in the VC test. | 4 | 5 | 4.90 (0.32) |
| Q19 | Overall the examiner training adequately prepared me for rating test-taker performance in the VC test. | 2 | 5 | 4.30 (1.06) |
| Q22. | The examiner training adequately prepared me for applying Fluency and Coherence scale in the VC test. | 2 | 5 | 4.50 (0.97) |
| Q25. | The examiner training adequately prepared me for applying Lexical Resource scale in the VC test. | 2 | 5 | 4.40 (0.97) |
| Q28. | The examiner training adequately prepared me for applying Grammatical Range and Accuracy scale in the VC test. | 2 | 5 | 4.50 (0.97) |
| Q31. | The examiner training adequately prepared me for applying Pronunciation scale in the VC test. | 3 | 5 | 4.20 (0.92) |
| Q34. | The examiner training gave me confidence in the accuracy of my ratings on the VC test. | 2 | 5 | 4.10 (1.10) |
Note: 1= strongly disagree, 2= disagree, 3= neutral, 4= agree, 5= strongly agree
As can been seen from the mean scores in Table 23, the majority of the examiners found that the training had been very helpful and had indeed adequately prepared them for both administering and rating the test. However, responses from the examiners after the tests had been completed were slightly more mixed than their responses immediately after the training. As presented below, despite the full-day training that they all found very useful, some of them noted that it still took some time to get used to the video-conferencing test when it came to applying it during the live exams.
Examiner C: Some of the time I found myself using the F2F frame for Part 2 instructions when I was doing the VC. I corrected myself as I went along. The test-takers seemed to be less nervous in the VC, regardless of whether they went 1st or 2nd.
Examiner D: I forgot to start the stopwatch for Part 1 in the first two VC interviews - this was due to: - the layout of the intro frame + the beginning of Part 1; - no instructions on the materials; - my forgetting what we were told in the training.
Examiner E: The different bridge in Part 2 needs a bit more getting used to.
One of the examiners (Examiner F) even felt that the training had not adequately prepared him for rating the test (i.e. disagreeing to the statements in Q19-28, and Q34), which will further be described in the next section.
5.4.3. Examiner perceptions of the two test modes
The second part of the examiner feedback questionnaire after their test administration included questions related to their perceptions of the two test modes. Tables 24 and 25 concerning examiners’ perceptions of ease of administration and rating respectively, also reflect the responses in Table 23. While all mean scores but one (i.e. Ease of applying grammatical range and accuracy scale) indicate that the examiners tended to find the face-to-face test slightly easier to administer and rate, most of them reported that conducting all parts of the test and applying all rating categories to both face-to-face and video-conferencing modes was easy.
Table 24: Examiner perceptions concerning ease of administration (N=10)
| Test mode | Min | Max | Mean (SD) | |
|---|---|---|---|---|
| Comfortable in overall administration | Face-to-face | 5 | 5 | 5.00 (0.00) |
| Comfortable in overall administration | Video-conferencing | 4 | 5 | 4.30 (0.48) |
| Ease of administering Part 1 | Face-to-face | 4 | 5 | 4.90 (0.32) |
| Ease of administering Part 1 | Video-conferencing | 4 | 5 | 4.50 (0.53) |
| Ease of administering Part 2 | Face-to-face | 4 | 5 | 4.90 (0.32) |
| Ease of administering Part 2 | Video-conferencing | 4 | 5 | 4.50 (0.53) |
| Ease of administering Part 3 | Face-to-face | 4 | 5 | 4.90 (0.31) |
| Ease of administering Part 3 | Video-conferencing | 3 | 5 | 4.70 (0.67) |
| Ease of administering interlocutor frame | Face-to-face | 4 | 5 | 4.80 (0.42) |
| Ease of administering interlocutor frame | Video-conferencing | 4 | 5 | 4.70 (0.48) |
Note: 1= strongly disagree, 2= disagree, 3= neutral, 4= agree, 5= strongly agree
Table 25: Examiner perceptions concerning ease of rating (N=10)
| Test mode | Min | Max | Mean (SD) | |
|---|---|---|---|---|
| Comfortable overall in rating performance | Face-to-face | 3 | 5 | 4.50 (0.85) |
| Comfortable overall in rating performance | Video-conferencing | 2 | 5 | 4.20 (1.03) |
| Ease of applying Fluency and Coherence scale | Face-to-face | 4 | 5 | 4.70 (0.48) |
| Ease of applying Fluency and Coherence scale | Video-conferencing | 4 | 5 | 4.60 (0.51) |
| Ease of applying Lexical Resource scale | Face-to-face | 3 | 5 | 4.60 (0.70) |
| Ease of applying Lexical Resource scale | Video-conferencing | 3 | 5 | 4.50 (0.71) |
| Ease of applying Grammatical Range and Accuracy scale | Face-to-face | 2 | 5 | 4.50 (0.97) |
| Ease of applying Grammatical Range and Accuracy scale | Video-conferencing | 2 | 5 | 4.50 (0.97) |
| Ease of applying Pronunciation scale | Face-to-face | 3 | 5 | 4.60 (0.70) |
| Ease of applying Pronunciation scale | Video-conferencing | 3 | 5 | 4.10 (0.57) |
| Confidence in accuracy of rating | Face-to-face | 2 | 5 | 4.20 (1.14) |
| Confidence in accuracy of rating | Video-conferencing | 2 | 5 | 3.90 (1.00) |
Note: 1= strongly disagree, 2= disagree, 3= neutral, 4= agree, 5= strongly agree
What is somewhat surprising to see are some of the responses in Table 25. The same examiner, Examiner F, who expressed some negative evaluations to the extent to which training was helpful when actually rating the video-conferencing test (see Section b) reported that it was difficult to rate in both face-to-face and video-conferencing modes. Given that the examiner is highly trained and experienced in delivering the traditional face-to-face IELTS Speaking test, this may reflect more on the specific examiner’s self-efficacy and confidence level in general than on the mode of delivery.
The rating results of this examiner showed that his rating scores on both modes were adequately standardised (see Table 6 in Section 5.1.2). In addition, his lack of confidence in rating seemed to relate to the experimental nature of this research. Due to the complex counter-balanced design of this research, the examiners needed to change rooms after every test session (see Table 1 in Section 4.2.1), and some examiners seemed to find that this might have affected their rating. Examiner F, as well as Examiner A, pointed this out in the free comment space of the questionnaire.
Examiner F: I may have rated accurately, but I felt uncomfortable rating due to the rush nature of the room changes (I usually mull over ratings for a minute or two after test-takers have left the room). In practice training, perhaps we should have had rating practice (not just on video).
Examiner A: Any mis-rating is due to a combination of my rustiness coming back from holiday, a month of sleeplessness and the disruption of moving between rooms. I don’t feel that the VC impacted my ability to rate.
It should be highlighted that the change of examination rooms is only because of the design of this research which aimed to compare two delivery modes, and this is not an attribute of the video-conferencing test per se.
Table 26 shows a section of the examiner feedback questionnaire where they compared two delivery modes.
Table 26: Examiner perceptions concerning the two modes (N=10)
| Face-to-face | Video-conferencing | No difference | |
|---|---|---|---|
| Which mode of speaking test did you feel more comfortable with? | 8(80%)A, D, E, F, G, H, I, J | 2(20%)B, C | |
| Which mode of speaking test did you feel was easier for you to administer? | 7(70%)A, D, E, F, H, I, J | 1(10%)G | 2(20%)B, C |
| Which mode of speaking test did you feel was easier for you to rate? | 4(40%)E, F, H, J | 6(60%)A, B, C, D, G, I | |
| Which mode of speaking test do you think gave a better chance for the test-taker to demonstrate their level of English language proficiency? | 2(20%)G, I | 8(80%)A, B, C, D, E, F, H, J | |
| Which speaking test did you prefer? | 5(50%)D, E, G, I, J | 2(20%)A, B | 3(30%)C, F, H |
Note: 1= strongly disagree, 2= disagree, 3= neutral, 4= agree, 5= strongly agree
Unsurprisingly, given the experimental nature of the video-conferencing mode and the fact that all examiners are trained and experienced in delivering the face-to-face IELTS Speaking test, the majority felt more comfortable and, in general, found it easier to administer in face-to-face mode (80% and 70%, respectively). However, in terms of rating performances, 60% of the examiners thought there was no difference in rating in the two modes and an even larger majority (80%) thought that both modes gave test-takers equal opportunities to display their English language proficiency. Although half the examiners (50%) clearly preferred the face-to-face mode with which they were most familiar, the other half either preferred the video-conferencing mode or had no preference for either.
5.4.4. Analysis of observers’ field notes
The results from the observers’ notes are presented here according to the three broad strands: (i) examiners’ behaviour, (ii) test-takers’ behaviour and (iii) general comments and issues. In this section, some example comments are shown which lend support for the effectiveness of the examiner and test-taker training. However, it should be noted that the results of observers’ notes analysis are only suggestive and should be interpreted together with other sources of data; observers’ notes are subjective and may not be comprehensive; absence of reports on certain types of behaviour does not necessarily mean that they did not occur in the exam rooms.
(i) Examiner behaviour
Table 27 summarises the results of the thematic analysis of 297 observation notes, presenting an overview of the types and frequencies of examiner behaviour.
Table 27: Overview of observed examiners’ behaviour
| Part 1 | Part 2 | Part 3 | Total* | ||||||
|---|---|---|---|---|---|---|---|---|---|
| F2F | VC | F2F | VC | F2F | VC | F2F | VC | ||
| Linguistic | Asks for more responses | 0 | 1 | 10 | 12 | 6 | 7 | 16 | 20 |
| Linguistic | Responds to clarification requests | 14 | 20 | 3 | 0 | 15 | 20 | 32 | 40 |
| Linguistic | Deals with deviated responses | 1 | 3 | 0 | 2 | 4 | 12 | 5 | 17 |
| Linguistic | Different ways to speak btw modes | 3 | 6 | 1 | 2 | 2 | 6 | 6 | 14 |
| Linguistic | Stops / interrupts test-taker | 1 | 9 | 0 | 2 | 2 | 1 | 3 | 12 |
| Linguistic | Uses response tokens | 1 | 0 | 1 | 0 | 4 | 10 | 6 | 10 |
| Paralinguistic | Nods | 32 | 41 | 31 | 39 | 19 | 27 | 82 | 107 |
| Paralinguistic | Uses gestures | 16 | 17 | 12 | 18 | 31 | 33 | 59 | 68 |
| Paralinguistic | Smiles | 25 | 27 | 14 | 20 | 18 | 21 | 57 | 68 |
| Paralinguistic | Makes good eye contact | 16 | 17 | 6 | 16 | 9 | 6 | 31 | 39 |
| Paralinguistic | Uses facial expressions | 3 | 6 | 1 | 2 | 0 | 7 | 4 | 15 |
*Note: Total number of sessions that had notes in each category. The maximum is 297 (i.e. 3 parts x 99 pairs).
The training the examiners received included specific guidelines and suggestions for managing the tests in the video-conferencing mode, such as demonstrating active listening (using non-verbal techniques and back-channelling) and using gestures to clarify or emphasise some words in the questions. The most frequently noted examiner behaviour was nodding, followed by using gestures and smiling. These three types of behaviour were often part of what observers felt to be encouraging:
- Smiled and nodded a lot; Used hand gestures. (ID S081; VC Examiner, Part 1)
- Examiner nods occasionally showing encouragement. (ID S044; VC Examiner, Part 1)
Uses of other paralinguistic features such as good eye contact and facial expressions were also noted, as well as some use of response tokens, e.g. Examiner says “yeah” “yes” “um” for agreement (ID S047; VC Examiner, Part 3).
Also featured in the examiner training for the video-conferencing mode were some strategies to extend the long turn in Part 2 if necessary, and how they could interrupt test-takers effectively, both of which were found to be harder to do in the video-conferencing mode than face-to-face in the Phase 1 study (Nakatsuhara et al., 2016).
Related to these guidelines, some notes were coded under categories of asking for more response and stopping / interrupting test-taker:
- He also used extended questions, hand gestures and ‘why?’ and ‘how’ to elicit more answering. (ID S029, VC Examiner, Part 3)
- Expanded or paraphrased the question to elicit more in-depth answer from the test-taker. (ID S023, VC Examiner, Part 3)
- Interrupted the test-taker by moving to the next topic. (ID S039, VC Examiner, Part 1)
Moreover, some good techniques were observed and noted to deal with deviated responses, which was found more often than in the face-to-face mode:
-
The test-taker kept providing unrelated answer. The examiner had to raise his hand and did a stop sign to interrupt the test-taker. Examiner explained the question to the test-taker by providing an example. (ID S095, VC Examiner, Part 3)
-
Examiner repeats the question when the test-taker gets off the track. (ID S062, VC Examiner, Part 3)
-
Test-taker misheard the word ‘destination’ into ‘transportation’. Examiner did not say the test-taker was wrong, but used ‘yes, but…’ to guide her back to the topic. (ID S027, VC Examiner, Part 3)
It is also worth noting that in the video-conferencing mode, more notes were coded under responding to clarification requests than in the face-to-face mode. This is in line with the results of the function analysis (Section 5.2) where more test-takers were found to have asked for clarification in the video-conferencing mode. Related to this was that, in some cases, the observers found the examiners using different ways of speaking between two modes, where examiners spoke louder and/or slower under the video-conferencing condition.
(ii) Test-taker behaviour
The results of the thematic analysis on observers’ notes about test-taker behaviour are summarised in Table 28 below.
Table 28: Overview of observed test-takers’ behaviour
| Part 1 | Part 2 | Part 3 | Total* | ||||||
|---|---|---|---|---|---|---|---|---|---|
| F2F | VC | F2F | VC | F2F | VC | F2F | VC | ||
| Linguistic | Asks for clarification | 18 | 30 | 3 | 5 | 16 | 20 | 37 | 55 |
| Linguistic | Gives short responses | 3 | 3 | 14 | 12 | 4 | 4 | 21 | 19 |
| Linguistic | Checks own understanding | 1 | 7 | 0 | 1 | 2 | 6 | 3 | 14 |
| Paralinguistic | Makes good eye contact | 29 | 37 | 12 | 18 | 12 | 7 | 53 | 62 |
| Paralinguistic | Smiles | 28 | 28 | 11 | 14 | 16 | 16 | 55 | 58 |
| Paralinguistic | Uses gestures | 20 | 25 | 19 | 10 | 12 | 19 | 51 | 54 |
| Paralinguistic | Indicates problem | 10 | 9 | 1 | 3 | 8 | 6 | 19 | 18 |
| Paralinguistic | Seems nervous | 23 | 16 | 10 | 6 | 8 | 7 | 41 | 29 |
*Note: Total number of sessions that had notes in each category. The maximum is 297 (i.e. 3 parts x 99 pairs).
The briefing for the video-conferencing mode that the test-takers received prior to the exams specifically instructed them to: (a) keep looking at the examiner, (b) speak clearly into the microphone and (c) tell the examiner if you can’t hear what they are saying, and (d) be involved in the conversation (especially in Part 3). It seems that, in general, test-takers made good eye contact (corresponds with (a) and (d)), were able to ask for clarifications (corresponds with (c)), and indicate problems when they didn’t understand (e.g. by tilting his/her head; corresponds with (c)). They also smiled and used gestures which evidences involvement (therefore, contributes to (d)). It is also encouraging that the frequency of the observed behaviour in each category between the two modes (see Table 28) does not seem to differ greatly, apart from asking for clarification and checking own understanding.
Although not directly related to the effects of training on test-takers’ behaviours, some interesting trends can be found in Table 28 regarding the nervousness of the test-takers perceived by the observers. Judging from the total counts of the category of ‘Seems nervous’, more test-takers seemed nervous under the face-to-face condition. This is in line with the findings from the test-taker feedback questionnaire (see Q5 in Table 21 in Section a above: more nervous in the face-to-face test, more nervous in the video-conferencing test, no difference) and the focus group discussion (Section e below).
(iii) General observations
A few issues need to be addressed further in the examiner training (or interviewer frames) and test-taker briefing. It is suggested that no irrelevant hand movements should be made, as a simple act of squeezing the ID card or touching on paper would cause very loud, disturbing noises:
- A few secs’ distortion of Examiner’s voice due to Test-taker touching on paper. (ID S005, VC Examiner, Part 2)
- Very very loud noise during both Part 1 and 3. Later, we understood that it was because the test-taker was squeezing the test-taker ID paper. It was very surprising for all of us that such a simple action could cause big noise. (ID S114, VC, General comments)
It should also be noted that there were some cases where test-takers were confused by certain topics or questions, which could potentially be useful in informing the task design of the IELTS Speaking test. In Part 1, the word “area” appears to be problematic in one of the questions “What is the area like where you live?” Also, in Part 3, some test-takers were reported to have not understood the word “ceremony” and examiners had to explain using examples (such as wedding etc.).
Lastly, a couple of interesting points were made by the observers:
- The test-taker reported that she was more influenced by the topic than by the mode of interview. Several other test-takers also reported similar concerns. (ID S084, F2F, General comments)
- It seemed the interactiveness depends a lot on the test-taker. If the test-taker is interactive, the VC conversation will appear so as well. (ID S021, VC Examiner, Part 3)
As such, other factors such as the topic and test-takers’ attitudes have been reported to have influenced the performance, rather than the modes of delivery. This suggests that the training in the use of video-conferencing technology was effective, and that handling the exams through the video-conferencing mode was better harnessed in this phase of the project, and therefore, video-conferencing performance was less affected by the mode and was closer to the face-to-face performance.
5.4.5. Analysis of examiner focus group discussions
As mentioned in Section 4.2.5., all examiners took part in focus group discussions after completing their two days of examining in both face-to-face and video-conferencing modes, with the exception of Examiner I, who participated in a focus group discussion after the first day of examining. The purpose of the focus group discussions was to give the examiners an opportunity to elaborate on the responses they had given to the two questionnaires, in order to contribute to answers to Research Questions 4 and 5. Their responses are categorised in terms of examiner and test-taker behaviour including: (i) the use of gestures and body language; (ii) aspects of performance perceived as potentially different between two modes; and (iii) perceptions of the two modes, especially issues relating to stress and comfort levels in the two modes. In addition, they made several comments relating to: (iv) needs for specific examiner guidelines for the video-conferencing mode; and (v) general setup of the video-conferencing test.
Each of these themes will be discussed separately.
(i) Use of gestures and body language
Most of the examiners commented on both their own and the test-takers’ use of gestures and body language differently used in the two delivery modes. Echoing our findings in the Phase 1 research (Nakatsuhara et al., 2016), five of the ten examiners mentioned that it was more difficult to coax performances out of the test-takers in the video-conferencing mode. Their comments include:
Examiner D: If you need to encourage them it’s more difficult with a screen in the way. In the face-to-face you can encourage them with the body language or the facial expression…it’s more personable in the face-to-face.
Examiner H: First of all, face-to-face, male or female test-takers, in a face-to-face situation there’s slightly more preening, slightly more gesturing, flirtation, and the computer screen cuts that out. I know on the examiner level, when you’re using the interface, the computer as opposed to the person in the room, your gestures, well my gestures, were a lot less, I would be nodding a lot more and smiling in a fixed old smile, as we all know.
Examiner J: The video-conferencing makes it difficult to be subtle. I can do stuff with the inflections in my voice in face-to-face and I can use my body language in little ways, eyebrows you know and things. I don’t feel I can use my voice as forcibly or as subtly.
Examiner J also noted his subtle use of voice as well as gestures under the face-to-face mode, which would not work very well under the video-conferencing mode. This comment is also congruent with examiner comments in the Phase 1 study. Similarly, Examiner H commented on the difficulty of catching the subtleties from the test-takers in terms of body language and voice (pronunciation):
Examiner H: [Regarding pronunciation,] I did notice a couple of differences yesterday between video-conferencing and face-to-face because quite often, when we can’t fully hear the stress or the tone that the person is using, we often use other cues as well to kind of intensify the body language, and it kind of confirms what you’re hearing or what you’re not hearing, and if there’s a kind of absence or not. So in some ways, it’s a little trickier to listen to subtleties without the cues for those subtleties [in video-conferencing mode].
In contrast, the use of gestures (either of examiners or test-takers) was not perceived differently by three examiners:
Examiner A: Well I don’t gesture much anyway…I was told that you have to keep your non-verbal gestures to minimum years ago, so I sit rigid.
Examiner G: Not really, I don’t think they were gesturing more in face-to-face.
Examiner B: I don’t think I noticed any of that. But maybe it’s because I don’t pay attention to any of those keys.
While some examiners seemed concerned about the different use of gestures and voices as above, Examiner E interestingly noted that the lack of gesture in video-conferencing communication is an attribute of online communication among young people.
Examiner E: [Gestures] are picked up less on the video-conferencing I think than in face-to-face. It’s some kind of barrier, I’m sure with young people. I mean they are used to communicating with Skype and they have WeChat; I mean they’re used to communicating with each other like that.
Considering how widespread the video-conferencing mode of communication is today, the ways in which people use and understand body language and vocal cues may have become somewhat different from before. It may, therefore, be necessary to adjust the examiner training so as to better suit this mode of test delivery, in order to prepare examiners not to rely on and observe so much body language and vocal cues (but ensuring that the scores they arrive at will not differ, which has been consistently demonstrated through both phases of this study).
(ii) Aspects of performance perceived as potentially different between two modes
Two examiners commented on some aspects of test-taker performance that they felt might have received different scores between the two modes:
Examiner H: It was quite interesting…My test-takers performed better lexis-wise in the face-to-face but you could say that they performed better fluency-wise over the video-conferencing.
Examiner B: I remember it sort of went together with fluency and coherence usually…I didn’t find much variation in terms of lexical resource or grammar or, if I had any variation, it was usually in pronunciation together with fluency and coherence, which makes sense.
This examiner perception that test-takers might have performed somewhat differently in terms of different rating categories between the two modes was also observed in Phase 1 of the study. However, as was demonstrated in the score analyses (in both phases), the scores did not differ significantly, either overall or in each rating category.
A point that is worth noting here is the importance of emphasising not to give ‘a benefit of the doubt’ when rating under the video-conferencing condition. Examiner C suggested that because some minor delays were generally expected in video-conferencing communication, he was potentially more patient towards pauses before test-takers responded:
Examiner C: I didn’t find I was giving different ratings but I felt I was more nearer the higher end of the same band on the video-conferencing. But mostly just their confidence, they came across as a lot more confident. […]
I think because you are expecting a certain amount of delay so it’s not going to come across as a pause either. I suppose that makes them seem more fluent. You don’t know if it’s benefit of the doubt, or it’s just because you know there’s a delay [in video-conferencing mode]. And it’s acceptable, isn’t it, a delay when you speaking via video-conferencing.
Although the examiner training in this phase specifically stated that they should not give the benefit of the doubt, there were possibly some cases where they did, whether consciously or unconsciously, as Examiner C suggested. This problem can, of course, be minimised with the smooth transmission of the video and sound of the video-conferencing test, and, therefore, stable connections and local preparation and support are vital. However, one possible way to address such difficulty in assessing fluency under the video-conferencing condition is to focus more on intra-utterance fluency which is less likely to be affected by technology rather than focusing on pauses at the beginning of turns. The latter may be more accepted as an inherent feature of video-conferencing communication.
(iii) Perceptions of the two modes on the level of comfort and stress
Examiners commented both on their own perceptions of the two modes and their perceptions of test-takers’ reactions to the two modes, specifically in relation to how comfortable they felt in each.
We will first look at their perceptions of test-takers in the two modes. Six of the examiners explicitly reported a very high level of comfort and confidence that they perceived in the test-takers:
Examiner A: I was basically quite surprised how comfortable test-takers were in doing the video-conferencing. It seemed to me that they were actually more comfortable doing the video-conferencing than they were being interviewed face-to-face.
Examiner C: I mean with a couple of exceptions…for the most part, they seemed to be a lot more confident on video-conferencing. One of the test-takers who seemed a nervous wreck on the face-to-face seemed quite confident on the video-conferencing.
Examiner B: I think the stress levels go up in face-to-face. I’m thinking that perhaps it’s got something to do with young people nowadays spend eighty percent of their so-called communication go to their mobile phones…they don’t really see a person face-to-face. I don’t know but it’s powerful, I can feel it, I can feel the stress levels go up the moment I walk into the room.
Examiner H: Very young test-takers [around age 18] are more comfortable with video-conferencing than face-to-face, as they are just used to that interface of talking to something, as opposed to taking to someone. So less interaction, less demand on them. But it may sound contradictory but in a way video-conferencing acted a little bit as a filter on behaviour. So I would say about two-thirds seem to respond better face-to-face except very young test-takers who responded better to video-conferencing because they are used to that technology.
Examiner I: It seemed that the younger ones were more comfortable with the video-conferencing, possibly because they are more tech savvy. We certainly had two very uncomfortable…I’m not sure of their ages, they seemed a little bit more mature.
Examiner G: They didn’t seem to have a problem at all, they were quite happy with both, the digital generation.
As for the examiner perceptions of the two modes, despite five examiners expressing a preference for face-to-face in the questionnaire responses, only one examiner specifically commented on this in the focus group discussion.
Examiner G: I did find it hard to engage with the video-conferencing, I prefer the face-to-face.
However, there were a number of comments about their unfamiliarity with the modified script required for the video-conferencing mode.
Examiner E: So the materials were OK basically, I mean it’s just that we had to learn the little changes. I guess we have to get used to it. I guess if something is ingrained, as it is in our case, to change something, obviously you have to be more conscious.
Examiner J: I seemed to get quite used to doing the script changes and staging and everything. But I had a low level test-taker and when I asked her the questions just for the sound check, to get her used to my voice, she wanted to elaborate and got a bit confused so it wasn’t really settling, it was unsettling.
Examiner F: It just meant we paid more attention to the script, but they were fairly small changes.
Examiner A: The only other issue I had to deal with was the instructions because they were truncated from the original IELTS delivery, but I just go into automatic mode and it was throwing me that I couldn’t do the introduction “this is the IELTS Speaking Test”. I don’t know why.
Examiner C: I had to force myself to actually read it. And the ID card thing as well, kind of not having to do the ID check as well, it was a little shorter in the face-to-face.
Examiner H: The only thing I was a bit worried about was just the wording, just getting used to the wording.
These comments on their unfamiliarity with the modified wording in the video-conferencing script highlight that one-day training may not be sufficient and that the script needs to be practised until it gets fully internalised by the examiners.
(iv) Need for specific examiner guidelines in the video-conferencing test
A number of comments were made in relation to the need for more specific examiner guidelines. Firstly, some of the examiners were unsure about what to do while test-takers were preparing for Part 2:
Examiner C: In the prep time [in Part 2], I find that really awkward on the video-conferencing. Because their head goes down and you’re thinking that doesn’t look great. I’ve got to basically sit here and look at the screen. If I look anywhere else, it’s going to look totally unprofessional.
Examiner I: One of the test-takers said to me afterwards that she would have preferred if the examiner had looked down and made it look like he was taking notes, rather than staring at her or looking distracted around her. I mean, I think we were talking about maybe muting it for a period of time, but doing that, that [finger] movement side by side [on the screen to turn the sound off] puts them off.
Examiner A: I think there have got to be more guidelines about how to deal with, like Part 2 preparation, because just staring at the test-taker will freak things out.
Adding to this part of the focus group discussion, Examiner C commented that during the preparation time for Part 2, they would benefit from having something similar to the “news-reader technique” where news-readers on TV are told to shuffle papers around when they are on camera but not reading news. This could be included in the future examiner training.
Secondly, echoing the examiner comments obtained in Phase 1, three examiners in this study also mentioned they were not sure whether to look at the camera on the computer or the test-takers on screen, and that this was not specified in the examiner training given to them. If they look at test-takers on screen, their eyes will appear to be slightly looking down on the test-takers’ screen and their eyes will not meet.
Examiner C: [Eye movements are quite weird] because the camera’s a little bit above where you are actually looking. But I guess they are used to that, speaking on the phone and things. Still, maybe you expect somebody who is a professional to be looking directly at camera, rather than just below the camera.
Although looking into the camera on the computer would make it look as if the examiners are actually looking at the test-takers, it may make it more difficult for examiners to actually see how test-takers are responding.
Thirdly, four examiners commented on that the usefulness of having a window which showed themselves on the screen. Comments included:
Examiner A: I think [having a small window that shows yourself] probably does help a little bit to have a frame of reference.
Examiner G: I had it [the window that showed himself] there, just in the corner there and I knew where I was. I knew that I wasn’t actually really close to the camera. I could see that my face wasn’t forward. I knew that because I was sitting back. If I sat forwards like that then I would have been, but I wouldn’t have known that if I didn’t have that.
Based on the experience of Phase 1, where some examiners and test-takers were overly self-conscious and kept checking their own images in a window during the test, it was decided to make the self-image window disappear after both examiners and test-takers had checked themselves at the beginning of the test. However, this plan did not seem to be implemented consistently, with some of them not having a chance to check their image even at the start of the test.
In order to avoid examiners being too close to (or distant from) the camera, Examiner I suggested that it might be useful to have a guiding frame during the sound/screen check at the beginning of each test to indicate where their heads should be (like in a passport photo booth), perhaps both on examiners’ and test-takers’ screens. It is also important that once a decision is made, a systematic implementation should be put in place.
Fourthly, Examiner J made a comment about the difficulty of encouraging test-takers to produce more language in the video-conferencing mode using non-verbal cues, which relates to the comments on the use of body language earlier. This may have an important implication for modifying/tailoring the Interlocutor Frame for the video-conferencing mode; it may be worth considering allowing examiners to verbally facilitate more production especially in Part 2:
Examiner J: [under the current IELTS (face-to-face) Speaking Interlocutor Frame], we can’t go off script to do it. The video-conferencing makes it harder to be subtle and that’s my problem. I had a test-taker today, who stopped early in Part 2, she would have been a Band 6 for fluency but she stopped early. And I had no way of getting her to continue except the rounding off questions and, because she stopped so early, we got through the rounding off questions and we still hadn’t quite reached two minutes. When I did her in the face-to-face she did the same thing, I was able to get her to go more by pointing at one of the questions on the cue card.
The fifth area in need of more specific examiner guidelines is in case something goes wrong during the test. Depending on the timing and duration of the trouble, it may be useful to have a set of ‘trouble-shooting’ guidelines:
Examiner E: Just thinking about the what ifs, I kept thinking what if in Part 2 for example, we all had maybe an example on Saturday, it froze for half a minute - thank God it was at four minutes thirty, the last question just at the start of it. It wasn’t that overly important, but if that is going to happen, for example, halfway through Part 1, Part 2 what are the rules, what should one do; should one go back and start it all over again and hope for the best.
Additionally, examiners suggested that during the training, it would be beneficial to have practice sessions where they rate while they do the interview in the video-conferencing mode, as they did “not feel quite ready when the training finished” (Examiner F). In the training for this phase of the study, there were separate practice sessions on rating (using the video recordings from Phase 1) and administering the test (with a fellow examiner) under the video-conferencing mode, but not on both together. In addition, in the rating practice session, it would be beneficial to have a wider range of proficiency levels as Examiner J stated:
Examiner J: As you’ve seen just from these four or five days where one person had a test-taker that was Band 1, I had one that was a Band 2.5. There’s a wider range. So what we did in the training was that we saw a video of test-takers that were round about 4.5 to 7, which is a good range, and we practiced with each other. But I think it would be good if the trainees got to see a video of a very low test-taker possibly also a very high one as well, so that they can see what the examiner had to do - what pressures or what they had to do in those situations. And during the practice, if it’s possible for them to practice with somebody that’s not just of our native ability.
(v) General setup of the video-conferencing test
A few examiners shared the problems they encountered while conducting video-conferencing tests in terms of the equipment set-up and test administration. Specifically, they revealed the sources of constant noises that were very disturbing: test-takers’ body movements and their fiddling with the ID card near the microphone. The same issues were noted in the observers’ notes presented earlier (Section d). Examiner J explained his experience as below:
Examiner J: I had one test-taker who was doing the waving her head around all the time, and that was affecting the audio through to me. Another one right at the end, it was like listening to an ultrasound, she was playing with her piece of paper [with her test-taker number on] in nervousness, it was touching the microphone.
It should be noted that, in this study, small portable microphones with a clip and portable speakers had to be used, so as to enable researchers and observers to listen to the whole interaction under the video-conferencing condition. If headsets with a microphone are to be used (as was originally planned), this problem will be irrelevant. Still, it would be useful to consider small but important practical issues, such as where the test-taker ID card should be placed during the test (both face-to-face and video-conferencing), and how the pen and paper for note-taking will be placed in video-conferencing.
As such, it would seem that a number of comments made by the examiners in the focus group discussions could lead to specific changes being recommended for future training and administration of the video-conferencing tests. Together with enhanced training for the video-conferencing test, as the video-conferencing mode of the tests becomes more widespread and familiar to people, it is hoped that the administration will get easier, as Examiner F suggested below:
Examiner F: What’s interesting is when we did the initial peer-to-peer training, practicing in the training day, a lot of us were leaning in but now we’re no longer doing that. So it’s about familiarity. So the question is maybe it’s a matter of just getting familiar to it.
6. Conclusions and recommendations
6.1. Summary of main findings
This follow-up study, using a convergent parallel mixed methods design, has carried out further exploration and comparison of test-takers’ test scores and test-taker and examiner behaviour across two different delivery modes for the IELTS Speaking Test, i.e. the standard face-to-face and video-conferencing modes.
The findings for each of the research questions raised in Section 3 are summarised in Table 29.
Table 29: Summary of findings
| Research question | Findings |
|---|---|
| RQ1: Are there any differences in scores awarded between face-to-face and video-conferencing conditions? | CTT analysis of live test scores revealed minimal but significant differences in scores between the two modes for lexis and overall; no other score differences were significant. When the double-rating scores were also considered, no statistical differences were found between the two modes. MFRM analyses confirmed score differences were negligibly small; when rating scales were analysed individually, no significant effects were observed for delivery mode on scores. |
| RQ2: Are there any differences in linguistic features, specifically types of language function, found under face-to-face and video-conferencing conditions? | Asking for clarifications in Part 1 was used by more test-takers in the video-conferencing condition. No significant differences between delivery modes were observed for any of the other language functions. |
| RQ3a: To what extent did sound quality affect performance on the test as perceived by test-takers, examiners and observers? | In general, sound quality was perceived to be adequate for the purpose by test-takers and ‘clear’ or ‘very clear’ by observers and examiners. No differences in comments on sound quality were found between three different proficiency-level test-taker groups. |
| RQ3b: To what extent did sound quality affect performance on the test as found in test scores? | Examiners awarded higher scores on the video-conferencing mode to lower level test-takers if sound quality was perceived problematic; no other effects were found. |
| RQ4a: How effective was the training for the video-conferencing test for examiners as administrators/interlocutors managing the interaction? | All aspects of training as administrators/interlocutors for the video-conferencing test were rated as ‘very effective’. However, examiners expressed the need for more practice with the modified interlocutor frame and for some trouble-shooting guidance. |
| RQ4b: How effective was the training for the video-conferencing for examiners as raters? | All aspects of training as raters for the video-conferencing test were rated as ‘very effective’. |
| RQ4c: How effective was the training for the video-conferencing test for test-takers? | Training for test-takers was generally positively perceived. The level of nervousness and the perceived difficulty of the test seemed positively influenced by the training. |
| RQ5: What are the examiners’ and test-takers’ perceptions of the two delivery modes? | 72% of test-takers and 50% of examiners preferred the face-to-face mode. The face-to-face mode made test-takers slightly more nervous. 80% of examiners felt both modes allowed test-takers to demonstrate their English language ability. |
The results of this study comparing face-to-face and video-conferencing delivery modes of the IELTS Speaking Test suggest that, in common with the findings from the Phase 1 study, while the two modes are comparable in many respects, they also differ in some aspects. As such, it is recommended that before any decisions about deploying an online video-conferencing system for the IELTS Speaking test delivery are made, further analysis is carried out which (a) focuses on a range of important issues that have remained beyond the scope of this investigation (see recommendations for further research, below) and (b) seeks to confirm the findings in a large-scale investigation across a much wider geographical constituency.
6.2. Implications of the study and recommendations for future research
6.2.1. Additional training for examiners and test-takers
The analysis of observation notes has provided many pieces of evidence to suggest the usefulness of the examiner training for the video-conferencing test that was provided prior to the test administration of this study. Examiners demonstrated active listening using nodding and smiles. Body language such as hand gestures, eye contact and facial expressions was also effectively used to facilitate communication in the video-conferencing mode. Some good techniques to deal with digressing responses from test-takers, which was found to be more difficult under the video-conferencing condition, were also observed.
However, the recurrent theme that appeared in the examiner feedback questionnaire and the examiner focus group discussions was the difficulty of getting used to the video-conferencing test. While the one-day training was perceived as very useful, after the actual live test sessions, some of the examiners wished to have had more training and practice test sessions in order to be completely familiar with the modified Interlocutor Frame for the video-conferencing test. The wording that they normally use in the face-to-face test is memorised and automatised in their test administration practice. Some of the examiners found it difficult to pay additional attention to the revised Interlocutor Frame, when they were busy playing the dual role of interlocutor and rater under the live test condition. Based on comments from the focus groups, it would appear that the examiner training program should also cover how to deal with technical equipment and how to handle technical problems that may occur. Such additional training will enable the video-conferencing test to run more smoothly and standardise the video-conferencing test administration across examiners, as well as boosting the confidence level of examiners with this new mode of delivery.
While the results of the test-takers’ feedback, as well as the examiner focus group discussions, indicate that the test-taker cohort of this research was relatively computer-literate and did not seem to have any hesitation in approaching the video-conferencing technology, more training still seems necessary. The analysis of the observation notes identified that some test-takers’ movements, such as squeezing the ID card and touching paper, resulted in very loud, disturbing noises. Test-takers should, therefore, be given training on how to be more effective in communicating via video-conferencing technology. This may include how to project their voices, how to use body language and facial expressions to facilitate online communication, and the effect of extraneous noise on the quality of recording.
It could be helpful to offer a warm-up session for the test-takers, guided by someone with technical expertise, so that all participants become fully familiar with the technology and are not adversely affected by it during the test. Indeed, the use of such warm-up sessions has been suggested in the area of using video-conferencing in a distance learning environment (Lee, 2007). If necessary, this can also be included in the first part of the examiner training program.
6.2.2. Revisions to the Interlocutor Frame
As noted above, the differences in the Interlocutor Frame between the face-to-face and video-conferencing modes was a potential source of confusion for some examiners. While some differential wording is necessary to administer the video-conferencing test (e.g. use of a preamble to check sound quality, and instructions regarding the Part 2 prompt card), a more fundamental change in the Interlocutor Frame may also be necessary.
In the current IELTS Speaking Test, examiners are required not to deviate from the Interlocutor Frame in Part 1 (Introduction and Interview) and Part 2 (Individual long turn) of the test, although there is slightly more flexibility in Part 3 (Two-way discussion). Examiners are only allowed to clarify a word briefly and repeat (but not rephrase) the same prompt in Parts 1 and 2. The repetition of the same question is allowed only once in Part 1 of the test. The frame of Part 3 (Two-way discussion) is looser and examiners are allowed to rephrase questions and to accommodate their language to the level of the test-taker (Tonkyn and Wilson, 2004:200). However, it was noted by the researchers while analysing language function in both Phase 1 and Phase 2 of the project that such inflexibility in Parts 1 and 2 of the test created a number of very awkward communication breakdowns between the examiner and the test-taker and that most examiners were not enjoying much flexibility even in Part 3. The examiner trainer who conducted examiner training of this research also noted that the scripts provided in the Interlocutor Frame have been adhered more and more strictly over the years since its introduction in 2001.
The current Interlocutor Frame was, of course, originally developed for the traditional face-to-face speaking test. In addition to some necessary adjustments to the Interlocutor Frame required to administer the video-conferencing test, it seems essential to revisit the degree of flexibility embedded in the frame in order to embrace the construct measured under the video-conferencing condition. That is, as shown in the language function analysis of this study and of the Phase 1 study, many more test-takers asked clarification questions. As discussed in Section 5.2, given the enhanced sound quality of this study (see Section 5.3), such an increased use of clarification questions does not seem to be a result of poor sound quality. It is more likely to be an attribute of the video-conferencing mode where the sound is transmitted via computer. Although it can be minimised to some extent with better technology, it also seems to be associated with the reported difficulties in this mode for test-takers to supplement their understanding by the examiner’s subtle cues, such as gestures and voice inflection, which might be more available under the face-to-face condition. As such, it seems to make more sense to embrace negotiation of meaning aspects of test-taker language as part of the test construct delivered in this mode.
It may be, therefore, that the Interlocutor Frame will need to be revised to cater for the video-conferencing format, especially in allowing for paraphrasing of questions. O’Sullivan and Lu (2006) argued for exactly this when discussing the findings of their study into the effect of examiner deviation from the interlocutor frame on the language produced by test-takers:
The most relevant implication of the findings of this study is that it may be possible to allow for some flexibility in the Interlocutor Frame, though this flexibility might be best confined to allowing for examiner paraphrasing of questions. That this might be achieved without negatively impacting on the language of the candidate is of particular interest. (O’Sullivan and Lu, 2006:22)
Such a change in the Interlocutor Frame, leading to higher flexibility in examiner speech, would also allow examiners to provide scaffolding when necessary to help test-takers cope with communication breakdowns that occurred as a result of the technology supporting the video-conferencing mode. Furthermore, this would be helpful in retaining ‘interactiveness’ in the video-conferencing test. Brown (2007:138) offered a cautionary note on balancing standardisation and interactiveness, when the Interlocutor Frame was first introduced: ‘one way [to ensure fairness for test-takers] is to use more constrained and explicit tasks…but the danger here is the potential loss of communicativeness, or at least interactiveness’.
While the video-conferencing test may not offer the same level of subtlety as in face-to-face communication, its communicativeness and interactiveness seems to be operationalised in the form of more explicit negotiation of meaning. Brown’s comment on balancing standardisation and interactiveness again seems very relevant when discussing further changes in the Interlocutor Frame for offering an ‘interactive’ test using video-conferencing technology.
6.2.3. Scores and rating
The two modes generated essentially the same test score outcomes, regardless of which delivery mode the test was taken in, which is a very important consideration for everyone involved in interpreting the test results.
On the basis of the CTT and MFRM analyses, it can be suggested that, while the video-conferencing mode tends to be marginally more difficult than the face-to-face mode, the raw score difference is negligibly small and does not affect test-takers’ final band scores. Furthermore, some of the score differences seem to relate to examiners’ scoring errors. Live-test score comparisons using CTT analysis showed a significant difference in the Lexis category, but when average scores from two examiners (live and double-marking) were used for the same analysis, there was no significant difference. Similarly, the MFRM analysis, which can factor in examiner severity levels, did not show a significant difference for any of the individual analytic category comparisons between the two conditions. Although overall score comparisons in the live-test CTT analysis and 5-facet MFRM analysis indicated a significant difference, the actual score difference was very small and the result might relate to the effect of accumulating non-significant tendencies of the same direction.
These results suggest that while the face-to-face and video-conferencing test generate comparable scores in general, the comparability of the two modes would be strengthened when examiners’ scoring errors are minimised either by averaging scores from live and double-marking examiners or by controlling for examiner severity in MFRM analysis. In order to ensure that the scores given under the two delivery modes are comparable, it is therefore suggested that at least some tests could be randomly double-marked as a part of the normal test scoring system, in addition to those which are double-marked because of jagged profiles (as currently happens). This would help the test provider to be more confident in the comparability of scores awarded under the two test delivery modes. It would also enable the test provider to monitor the reliability of the IELTS Speaking Test as a part of its ongoing test validation, which is becoming increasingly important in terms of accountability to stakeholders (Nakatsuhara, Inoue and Taylor, 2017).
6.2.4. Comparability of language elicited
In terms of the language produced in the two modes, there was one difference in functional output in Part 1 of the test (i.e. asking for clarification) compared to three differences in Parts 1 and 3 in the Phase 1 study (i.e. asking for clarification, suggesting and comparing). The difference found in common in both phases is ‘asking for clarification’. As discussed above, given the improved sound quality in this research, the increased use of negotiation of meaning by asking for clarification seems to indicate a change of construct in communication under the video-conferencing mode. The skills to signal and solve communication breakdowns and to indicate their engagement and understanding in the communication (the latter is called ‘interactive listening’, Ducasse and Brown, 2009) seem to be key to successful communication in the video-conferencing mode.
Due to time and funding constraints, in both Phase 1 and Phase 2 only language functions produced by the test-takers were examined. Using the recordings collected in Phase 2, a separate, small-scale conversational analysis study was conducted with data from five pairs of test-takers taking the IELTS test in both face-to-face and video-conferencing modes (Cooke, 2015). The research concluded that, although some differences in output can be observed, essentially the equivalence validity of the two modes is upheld. However, in order to fully understand the nature of communication in the video-conferencing mode, it may be useful to carry out an additional conversational analysis study focusing only on the language elicited in the video-conferencing mode, and compare it with successful video-conferencing communication undertaken in distance-learning degree courses and oral examination situations (e.g. Ph.D. viva examinations via video-conferencing technology). This would help us to better understand the nature of communication in English for Academic Purposes in the era of digital technology, which may be something that IELTS will wish to assess in the future. Studies that go beyond a mere comparison between the face-to-face and video-conferencing modes of the current IELTS Speaking test would provide further insights into the construct that should be measured in the video-conferencing test.
6.2.5. Sound quality and technical problems
The effect of the technical issues which were encountered (even in this tightly-managed and carefully-planned study) should not be underestimated. Zoom is considered to be a much better, more stable computer-mediated communication software than other more commonly used programs, but some technical issues in sound quality and delayed video transmission, while far less intrusive than in the Phase 1 study, nevertheless were still evident, as reported by examiners, test-takers and observers. This is an issue which needs to be carefully considered and addressed in any future discussions and decisions about the use of any video-conferencing system.
Stable internet connections are required for clear sound quality and meticulous preparation at the local site are an absolute necessity for smooth administration of the video-conferencing delivered mode. Despite having taken great care in this respect, there were still technical problems and a number of small glitches in this phase of the research. Any further discussion of technical issues is beyond the scope of this study, but needs to be addressed as a matter of urgency before any further trialling takes place.
Since the completion of the second phase of this project, the possibility of developing an independent bespoke platform has been discussed and agreed by the IELTS Partners. It is thought that this will minimise as much as possible problems associated with sound quality and video transmission, as well as facilitating the administration of the video-conferencing test, for example, displaying the Part 2 prompt on the screen together with the examiner’s face in a small window at the same time. It is hoped that the use of the new platform will enable the test to be administered more smoothly and more consistently. Its usefulness and impact for delivering the video-conferencing test will be investigated in the next phase of this research, and will be reported in the Phase 3 report of this project.
References
- Abrams, Z. I. (2003). The effect of synchronous and asynchronous CMC on oral performance in German. The Modern Language Journal, 87(2), 157-167.
- Bachman, L. and Palmer, A. (1996). Language testing in practice. Oxford: Oxford University Press.
- Bernstein, J., Van Moere, A. and Cheng, J. (2010). Validating automated speaking tests. Language Testing, 27(3), 355-377.
- Bond, T. G. and Fox, C.M. (2007). Applying the Rasch model. Fundamental measurement in the human sciences (2nd edition). Marwah, NJ: Lawrence Erlbaum Associates.
- Bonk, W. J. and Ockey, G. J. (2003). A many-facet Rasch analysis of the second language group oral discussion task. Language Testing, 20(1), 89-110.
- Brown. A. (2007). An investigation of the rating process in the IELTS oral interview. In L. Taylor and P. Falvey (Eds.) IELTS collected papers: Research in speaking and writing assessment (pp.98-138). Cambridge: Cambridge University Press.
- Clark, J. L. D. (1988). Validation of a tape-mediated ACTFL/ILR-scale based test of Chinese speaking proficiency. Language Testing, 5(2), 197-205.
- Clark, J. L. D. and Hooshmand, D. (1992). ‘Screen-to-screen’ testing: An exploratory study of oral proficiency interviewing using video-conferencing. System, 20(3), 293-304.
- Cohen, J. (1988). Statistical power analysis for the behavioral sciences (2nd edition). Hillsdale, NJ: Lawrence Erlbaum Associates.
- Cooke, S. G. (2015). Configuring the game of speaking: Interactional competence in the IELTS Oral Proficiency Interview across two modes of response. Unpublished MA dissertation, Lancaster: Lancaster University.
- Craig, D. A. and Kim, J. (2010). Anxiety and performance in videoconferenced and face-to-face oral interviews. Multimedia-assisted Language Learning, 13(3), 9-32.
- Creswell, J. W. and Plano Clark, V. L. (2011). Designing and conducting mixed methods research (2nd edition). Thousand, Oaks, CA: Sage Publications.
- Davis, L., Timpe-Laughlin, V., Gu, L. and Ockey, G. (forthcoming). Face-to-face Speaking Assessment in the Digital Age: Interactive speaking Tasks Online. Papers from the Georgetown University Round Table 2016. Washington, DC: GURT.
- Field, J. (2011). Cognitive validity. In L. Taylor (Ed.), Examining speaking: Research and practice in assessing second language speaking (Studies in Language Testing, Vol. 30). (pp. 65-111). Cambridge: Cambridge University Press.
- Galaczi, E. D. (2010). Face-to-face and computer-based assessment of speaking: Challenges and opportunities. In L. Araújo (Ed.), Computer-based assessment of foreign language speaking skills (pp. 29-51). Luxemburg: European Union.
- Hoejke, B. and Linnell, K. (1994). Authenticity in language testing: Evaluating spoken language tests for international teaching assistants. TESOL Quarterly, 28(1), 103-126.
- Kenyon, D. and Malabonga, V. (2001). Comparing examinee attitudes toward computer-assisted and other proficiency assessments. Language Learning and Technology, 5(2), 60-83.
- Kiddle, T. and Kormos, J. (2011). The effect of mode of response on a semi-direct test of oral proficiency. Language Assessment Quarterly, 8(4), 342-360.
- Kim, J. and Craig, D. A. (2012). Validation of a videoconferenced speaking test. Computer Assisted Language Learning, 25(3), 257-275.
- Lee, L. (2007). Fostering second language oral communication through constructivist interaction in desktop videoconferencing. Foreign Language Annals, 40(4), 635-649.
- Linacre, M. (2013). Facets computer program for many-facet Rasch measurement, version 3.71.2. Beaverton, Oregon: Winsteps.com
- Luoma, S. (1997). Comparability of a tape-mediated and a face-to-face test of speaking: A triangulation study. Unpublished Licentiate thesis, University of Jyväskylä, Jyväskylä. Retrieved May 14, 2014 from http://urn.fi/URN:NBN:fi:jyu-1997698892.
- McNamara, T. and Lumley, T. (1997). The effect of interlocutor and assessment mode variables in overseas assessment of speaking skills in occupational settings. Language Testing, 14(2), 140-156. http://dx.doi.org/10.1177/026553229701400202
- McNamara, T. and Roever, C. (2006). Language testing: The social dimension. Malden, MA and Oxford: Blackwell.
- Nakatsuhara, F., Inoue, C., Berry, V. and Galaczi, E. (2016). Exploring performance across two delivery modes for the same L2 speaking test: Face-to-face and video-conferencing delivery - A preliminary comparison of test-taker and examiner behaviour. IELTS Partnership Research Papers 1. IELTS Partners: British Council, Cambridge English Language Assessment and IDP: IELTS Australia. Available online at: https://www.ielts.org/\~/media/research-reports/ielts-partnership-research-paper-1.ashx
- Nakatsuhara, F., Inoue, C., Berry, V. and Galaczi, E. (2017). Exploring the use of video-conferencing technology in the assessment of spoken language: a mixed-methods study. Language Assessment Quarterly, 14(1), 1-18. DOI: 10.1080/15434303.2016.1263637
- Nakatsuhara, F., Inoue, C. and Taylor, L. (2017). An investigation into double-marking methods: comparing live, audio and video rating of performance on the IELTS Speaking Test, IELTS Research Reports Online Series 1. IELTS Partners: British Council, Cambridge English Language Assessment and IDP: IELTS Australia. Available online at: www.ielts.org/-/media/research-reports/ielts-partnership-research-paper-2.ashx
- O’Loughlin, K. (2002). The impact of gender in oral proficiency testing, Language Testing, 91(2), 169-192.
- O’Sullivan, B. and Lu, Y. (2006). The impact on candidate language of examiner deviation from a set interlocutor frame in the IELTS Speaking Test. IELTS Research Reports, Volume 6. IELTS Australia and British Council, 91-117.
- O’Sullivan, B., Weir, C. J. and Saville, N. (2002). Using observation checklists to validate speaking-test tasks. Language Testing, 19(1), 33-56.
- Qian, D. (2009). Comparing direct and semi-direct modes for speaking assessment: Affective effects on test takers. Language Assessment Quarterly, 6(2), 113-125.
- QSR International. (2016). NVivo Version 11 [Computer software]. Retrieved from: http://www.qsrinternational.com/nvivo-product/nvivo11-for-windows.
- Shohamy, E. (1994). The validity of direct versus semi-direct oral tests. Language Testing, 11(2), 99-123.
- Smith, B. (2003). Computer-mediated negotiated interaction: An expanded model. The Modern Language Journal, 87(1), 25-38.
- Stansfield, C. (1990). An evaluation of simulated oral proficiency interviews as measures of oral proficiency. In J. E. Alatis (Ed.), Georgetown University Roundtable of Languages and Linguistics 1990 (pp. 228-234). Washington, D.C.: Georgetown University Press.
- Stansfield, C. and Kenyon, D. (1992). Research on the comparability of the Oral Proficiency Interview and the Simulated Oral Proficiency Interview. System, 20(3), 347-364.
- Van Moere, A. (2012). A psycholinguistic approach to oral language assessment. Language Testing, 29(3), 325-344.
- Weir, C. J., Vidakovic, I. and Galaczi, E. (2013). Measured constructs (Studies in Language Testing, Vol. 37). Cambridge: Cambridge University Press.
- Wright, B. and Linacre, M. (1994). Reasonable mean-square fit values. Retrieved 27 March 2012 from http://www.rasch.org.
- Yanguas, I. (2010). Oral computer-mediated interaction between L2 learners: It’s about time! Language Learning and Technology, 14(3), 72-93.
Appendix 1: Test-taker Feedback Questionnaire: Responses from 99 test-takers
Name: ____ ID No: ____
Gender: ____ Age: ____
Male : Female = 27 (27.3%):72 (72.7%)
Mean=19.35, SD=1.96,
Range=17.00 - 35.00
For all sections below, tick the relevant boxes below according to the test-taker’s responses.
BEFORE THE TEST - Test-taker guidelines for the Video-Conferencing (VC) test -
| 1. Not useful | 2. | 3. OK | 4. | 5. Very useful | Mean (SD) | |
|---|---|---|---|---|---|---|
| Q1. Were the test-taker guidelines for the VC test … | 3(3.0%) | 3(3.0%) | 28(28.3%) | 35(35.4%) | 30(30.3%) | 3.87(0.99) |
| 1. Not helpful | 2. | 3. OK | 4. | 5. Very helpful | Mean (SD) | |
|---|---|---|---|---|---|---|
| Q2. Were the pictures in the guidelines… | 7(7.1%) | 7(7.1%) | 28(28.3%) | 29(29.3%) | 28(28.3%) | 3.65(1.17) |
DURING THE TEST
| 1. Never | 2. | 3. Sometimes | 4. | 5. Always | Mean (SD) | |
|---|---|---|---|---|---|---|
| Q3. How often did you understand the examiner in the face-to-face test? | 0(0.0%) | 2(2.0%) | 23(23.2%) | 29(29.3%) | 45(45.5%) | 4.18(0.86) |
| 1. Very difficult | 2. | 3. OK | 4. | 5. Very easy | Mean (SD) | |
|---|---|---|---|---|---|---|
| Q4. Did you feel taking the test face-to-face was… | 3(3.0%) | 2(2.0%) | 58(58.6%) | 25(25.3%) | 11(11.1%) | 3.39(0.83) |
| 1. Never | 2. | 3. Sometimes | 4. | 5. Always | Mean (SD) | |
|---|---|---|---|---|---|---|
| Q5.* How often did you understand the examiner in the VC test? | 4(4.0%) | 5(5.1%) | 26(26.3%) | 39(39.4%) | 24(24.2%) | 3.76(1.02) |
| 1. Very difficult | 2. | 3. OK | 4. | 5. Very easy | Mean (SD) | |
|---|---|---|---|---|---|---|
| Q6. Did you feel taking the VC test was… | 4(4.0) | 18(18.2%) | 43(43.4%) | 27(27.3%) | 7(7.1%) | 3.15(0.94) |
| 1. Not clear at all | 2. Not always clear | 3. OK | 4. Clear | 5. Very clear | Mean (SD) | |
|---|---|---|---|---|---|---|
| Q7. Do you think the quality of the sound in the VC test was… | 0(0.0%) | 16(12.2%) | 25(25.3%) | 29(29.3%) | 29(29.3%) | 3.72(1.06) |
| 1. No | 2. Not much | 3. Somewhat | 4. Yes | 5. Very much | Mean (SD) | |
|---|---|---|---|---|---|---|
| Q8 Do you think the quality of the sound in the VC test affected your performance? | 26(26.3%) | 21(21.2%) | 30(30.3%) | 19(19.2%) | 3(3.0%) | 2.52(1.16) |
*Note: Q5 and Q12 had one missing response each.
BOTH TESTS
| F2F | VC | No difference | |
|---|---|---|---|
| Q9. Which speaking test made you more nervous - face-to-face or VC? | 38(38.4%) | 34(34.3%) | 27(27.3%) |
| Q10. Which speaking test was more difficult for you - face-to-face or VC? | 20(20.2%) | 40(40.4%) | 39(39.4%) |
| Q11. Which speaking test gave you more opportunity to speak English - face-to-face or VC? | 57(57.6%) | 12(12.1%) | 30(30.3%) |
| Q12.* Which speaking test did you prefer - face-to-face or VC? | 71(71.7%) | 17(17.2%) | 10(10.1%) |
*Note: Q5 and Q12 had one missing response each.
Why? Any additional comments?
S02: F2F makes me nervous, but the communication effect is better. We can improve the VC in terms of sound quality and the screen should be bigger. S03: In F2F, I can feel the examiner’s emotion. S04: F2F made me feel more sincere. S05: Topic isn’t clear e.g. The ceremony in your country. Maybe because of the cultural difference, such topic makes me flawed. S06: VC makes me less nervous and hopefully, I will be given a higher score. F2F makes me more nervous because I have to face a real man. S07: With VC, sometimes when the examiner and I spoke at the same time, I could not catch what the examiner said because of the sound effect. I was afraid not to be able to tell whether it was because of technical problems or myself causing the communication breakdowns. S08: Depends on the topic. Different topics in these two modes - that’s why I feel different. More nervous in F2F, feel better in VC. S09: Face-to-face is better. Feels more like real-life communicating. But in general, there was no difference. S10: Because face-to-face can let me feel more real, not just talking to the people in the computer. VC may be some kind of thing, like a robot. S11: When I took the VC test, I did not see my face on the screen, meaning there wasn’t a picture two as it says on the guideline. I think there was no difference between F2F and VC test. But VC test may be better because it is more convenient for the examiners. S12: I prefer face-to-face because it makes me feel closer to the interviewer and the sound is actually clearer. S15: Part 2, it would be better to provide a paper and pen before the start. S17: In the real VC test, would there be an observer to pass the paper and pencil during the test? S19: Part 1, I was interrupted by the examiner when I wanted to expand my answer. That may be avoided in F2F mode. The topic in F2F mode appeared more difficult than in VC mode. S21: I took IELTS before, so I didn’t find the VC guidelines helpful, i.e. I knew what the test is like quite well. I felt my performance in the live test was better than today, as I did lots of preparation for that live test. S24: Can have louder sound.
S26: The VC test had a lot of background noise. The F2F first felt more like communication. There was more interaction and body language. The VC felt unreal.
S28: The F2F is more familiar to me but the VC is ok as well.
S29: F2F more natural.
S30: It felt more comfortable in front of the real person.
S31: I felt nervous on F2F. I prefer VC because it is more comfortable.
S33: I think the examiner is very amiable. F2F suits me fine.
S34: The quality of the sound in the VC should be improved.
S35: The sound of the VC test can be made clearer.
S38: My picture did not show on the screen in warming-up. Sound quality of the VC was not quite good. Missed some key words. VC is more test-like which put me under pressure. I had no idea what I would look like on the screen to the examiner and I could not tell if the examiner understood me.
S40: I felt more nervous in F2F but I still preferred to have a real person sitting in front of me.
S41: With VC, a little breakdown in communication. A little bit delay when communicating.
S42: I found it queer talking in front of a PC screen. A real person may make me less uneasy.
S43: Attitudes of the examiner affect my performances. A smile may give me confidence and I can perform better.
S45: The sound quality in the VC room could be better.
S48: The examiner was very funny.
S50: If I have good communication skills, then it’s okay in both situations.
S51: The examiner talked faster in VC than in F2F.
S56: The sound quality was sometimes under expectation, but I could figure out what the examiner was saying anyway. I felt less nervous in the VC interview partly because I already saw the examiner in the F2F interview.
S58: I was less familiar to the topic (Part 2) in VC. Sometimes the sound quality was less satisfying. I felt less easy in the VC interview without talking to a “real person” in front of me.
S61: The F2F test was clearer and more comfortable. I felt more distance with the examiner in the VC test. In the VC test, it did not feel like a real conversation.
S62: Two minutes to prepare would be better.
S63: In the VC test, I felt more comfortable. In the F2F test, the mode made me nervous and my brain went totally blank sometimes.
S67: Maybe the order of taking the two modes of the test affected my performance.
S68: In the VC test, I felt less nervous. The computer screen made me more relaxed.
S70: During the VC test, I always felt I might miss what the examiner would say. I couldn’t tell the examiner’s facial expression during the VC test. I was afraid I wouldn’t respond properly.
S78: Technical problems in VC.
S81: I dared not to look straight at the screen in the VC interface because of my “machine-phobia”. Although there is a real person talking in the screen, I did not find it “real”. There were some delays in sound and picture transmission which affected my performance. The examiner would take the turn when I had nothing more to say, which happened less frequently in VC.
S83: I found the topic (Part 2) in the VC interview more difficult than in the F2F interview. I was kind of absent-minded in the VC one.
S85: F2F is more vivid.
S86: In the VC test, the sound stuck sometimes and the examiner kindly repeated.
S87: More nervous in F2F. Sound quality affected a little because once a word is missed, too difficult to catch.
S89: Not so many differences. Mostly depends on one’s own English level.
S90: Sometimes, there might be technical problems, like computer breakdowns.
S91: In the F2F test, I would communicate with the examiner better. Examiner’s voice in the VC test was not comfortable for me to hear. I don’t think I would be used to that.
S92: Bad sound quality pronunciation. Feeling bad to ask to repeat too many times.
S93: This is my first time to take the VC test. I am not familiar with it and I have taken the F2F IELTS several times, so I prefer the F2F test.
S94: A little bit more nervous in F2F. No differences except that.
S95: The F2F test made me feel more comfortable because I could hear the examiner more clearly. I could barely understand the examiner in the VC test.
S96: The VC procedure was not as complicated as expected. Not many differences.
S97: Since I took F2F test first, I feel VC was much easier.
S98: The noise might have influenced my performance sometimes.
S100: I felt less nervous in F2F. I didn’t like VC because I couldn’t see her image in the screen.
S101: With VC there was a delay of the examiner’s voice. So sometimes, I hesitated to talk.
S102: F2F was easier comparatively speaking as it was much more relaxing.
S103: F2F test was clearer when the examiner spoke faster.
S107: Enjoyed F2F. VC made me feel a little nervous.
S113: F2F test made me more relaxed than VC. The quality of the sound in the VC was not clear sometimes.
S114: The VC test made me less nervous. During the VC test, I felt more relaxed.
S115: Not so many differences at all.
S116: F2F made me less nervous and more comfortable. I felt I want to speak more in F2F, while in VC, I couldn’t hear clearly sometimes.
S117: There was a difference in the difficulty of the two topics.
S119: I think that the VC test may be better for me.
S120: I prefer F2F in Speaking test. I need to learn a communicative skill.
Thank you for answering these questions.
Appendix 2: Examiner Training Feedback Questionnaire: Responses from 10 examiners
Please circle your Examiner ID: A B C D E F G H I J
Tick the relevant boxes according to how far you agree or disagree with the statements below.
| 1. Strongly disagree | 2. Disagree | 3. Neutral | 4. Agree | 5. Strongly agree | Mean (SD) | |
|---|---|---|---|---|---|---|
| Q1. I found the training session useful. | 10(100%) | 5.00(0.00) | ||||
| Q2. The differences between the standard F2F test and the VC test were clearly explained. | 10(100%) | 5.00(0.00) | ||||
| Q3. What the VC room will look like was clearly explained. | 1(10%) | 4(40%) | 4(40%) | 4.33*(0.71) | ||
| Q4. VC specific techniques (e.g. use of preamble, back-channelling, gestures, how to interrupt) were thoroughly discussed. | 10(100%) | 5.00(0.00) | ||||
| Q5. The rating procedures in the VC test were thoroughly discussed. | 3(30%) | 7(70%) | 4.70(0.48) | |||
| Q6. The training videos that we watched together were helpful. | 3(30%) | 7(70%) | 4.70(0.48) | |||
| Q7. The peer practice sessions were useful. | 1(10%) | 1(10%) | 8(80%) | 4.70(0.67) | ||
| Q8. I had enough opportunities to discuss all my concern(s)/question(s) about the VC test. | 10(100%) | 5.00(0.00) | ||||
| Q9. Having finished the training, I am confident in administering the VC test. | 2(20%) | 8(80%) | 4.80(0.42) | |||
| Q10. Having finished the training, I am confident in rating performance on the VC test. | 4(40%) | 6(60%) | 4.60(0.52) |
*Note: Examiner B’s response to Q3 was missing
Additional comments? Do you have any suggestions to improve the training session?
Examiner C: Looking forward to doing the live research.
Examiner D: The only thing I would mention related to Q3 is that it would have been useful to see the actual rooms or a representation of them - e.g. so I could visualise where the computer would actually be, where the question booklet could be put, etc.
Examiner E: Very useful session. Peer practice was very useful though there were some technical problems (to be expected). I look forward to testing it out with ‘real’ test-takers.
Examiner H: Sound quality impacts on confidence. Technical problems - laptop + program kept stalling/break down - might impact during the actual testing - once the laptop started working, the test went well. Overall the process was a very helpful dry run.
Thank you very much. Your feedback will be very useful for improving the training session.
Appendix 3: Examiner Feedback Questionnaire: Responses from 10 examiners
Today you administered and rated a number of IELTS Speaking Tests according to two different delivery modes: one mode involved delivering the face-to-face (F2F) approach for the IELTS Speaking Test; an alternative mode involved administering and rating the IELTS Speaking Test using video-conferencing (VC) technology.
To help inform an evaluation of the alternative (VC) mode of test delivery and rating, and to compare this approach with the face-to-face mode, we’d welcome comments on your experience of administering and rating the IELTS Speaking Test across the two modes.
Background Data
NAME: ____
Years of experience as an EFL/ESL teacher? ____ years ____ months
Mean=14.58, SD=4.99, Range=6 years - 20 years
Years of experience as an IELTS examiner? ____ years ____ months
Mean=8.44, SD=3.52, Range=4 years 4 months - 15 years 6 months
- Administering the tests
| 1. Strongly disagree | 2. Disagree | 3. Neutral | 4. Agree | 5. Strongly agree | Mean (SD) | |
|---|---|---|---|---|---|---|
| Q1. Overall I felt comfortable in administering the IELTS Speaking Test in the F2F format | 10(100%) | 5.00 (0.00) | ||||
| Q2. Overall I felt comfortable in administering the IELTS Speaking Test in the VC format | 7(70%) | 3(30%) | 4.30 (0.48) | |||
| Q3. Overall the examiner training adequately prepared me for administering the VC test | 3(30%) | 7(70%) | 4.70 (0.48) | |||
| Q4. I found it straightforward to administer Part 1 (frames) of the IELTS Speaking Test in the F2F format | 1(10%) | 9(90%) | 4.90 (0.32) | |||
| Q5. I found it straightforward to administer Part 1 (frames) of the IELTS Speaking Test in the VC format | 5(50%) | 5(50%) | 4.50(0.53) | |||
| Q6. The examiner training adequately prepared me for administering Part 1 of the VC test | 1(10%) | 9(90%) | 4.90(0.32) | |||
| Q7. I found it straightforward to administer Part 2 (long turn) of the IELTS Speaking Test in the F2F format | 1(10%) | 9(90%) | 4.90(0.32) | |||
| Q8. I found it straightforward to administer Part 2 (long turn) of the IELTS Speaking Test in the VC format | 5(50%) | 5(50%) | 4.50(0.53) | |||
| Q9. The examiner training adequately prepared me for administering Part 2 of the VC test | 3(30%) | 7(70%) | 4.70(0.48) | |||
| Q10. I found it straightforward to administer Part 3 (2-way discussion) of the IELTS Speaking Test in the F2F format | 1(10%) | 9(90%) | 4.90(0.31) | |||
| Q11. I found it straightforward to administer Part 3 (2-way discussion) of the IELTS Speaking Test in the VC format | 1(10%) | 1(10%) | 8(80%) | 4.70(0.67) | ||
| Q12. The examiner training adequately prepared me for administering Part 3 of the VC test | 1(10%) | 1(10%) | 8(80%) | 4.70(0.67) | ||
| Q13. The examiner’s interlocutor frame was straightforward to handle and use in the F2F format | 2(20%) | 8(80%) | 4.80(0.42) | |||
| Q14. The examiner’s interlocutor frame was straightforward to handle and use in the VC format | 3(30%) | 7(70%) | 4.70(0.48) | |||
| Q15. The examiner training gave me confidence in handling the interlocutor frame in the VC test | 1(10%) | 9(90%) | 4.90(0.32) |
Q16. Additional comments?
Examiner A: If the interview goes to the full 5 minutes in Part 1, it is difficult to reach the minimum 4 minutes in Part 3 and keep to the 14 minutes, maximum length of the overall test.
Examiner C: Some of the time I found myself using the F2F frame for Part 2 instructions when I was doing the VC. I corrected myself as I went along. The test-takers seemed to be less nervous in the VC, regardless of whether they went 1st or 2nd.
Examiner D: Regarding Q2 + Q5: the same issue. I forgot to start the stopwatch for Part 1 in the first two VC interviews - this was due to: - the layout of the intro frame + the beginning of Part 1; - no instructions on the materials; - my forgetting what we were told in the training.
Examiner E: The different bridge in Part 2 needs a bit more getting used to.
Examiner G: Q1 Format slightly different so initially was awkward till I got used to it. Q4 &5. Numbering the Part 1 frames as 1 & 2 would be clearer.
Examiner H: The double ‘good morning’ was excessive, funny perhaps. Part 2 bridge was a bit awkward but can be got used to.
- Rating the tests
| 1. Strongly disagree | 2. Disagree | 3. Neutral | 4. Agree | 5. Strongly agree | Mean (SD) | |
|---|---|---|---|---|---|---|
| Q17. Overall I felt comfortable rating test-taker performance in the F2F IELTS Speaking Test | 2(20%) | 1(10%) | 7(70%) | 4.50(0.85) | ||
| Q18. Overall I felt comfortable rating test-taker performance in the VC-delivered IELTS Speaking Test | 1(10%) | 1(10%) | 3(30%) | 5(50%) | 4.20(1.03) | |
| Q19. Overall the examiner training adequately prepared me for rating test-taker performance in the VC test | 1(10%) | 1(10%) | 2(20%) | 6(60%) | 4.30(1.06) | |
| Q20. I found it straightforward to apply the Fluency and Coherence scale in the F2F format | 3(30%) | 7(70%) | 4.70(0.48) | |||
| Q21. I found it straightforward to apply the Fluency and Coherence scale in the VC-delivered format | 4(40%) | 6(60%) | 4.60(0.51) | |||
| Q22. The examiner training adequately prepared me for applying Fluency and Coherence scale in the VC test | 1(10%) | 2(20%) | 7(70%) | 4.50(0.97) | ||
| Q23. I found it straightforward to apply the Lexical Resource scale in the F2F format | 1(10%) | 2(20%) | 7(70%) | 4.60(0.70) | ||
| Q24. I found it straightforward to apply the Lexical Resource scale in the VC-delivered format | 1(10%) | 3(30%) | 6(60%) | 4.50(0.71) | ||
| Q25. The examiner training adequately prepared me for applying Lexical Resource scale in the VC test | 1(10%) | 3(30%) | 6(60%) | 4.40(0.97) | ||
| Q26. I found it straightforward to apply the Grammatical Range and Accuracy scale in the F2F format | 1(10%) | 2(20%) | 7(70%) | 4.50(0.97) | ||
| Q27. I found it straightforward to apply the Grammatical Range and Accuracy scale in the VC-delivered format | 1(10%) | 2(20%) | 7(70%) | 4.50(0.97) | ||
| Q28. The examiner training adequately prepared me for applying Grammatical Range and Accuracy scale in the VC test | 1(10%) | 2(20%) | 7(70%) | 4.50(0.97) | ||
| Q29. I found it straightforward to apply the Pronunciation scale in the F2F format | 1(10%) | 2(20%) | 7(70%) | 4.60(0.70) | ||
| Q30. I found it straightforward to apply the Pronunciation scale in the VC-delivered format | 1(10%) | 7(70%) | 2(20%) | 4.10(0.57) | ||
| Q31. The examiner training adequately prepared me for applying the Pronunciation scale in the VC test | 1(10%) | 5(50%) | 4(40%) | 4.20(0.92) | ||
| Q32. I feel confident about the accuracy of my ratings on the F2F format | 1(10%) | 2(20%) | 1(10%) | 6(60%) | 4.20(1.14) | |
| Q33. I feel confident about the accuracy of my ratings on the VC-delivered format | 1(10%) | 2(20%) | 4(40%) | 3(30%) | 3.90(1.00) | |
| Q34. The examiner training gave me confidence in the accuracy of my ratings on the VC test | 1(10%) | 2(20%) | 2(20%) | 5(50%) | 4.10(1.10) |
Q35. Additional comments? Examiner A: Any mis-rating is due to a combination of my rustiness coming back from holiday, a month of sleeplessness and the disruption of moving between rooms. I don’t feel that the VC impacted my ability to rate.
Examiner E: Felt slightly more comfortable rating in the ‘old’ F2F format.
Examiner F: I may have rated accurately, but I felt uncomfortable rating due to the rush nature of the room changes (I usually mull over ratings for a minute or two after test-takers have left the room). In practice training, perhaps we should have had rating practice (not just on video).
[Note: Examiner F gave consistently lower ratings in this section (ranging from 2 to 4)]
Examiner G: Q17. Being observed in every test: I was very aware of it and it made me a bit nervous. Q 20 - 31: I had no sound problems so this was not an issue.
- Comparing the experience of using the F2F and the VC modes for the IELTS Speaking Test
| F2F | VC | No difference | |
|---|---|---|---|
| Q36. Which mode of speaking test did you feel more comfortable with? | 8(80%)A, D, E, F, G, H, I, J | 2(20%)B, C | |
| Q37. Which mode of speaking test did you feel was easier for you to administer? | 7(70%)A, D, E, F, H, I, J | 1(10%)G | 2(20%)B, C |
| Q38. Which mode of speaking test did you feel was easier for you to rate? | 4(40%)E, F, H, J | 6(60%)A, B, C, D, G, I | |
| Q39. Which mode of speaking test do you think gave a better chance for the test-taker to demonstrate their level of English proficiency? | 2(20%)G, I | 8(80%)A, B, C, D, E, F, H, J | |
| Q40. Which speaking test did you prefer? | 5(50%)D, E, G, I, J | 2(20%)A, B | 3(30%)C, F, H |
Q41. Are you aware of doing anything differently in your examiner role across the 2 speaking test modes - F2F and VC? If yes, please give details… Examiner A: I felt VC made the test-takers seem more confident and in some cases more engaged. The main difference is the issue of timing on Part 3 (see Section 1). Also, the Part 2 preparation time seems more awkward on VC as I felt I couldn’t gaze away from the screen. Examiner B: Not to my knowledge. Examiner C: The fact that there was no introduction for file/record purposes threw me a bit. There did seem some logistical problems but good quality equipment meant that there were few problems with time. Examiner D: My choice of F2F for Q36 & Q37 relates to my familiarity with doing it, and using the scripting being so automatic to me. Regarding Q40 (F2F), I feel there is more scope for examiner subtlety - if a test-taker gets emotional or is struggling to understand the questions repeatedly. Doing anything differently: I use more inflexions in my voice and more intonation effectively in F2F. With VC, I’m nervous about doing it ineffectively and distressing/confusing the test-taker. The same issue is true with regard to body language → I can use body language more with lower level test-takers during instructions (e.g. Part 2) to make things clearer. (You’ll see this in my interviews during Part 3 script when I say ‘general questions’. I use body language to emphasize the generalness.) Examiner E: Delivery - I found that I was leaning forward more in the VC and felt the need to speak louder. I still felt more comfortable using F2F, both from delivery and rating points. Felt more control using F2F mode. Examiner F: Q36 - 39 more comfortable with F2F only because I am more familiar with F2F. Video will reveal all - I’m sure I did! Examiner G: I felt more comfortable doing F2F and so may have conducted a test where the test-taker was more comfortable. Examiner H: VC - gestures more controlled; louder voice (me); attention was more divided, i.e. watch up 3/screen/test-taker/trainer. I noticed the test-taker’s behaviour changed significantly. Examiner J: I felt it was easier to rate F2F tests, but the difference was minimal only in terms of pronunciation.
Thank you for answering these questions.
Author biodata
Fumiyo Nakatsuhara
Dr Fumiyo Nakatsuhara is a Reader at the Centre for Research in English Language Learning and Assessment (CRELLA), University of Bedfordshire. Her research interests include the nature of co-constructed interaction in various speaking test formats (e.g. interview, paired and group formats), task design and rating scale development. Fumiyo’s publications include the book, The Co-construction of Conversation in Group Oral Tests (2013, Peter Lang), book chapters in Language Testing: Theories and Practices (O’Sullivan, ed. 2011) and IELTS Collected Papers 2: Research in Reading and Listening Assessment (Taylor and Weir, eds. 2012), as well as journal articles in Language Testing (2011; 2014) and Language Assessment Quarterly (2017). She has carried out a number of international testing projects, working with ministries, universities and examination boards..
Chihiro Inoue
Dr Chihiro Inoue is a Senior Lecturer at the Centre for Research in English Language Learning and Assessment (CRELLA), University of Bedfordshire. Her main research interests lie in task design, rating scale development, the criterial features of learner language in productive skills and the variables to measure such features. She has carried out a number of test development and validation projects in English and Japanese in the UK, USA and Japan. Her publications include the book, Task Equivalence in Speaking Tests (2013, Peter Lang) and articles in Language Assessment Quarterly (2017), Assessing Writing (2015) and Language Learning Journal (2016). In addition to teaching and supervising in the field of language testing at UK universities, Chihiro has wide experience in teaching EFL and ESP at the high school, college and university levels in Japan.
Vivien Berry
Dr Vivien Berry is Senior Researcher, English Language Assessment at the British Council where she leads an assessment literacy project to promote understanding of basic issues in language assessment, including the development of a series of video animations, with accompanying text-based materials. Before joining the British Council, Vivien completed a major study for the UK General Medical Council to identify appropriate IELTS score levels for International Medical Graduate applicants to the GMC register. She has published extensively on many aspects of oral language assessment including a book, Personality Differences and Oral Test Performance (2007, Peter Lang) and regularly presents research findings at international conferences. Vivien has also worked as an educator and educational measurement/assessment specialist in Europe, Asia and the Middle East.
Evelina Galaczi
Dr Evelina Galaczi is Head of Research Strategy at Cambridge English. She has worked in language education for over 25 years as a teacher, teacher trainer, materials writer, program administrator, researcher and assessment specialist. Her current work focuses on speaking assessment, the role of digital technologies in assessment and learning, and on professional development for teachers. Evelina regularly presents at international conferences and has published papers on speaking assessment, computer-based testing, and paired speaking tests.
Footnotes
-
Zoom is an online video-conferencing program (http://www.zoom.us), which offers high definition video-conferencing and desktop sharing. ↩
-
In this report (as well as in our previous report on Phase 1 of the project), ‘live tests’ refer to experimental IELTS Speaking Tests that are performed by volunteer test-takers with trained and certified IELTS examiners. ↩
-
An additional analysis using overall face-to-face test scores (High: N=28, Middle: N=56, Low: N=15) was carried out, by repeating the same procedure. The findings suggest that none of the differences across the three groups was significant. ↩