
Exploring difficulty in Speaking tasks: an intra-task perspective
Official IELTS research report on IELTS Test - Speaking, published in 2006.
Abstract
The oral presentation task has become an established format in high stakes oral testing as examining boards have come to routinely employ them in spoken language tests. This study explores how the difficulty of the Part 2 task (Individual Long Turn) in the IELTS Speaking Test can be manipulated using a framework based on the work of Skehan (1998), while working within the socio-cognitive perspective of test validation. The identification of a set of four equivalent tasks was undertaken in three phases. One of these tasks was left unaltered; the other three were manipulated along three variables: planning time, response time and scaffolded support. In the final phase of the study, 74 language students, at a range of ability levels, performed all four versions of the tasks and completed a brief cognitive processing questionnaire after each performance. The resulting audio files were then rated by two IELTS trained examiners working independently of each other using the current IELTS Speaking criteria. The questionnaire data were analysed in order to establish any differences in cognitive processing when performing the different task versions.
Results from the score data suggest that while the original un-manipulated version tends to result in the highest scores, there are significant differences to be found in the responses of three ability groups to the four tasks, indicating that task difficulty may well be affected differently for test candidates of different ability. These differences were reflected in the findings from the questionnaire analysis. The implications of these findings for teachers, test developers, test validators and researchers are discussed.
1 INTRODUCTION
In recent years, a number of studies have looked at variability in performance on spoken tasks from the perspective of language testing. Empirical evidence has been found to suggest significant effects resulting from test-taker-related variables (Berry 1994, 2004; Kunnan 1995; Purpura 1998), interlocutor-related variables (O’Sullivan 1995, 2000a, 2000b; Porter 1991; Porter & Shen 1991) and rater- and examiner-related variables (Brown 1995, 1998; Brown & Lumley 1997; Chalhoub-Deville 1995; Halleck 1996; Hasselgren 1997; Lazaraton 1996a, 1996b; Lumley 1998; Lumley & O’Sullivan 2000, 2001; Ross 1992; Ross & Berwick 1992; Thompson 1995; Upshur & Turner 1999; Young & Milanovic 1992).
Skehan and Foster (1997) have suggested that foreign language performance is affected by task processing conditions (see also Ortega 1999; Shohamy 1983; Skehan 1998). They have attempted to manipulate processing conditions in order to modify or predict difficulty. In line with this, Skehan (1998) and Norris et al (1998) have made serious attempts to identify task qualities which impinge upon task difficulty in spoken language. They proposed that difficulty is a function of code complexity, cognitive complexity, and communicative demand. A number of empirical findings have revealed that task difficulty has an effect on performance, as measured in the three areas of accuracy, fluency, and complexity (Skehan 1998; Mehnert 1998; Wigglesworth 1997; Skehan & Foster 1997, 1999; Ortega 1999; O’Sullivan, Weir & ffrench 2001).
2 THE ORAL PRESENTATION
‘Oral presentation’ is advocated as a valuable elicitation task for assessing speaking ability by a number of prominent authorities in the field (Clark & Swinton 1979; Bygate 1987; Underhill 1987; Weir 1993, 2005 Hughes 1989, 2003; Butler et al, 2000; Fulcher 2003; Luoma 2004). Its practical advantages are obvious, not least that it can be delivered in a variety of modes. The telling advantage of this method is one speaker produces a long turn alone, without interacting with other speakers. As such, it does not suffer from the ‘contaminating’ effect of the co-construction of discourse in interactive tasks where one participant’s performance will affect the other’s, so is also more suitable for the investigation of intra-task variation, the subject of this study (Iwashita 1997; Luoma 2004; McNamara 1996; Ross & Berwick 1992; Weir 1993, 2005).
Over the past three decades, oral presentation tasks (also known as ‘individual long turn’ or ‘monologic’ tasks) have become an established format in high stakes oral testing as examining boards have come to routinely employ them in spoken language tests. The Test of Spoken English (TSE) from Educational Testing Service (ETS) in the USA, the International English Language Testing System (IELTS), the Cambridge ESOL Main Suite examinations, and the College English Test in China (the world’s biggest EFL examination) all include an ‘oral presentation’ task in their tests of speaking. In ETS’s TOEFL Academic Speaking Test (TAST) only monologues are used. In the context of the New Generation TOEFL speaking component, Butler et al (2000) advocate testing ‘extended discourse’, arguing that this is most relevant to the academic use of language at the university level. Earlier, Clark and Swinton (1979) found that the ‘picture sequence’ task was one of the most effective techniques in experimental tests which investigated suitable techniques for a speaking component for TOEFL.
Given its importance, it is surprising that over the last 20 years no research articles dedicated to oral presentation speaking tasks per se can be found in the most prominent journal in the field, Language Testing. Similarly, there has been little published research on the long turn elsewhere even in the non-language testing literature (see Abdul Raof 2002). Certainly, very little empirical investigation has been conducted to find out what contributes to the degree of task difficulty within oral
presentation tasks in a speaking test even though such tasks play an important function in high stakes tests around the world.
3 TASK DIFFICULTY
In recent years, a number of studies have looked at variability in spoken performance from the perspective of task difficulty in language testing. Empirical evidence has been found to suggest significant effects resulting from how interlocutor-related variables impact on difficulty in interaction-based tasks (Porter 1991; Porter & Shen 1991; O’Sullivan 2000a, 2000b, 2002; Berry 1997, 2004; Buckingham 1997; Iwashita 1997).
In terms of the study of test task related variables, a number of studies concerning inter-task comparison have been undertaken. These have adopted both quantitative perspectives (Chalhoub-Deville 1995; Fulcher 1996; Henning 1983; Lumley & O’Sullivan 2000, 2001; O’Loughlin 1995; Norris et al 1998; Robinson 1995; Shohamy 1983; Shohamy, Reves & Bejarano 1986; Skehan 1996; Stansfield & Kenyon 1992; Upshur and Turner 1999; Wigglesworth & O’Loughlin 1993) and qualitative perspectives (Bygate 1999; Kormos 1999; O’Sullivan, Weir & Saville 2002; Shohamy 1994; Young 1995). These studies were conducted to investigate the impact on scores awarded for speakers’ performances across the different tasks. O’Sullivan and Weir (2002) report that on the whole, the results of these investigations are mixed, perhaps in part due to the crude nature of such investigations where many variables are uncontrolled, and tasks and test populations tend to vary with each study.
There is less research available on intra-task comparison, where internal aspects of one task are systematically manipulated. This is perhaps surprising as this type of study enables the researcher to more closely control and manipulate the variables involved. Skehan and Foster (1997) suggest that foreign language performance is affected by task processing conditions. They propose that difficulty is a function of code complexity, cognitive complexity, and communicative stress. This view is largely supported by the literature (see, for example, Foster & Skehan 1996, 1999; Mehnert 1998; Ortega 1999; Skehan 1996, 1998; Skehan and Foster 2001; Wigglesworth 1997; Brown & Yule 1983; Crookes 1989). The most likely sources of intra-task variability appear to lie in the three broad areas outlined by Skehan and Foster (1997) mentioned above and appear to be most clearly observed when the following specific performance conditions are manipulated:
- Planning time
- Planning condition
- Audience
- Type and amount of input
- Response time
- Topic familiarity
Empirical findings have revealed that intra-task variation in terms of these conditions has an effect on performance as measured in the four areas of accuracy, fluency, complexity and lexical range (Ellis 1987; Crookes 1989; Williams 1992; Skehan 1996; Mehnert 1998; Wigglesworth 1997; Foster & Skehan 1996; Skehan & Foster 1997, 1999; Ortega 1999; O’Sullivan, Weir & ffrench 2001).
Weir (2005) argues that it is critical that examination boards are able to furnish validity evidence on their tests and that this should include research-based evidence on intra-task variation, ie how the conditions under which a single task is performed affect candidate performance. Research into intra-task variation is critical for high stakes tests because if we are able to manipulate the difficulty level of tasks we can create parallel forms of tasks at the same level and offer a principled way of establishing versions of tasks across the ability range (elementary to advanced). This is clearly of relevance to examination bodies that offer a suite of examinations as is the case with Cambridge ESOL.
4 THE STUDY
This study is primarily designed to explore how the difficulty of the IELTS Speaking paper Part 2 task (Individual Long Turn) can be deliberately manipulated using a framework based on the work of Skehan (1998), while working within the socio-cognitive perspective of test validation suggested by O’Sullivan (2000a) and discussed in detail by Weir (2005).
In this research project, the conditions under which tasks are performed are treated as independent variables. We have omitted the variables type and amount of input and topic familiarity from our study as it was decided that it was necessary to limit the scope of the study. These were felt to be adequately controlled for in the task selection process (described in detail below) in which an analysis of the language and topic of each task was undertaken (by considering student responses from the pilot study questionnaire and from the responses of an ‘expert’ panel who applied the difficulty checklist to all tasks). The variable audience was also controlled for by identifying the same audience for each task variant. The remaining variables are operationalised for the purpose of this study in the following way:
| Variable | Unaltered | Altered |
|---|---|---|
| Planning Time | 1 minute | No planning time |
| Planning Condition | Guided (3 scaffolding points) | No scaffolding |
| Response Time | 2 minutes | 1 minute |
Table 1: Task manipulation
The first of the three manipulations is in response to the findings of researchers such as Skehan and Foster (1997, 1999, 2001), Wigglesworth (1997) and Mehnert (1998) who suggest that there is a significant difference in performance where as little as one minute of planning is allowed. Since the findings have shown that this improvement is manifested in increased accuracy, we expect that the scores awarded by raters for this criterion will be most significantly affected. The second area of manipulation is related to the suggestion (by Foster & Skehan, among others) that the nature of the planning can contribute to its effect. For that reason, students will be given an opportunity to engage in guided planning (by using the scaffolded points) or unguided planning (where these points are removed). Finally, the notion of response time is addressed. Anecdotal evidence from examiners and researchers who have listened to recordings of timed responses suggest that test-takers (particularly at a low level of proficiency) tend to run out of things to say and either struggle to add to their performance, engage in repetition of points already made, or simply dry up. Any of these situations can lead to a lowering of the scores candidates are awarded by examiners. Since the original version of this task asks test-takers to respond for 1 to 2 minutes, it was felt to be important to investigate what the consequences of allowing this wide variation in performance time might be.
The hypotheses are formulated as follows:
- Planning time will impact on task performance in terms of the test scores achieved by candidates.
- Planning condition will impact on task performance in terms of the test scores achieved by candidates.
- Response time will impact on task performance in terms of the test scores achieved by candidates.
- Differences in performance in respect of the variables in hypotheses 1 to 3 will vary according to the level of proficiency of test-takers.
- The manipulations to each task, as represented in hypotheses 1-3, will result in significant changes in the internal processing of the participants (i.e. the theory-based validity of the task will be affected by manipulating elements of the task setting or demands).
4.1 Aims of the study
To establish any differences in candidate linguistic behaviour, as reflected in test scores, arising from language elicitation tasks that have been manipulated along a number of socio-cognitive dimensions
Since all students complete a theory-based validity questionnaire on completion of each of the four tasks they perform (see Appendix 7), analysis of these responses will allow us to make statements regarding the second of our research questions:
To establish any differences in candidate behaviour (cognitive processing) arising from language elicitation tasks that have been manipulated along a number of socio-cognitive dimensions
4.2 Methodology
As mentioned above, this study employs a mixture of quantitative and qualitative methods as appropriate. The study is divided into a number of phases, described below.
Phase 1: In this phase, a number of retired IELTS oral presentation tasks were analysed by the researchers using a checklist based on Skehan (1996). This analysis led to the selection of a series of nine tasks from which it was hoped to identify at least four that were truly equivalent (see Appendix 1 for the checklist). Readability statistics were generated for each of the tasks (see Appendix 2) in order to ascertain that each task was similar in terms of level of input. In addition to these analyses, a qualitative perspective on the task topics was undertaken. The nine tasks are contained in Appendix 3.
Phase 2: A series of pilot administrations was conducted involving overseas university students at a UK institution. These students were on or above the language threshold level for entry into UK university (ie approximately 6.5 on the IELTS overall band scale). The students were asked to perform a number of tasks and to report verbally to one of the researchers on their experience. From these pilot studies it was noted that the topic of two of the tasks (‘visiting a museum or art gallery and ‘entering a contest’) were considered by many students to be outside their experience and as such too difficult to talk about for two minutes. For this reason, the former was changed to a ‘sports event’ and the scaffolding or prompts rewritten, while the latter was dropped from the study. It was decided at this stage that the eight tasks that remained were suitable, and that these should form the basis of the next phase (these are in Appendix 4).
Phase 3: In this phase of the project, a formal trial of the eight selected tasks (A to H) was undertaken.
4.2.1 Quantitative analysis
A group of 54 students was asked to participate in the trial. Each student was asked to complete four tasks, and to fill in a short questionnaire immediately on completing each task. To ensure that an approximately equal number of students responded to each task, the following matrix was devised. This meant that students were given at random a pack marked Version 1 to 8. These packs contained the rubric for each of the tasks in the pack as well as four questionnaires.
| Version 1 | Version 2 | Version 3 | Version 4 | Version 5 | Version 6 | Version 7 | Version 8 |
|---|---|---|---|---|---|---|---|
| A | H | G | F | E | D | C | B |
| B | A | H | G | F | E | D | C |
| C | B | A | H | G | F | E | D |
| D | C | B | A | H | G | F | E |
Table 2: Make-up of task batches for the trial
The above design resulted in the following numbers of students responding to each task.
| Task | Number of Students |
|---|---|
| A | 27 |
| B | 26 |
| C | 27 |
| D | 28 |
| E | 26 |
| F | 26 |
| G | 26 |
| H | 26 |
Table 3: Number of students responding to each task
The students performed the tasks in a multimedia laboratory, speaking directly to a computer. Each student’s four responses were recorded and saved on the computer as a single file. These files were later edited to remove unwanted elements (such as long breaks following the end of a task performance or unwanted noise that occurred outside of the performance but was inadvertently recorded). The volume of each file was edited to ensure maximum audibility throughout. The performances of each student were then split up into the four constituent tasks and further edited (ie an indicator of student number and task was inserted at the beginning of the task and a bleep inserted to signal to the future rater that the task was now complete). The order of the files was randomised using a random numbers list generated using Microsoft Excel. Finally, eight CDs were created, each of which contained all of the performances for each task.
These eight CDs were then duplicated and a set was given to each of two trained and experienced IELTS raters who rated all tasks over a one-week period. The resulting score data were subjected to multi-faceted Rasch (MFR) analysis using the FACETS program (Linacre 2003) in order to identify a set of at least four tasks where any differences in difficulty could be shown to be statistically insignificant. (For recent examples of this statistical procedure in the language testing literature see Lumley & O’Sullivan 2005, Bonk & Ockey 2004).
The task measurement report from the FACETS output (Table 4) suggests that Task A is potentially significantly easier than the other seven. In addition, the infit mean square statistic (which indicates that all tasks are within the accepted range) suggests that all of the tasks are working in a predictable way.
| Fair-M Average | Model Measure | Model S.E. | Infit MnSq | Infit ZStd | Outfit MnSq | Outfit ZStd | N | Task |
|---|---|---|---|---|---|---|---|---|
| 5.86 | -.71 | .11 | 1.1 | 0 | 1.1 | 0 | 1 | A |
| 5.74 | -.27 | .11 | 1.1 | 0 | 1.1 | 1 | 2 | B |
| 5.69 | -.11 | .11 | 1.0 | 0 | 1.0 | 0 | 3 | C |
| 5.66 | -.02 | .11 | .8 | -2 | .8 | -2 | 4 | D |
| 5.63 | .08 | .12 | .9 | -1 | .9 | -1 | 5 | E |
| 5.51 | .45 | .12 | 1.2 | 1 | 1.1 | 1 | 6 | F |
| 5.56 | .29 | .11 | 1.0 | 0 | .9 | 0 | 7 | G |
| 5.57 | .28 | .11 | 1.0 | 0 | 1.0 | 0 | 8 | H |
Table 4: Task measurement report (summary of FACETS output)
Follow-up analysis of the scores awarded by the raters indicates that this difference appears to be of statistical significance only in the case of Tasks G and H (see Appendix 5) which appear to be significantly easier than Tasks A and C. The boxplots generated from the SPSS output (Figure 1) suggest that there is a broader spread of scores for Tasks A and C, though in general the mean scores do not appear to be widely spread.

Figure 1: Boxplots comparing task means from SPSS output
The results of these analyses suggest that Tasks A, C, G and H should not be considered for inclusion in the main study, though all of the others are acceptable.
4.2.2 Qualitative analysis
In addition to the quantitative analysis described above, we analysed the responses of all students to a short questionnaire (see Appendix 6) about students’ perceptions of the tasks. For this phase of the study, we focused primarily on their responses to the items related to topic familiarity and degree of abstractness of the tasks. The data from these questionnaires (each student completed a questionnaire for each task) were entered into SPSS and analysed for instances of extreme views - as it was thought that we should only accept tasks in which the students felt a degree of comfort that the topic was familiar and that the information given was of a concrete nature. From this analysis, we made a preliminary decision to eliminate two of the eight tasks: Tasks G and H (Table 5). It was decided to monitor Task C, as students perceived it as being somewhat difficult in terms of vocabulary and grammar - though the language of the task (see Appendix 4) does not appear to be significantly different from that of the other tasks.
| Topic | Information | Vocabulary | Grammar | |||||||||||||||||
|---|---|---|---|---|---|---|---|---|---|---|---|---|---|---|---|---|---|---|---|---|
| TASK | 1 | 2 | 3 | 4 | 5 | 1 | 2 | 3 | 4 | 5 | 1 | 2 | 3 | 4 | 5 | 1 | 2 | 3 | 4 | 5 |
| A | 9 | 8 | 7 | 3 | 0 | 9 | 8 | 8 | 1 | 0 | 12 | 8 | 6 | 1 | 0 | 11 | 10 | 4 | 1 | 0 |
| B | 8 | 8 | 6 | 2 | 1 | 9 | 6 | 10 | 1 | 0 | 14 | 8 | 4 | 0 | 0 | 11 | 7 | 6 | 1 | 1 |
| C | 2 | 13 | 5 | 2 | 3 | 6 | 9 | 7 | 3 | 1 | 12 | 6 | 4 | 4 | 1 | 8 | 9 | 8 | 2 | 0 |
| D | 9 | 9 | 7 | 1 | 2 | 5 | 12 | 6 | 3 | 1 | 11 | 13 | 3 | 1 | 0 | 11 | 13 | 4 | 0 | 0 |
| E | 7 | 8 | 8 | 2 | 0 | 6 | 10 | 10 | 0 | 0 | 15 | 8 | 2 | 1 | 0 | 14 | 8 | 3 | 1 | 0 |
| F | 4 | 10 | 8 | 3 | 1 | 6 | 9 | 11 | 0 | 0 | 11 | 7 | 6 | 0 | 1 | 10 | 11 | 4 | 0 | 0 |
| G | 3 | 8 | 11 | 3 | 1 | 7 | 2 | 12 | 4 | 1 | 14 | 5 | 4 | 3 | 0 | 11 | 6 | 8 | 1 | 0 |
| H | 7 | 3 | 11 | 3 | 2 | 7 | 3 | 10 | 3 | 3 | 15 | 6 | 5 | 0 | 0 | 11 | 5 | 9 | 1 | 0 |
KEY: Topic 1 = Familiar 5 = Unfamiliar Information 1 = Very Concrete 5 = Very Abstract Vocabulary & Grammar 1 = Easy 5 = Difficult
Table 5: Qualitative analysis of the tasks (suggesting that G & H be eliminated)
Based on the two types of analyses, the researchers identified four tasks as being equivalent from the qualitative and quantitative perspectives. These were:
| Task B | Task E |
|---|---|
| B. Describe a part-time/holiday job that you have done. You should say: How you got the job What the job involved How long the job lasted And explain why you think you did the job well or badly. | E. Describe a teacher who has influenced you in your education. You should say: Where you met them What subject they taught What was special about them And explain why this person influenced you so much. |
| Task D | Task F |
| D. Describe an enjoyable event that you experienced when you were at school. You should say: What the event was When it happened What was good about it And explain why you particularly remember this event. | F. Describe a film or a TV programme which made a strong impression on you. You should say: What kind of film or TV programme it was (eg comedy) When you saw it What it was about And explain why it made such an impression on you. |
Figure 2: Four tasks selected for the main study (Phase 5)
In addition to identifying four tasks that can be considered ‘equivalent’ from as broad a number of perspectives as possible, the early phases of the project also saw the development of a series of theory-based validity questionnaires based on ongoing research at the Centre for Research in Testing, Evaluation and Curriculum (CRTEC) at Roehampton University, London (reported by Akmar Zaina Abidin at the Language Testing Forum, Cambridge, 2003). These questionnaires, which are designed to offer insights into the cognitive processing of the participants before and during test task
performance, are based on Weir (2005) and were piloted during Phase 3 (see Appendix 7 for the four versions developed for use in this project).
During this piloting, a number of minor amendments were made to the original drafts based on qualitative feedback from participants - primarily for reasons of clarity and where the language proved to be beyond the level of participating learners.
Phase 4: The above phases meant that we were able to identify a set of four oral presentation tasks for which we could claim equivalence from both qualitative and quantitative perspectives; to the best of our knowledge, this has not been attempted before in either language testing or SLA research.
In this phase, the resulting tasks were manipulated according to the variables identified in Section IV above. Table 6 shows that this manipulation resulted in four versions of each of the four tasks: Task B remained unchanged, Task D had no planning time, Task E had no scaffolding and Task F required a response time of one minute (instead of two minutes).
| Task | No Change | No Planning time | No Scaffolding | 1 minute response |
|---|---|---|---|---|
| B | ● | x | x | X |
| D | x | ● | x | X |
| E | x | x | ● | X |
| F | x | x | x | ● |
Table 6: Manipulation of each task
To ensure that there was no order effect, the following matrix was designed (see Table 7). As described above, in this phase of the study, students were asked to perform four tasks, one of which remained unchanged from the original and the others manipulated in the way described in Table 6. In the matrix in Table 7, each version appears on an equal number of occasions and at each level (ie to be performed first, second, etc).
| Version 1 | Version 2 | Version 3 | Version 4 |
|---|---|---|---|
| B | D | E | F |
| D | B | F | E |
| E | F | B | D |
| F | E | D | B |
Table 7: Setup for test versions for the main study
The tasks used in the study can be seen in Figure 3 below.

Figure 3: Manipulation of the tasks in the main study
Phase 5: In the main part of the study, a total of 74 language students at a range of ability levels performed all four versions of the tasks according to the schedule defined by the matrix in Table 7. The resulting audio files were then edited and saved as individual MP3 files. This was done to avoid any halo effect in the rating process as the four tasks performed by any individual were separated so that raters would not be overly affected by performance on an early task when rating the later tasks. Four CDs were created each containing a randomised set of performances for each task (B, D, E and F). These were rated by two IELTS trained examiners working independently of each other using the current rating criteria and scales for the operational IELTS Speaking Test.
5 RESULTS
The scores from these ratings were then analysed using MFR and the resulting data were used for ANOVA and correlational analysis using the programme SPSS, Version 12. The model used in this MFR analysis takes into account the ability of the candidates, the relative harshness of the raters and the difficulty of the tasks to suggest a score called the Fair Average; Fair Average scores have the additional advantage of being true interval in nature.
This will allow us to make statements regarding the first aim of the study:
- To establish any differences in candidate linguistic behaviour, as reflected in test scores, to language elicitation tasks that have been manipulated along a number of socio-cognitive dimensions
Since all students complete a theory-based validity questionnaire on completion of each of the four tasks they perform (see Appendix 7), analysis of these responses will allow us to make statements regarding the second of our research questions:
- To establish any differences in candidate behaviour (cognitive processing) to language elicitation tasks that have been manipulated along a number of socio-cognitive dimensions
The existence (or not) of observable systematic differences across the four tasks will be interpreted in light of our third aim:
- To create a framework for the systematic manipulation of speaking tasks
5.1 Rater agreement
Before analysing the candidate performance data, it is first necessary to explore the area of inter-rater reliability. In this project, a number of measures will be considered, in order to gain a broad picture of the extent to which the two raters behaved in a consistent and predictable way.
First correlation analysis was undertaken to explore the degree to which the two raters placed the candidates in a similar order. The results of this analysis (Table 8) indicate a significant level of correlation for all comparisons (the more meaningful correlations have been highlighted in the table). The overall agreement, based on the raw data is 0.75, certainly acceptable, though not as high as we would expect to find in an operational test event (where it is usual to expect correlations above 0.8). It is possible that the unnatural nature of the rating process, where each rater was given a set of four CDs each one containing the performances of all candidates for a particular task, may have affected rating.
| Fluency & coherence 2 | Lexical resource 2 | Grammatical range & accuracy 2 | Pronunciation 2 | Overall 2 | |
|---|---|---|---|---|---|
| Fluency & coherence 1 | .700 | .696 | .685 | .629 | .738 |
| Lexical resource 1 | .677 | .662 | .662 | .592 | .694 |
| Grammatical range & accuracy 1 | .656 | .631 | .668 | .588 | .679 |
| Pronunciation 1 | .583 | .604 | .651 | .589 | .640 |
| Overall 1 | .720 | .703 | .715 | .643 | .750 |
All correlations significant at the 0.01 level (2-tailed).
Table 8: Correlations between the raters
Another estimate of inter-rater agreement is the degree to which they agree on scores around the critical boundary. A widely recognised threshold boundary for IELTS is an overall band score of 6.5 (ie the level demanded by most universities for entrance, computed from scores on the four skills modules); although operational scores for IELTS Speaking are only reported at the whole band level, it was decided to use 6.5 in the following analysis. Table 9 shows the level of agreement/disagreement between the two raters. The shaded areas of the table indicate the areas in which the two raters agreed. This indicates that they agreed for a total of 78% of the candidates and disagreed on the remaining 22%. The table also suggests that Rater 1 is somewhat harsher than Rater 2.
From these two analyses, we can see that the raters were in broad agreement. As both the correlation between the overall scores and the critical boundary agreement indices are acceptable, we can accept that the scores awarded can be used for additional analysis.
| Rater 2 Pass | Rater 2 Fail | |
|---|---|---|
| Rater 1 Pass | 48 | 45 |
| Rater 1 Fail | 20 | 183 |
Table 9: Critical boundary agreement (boundary = 6.5)
5.2 Score data analysis
Following the tests of rater agreement, the first analysis conducted on the task performance score data involved estimating the correlations between the four tasks. Table 10 shows that the correlation were very high and were all significant at the 0.01 level. It is particularly interesting to see that Task B is most highly correlated with Tasks D and F suggesting that the existence of planning time may not significantly affect task performance. Task D was the same as Task B with the single exception that in Task D there was no planning time available to test candidates. The other interesting suggestion here is that the amount of output expected of the candidate does not appear to have had a significant impact on the score achieved. Task F is the same as Task B except that the candidates are expected to talk for two minutes in the former and for just one minute in the latter.
Correlations
| Task B | Task D | Task E | Task F | |
|---|---|---|---|---|
| Task B | 1 | .900 | .871 | .901 |
| Task D | .900 | 1 | .862 | .858 |
| Task E | .871 | .862 | 1 | .862 |
| Task F | .901 | .858 | .862 | 1 |
All correlations are significant at the 0.01 level (2-tailed).
Table 10: Correlations between the four tasks
To more fully explore the data from the perspective of variation in performance across the four tasks it was decided to classify each candidate into one of three groups; those who are of High ability (setting the critical boundary at 6.5 and including those at and above it); those who could be considered Borderline cases (here the range is from 6.0 to 6.5); and finally those who would have been categorised as Low ability candidates (scoring less than 6.0). All three of these categorisations were based on performance over the four tasks.
| Variable | Category | N |
|---|---|---|
| Ability Level | Pass | 19 |
| Ability Level | Borderline Fail | 27 |
| Ability Level | Fail | 28 |
| Task | Original | 74 |
| Task | No Planning | 74 |
| Task | No Support | 74 |
| Task | Reduced Response | 74 |
Table 11: Descriptive statistics of the main study data
The descriptive statistics (see Table 11) show that the relative ability level of the population was quite low, with approximately half of the candidates in the ‘fail’ category and only about 20% clearly achieving 6.5 or above. The results of the ANOVA (Table 12) show that there are significant differences between the four task types and the three ability groups (as we would expect since they were selected based on overall scores averages over the four tasks). There does not appear to be any significant interaction between the ability groups and the task type suggesting the stability of these tasks across ability level. However, significant differences emerge in respect of task and ability as separate variables.
| Source | Type III Sum of Squares | Df | Mean Square | F | Sig. |
|---|---|---|---|---|---|
| Corrected Model | 158.490(a) | 11 | 14.408 | 58.714 | .000 |
| Intercept | 9891.754 | 1 | 9891.754 | 40309.670 | .000 |
| Task | 4.287 | 3 | 1.429 | 5.823 | .001 |
| Ability | 151.483 | 2 | 75.742 | 308.653 | .000 |
| task * ability | 2.570 | 6 | .428 | 1.745 | .110 |
| Error | 69.692 | 284 | .245 | ||
| Total | 10066.500 | 296 | |||
| Corrected Total | 228.182 | 295 |
R Squared = .695 (Adjusted R Squared = .683)
Table 12: ANOVA results from the main study
The post hoc (Bonferroni) analysis (Table 13) suggests that there are differences in the responses and that these are significant for comparisons between the original version of the task and the versions which included no planning time and reduced response time. The actual differences in scores achieved for these tasks are approximately one third and one quarter of a band respectively with the original task proving easier in both cases.
| Comparison | Mean Difference | Sig. | 95% CI Lower Bound | 95% CI Upper Bound | |
|---|---|---|---|---|---|
| Original | No Planning | .32(*) | .001 | .10 | .54 |
| Original | No Support | .15 | .378 | -.06 | .37 |
| Original | Reduced Response | .26(*) | .008 | .05 | .48 |
| No Planning | No Support | -.17 | .234 | -.39 | .05 |
| No Planning | Reduced Response | -.06 | 1.000 | -.27 | .16 |
| No Support | Reduced Response | .11 | 1.000 | -.10 | .33 |
Based on observed means.* The mean difference is significant at the .05 level.
Table 13: Multiple post hoc analysis (Bonferroni)
Having completed the main analyses, a set of charts was then generated. These consisted of a set of clustered boxplots and a line diagram, both of which were based on averaged scores for each task but with ability group also taken into account.
In the first of these charts (Figure 4) we can see that there is relatively little difference in the range of mean scores achieved by each group for the four tasks. While there is a clear difference between the three ability groups in terms of the mean scores achieved by each group for the different tasks, there is also an apparent difference between the pattern of scores on the four tasks between the High ability group (the ‘pass’ group), the Borderline group and the Low ability group (the ‘fail’ group).

Figure 4: Boxplots comparing task mean score by ability group
In the final chart (Figure 5 - see following page) we can now see that the pattern of scoring is relatively similar for the Low and Borderline groups but quite different for the High scoring group. Taken with the significant results found in the ANOVA reported above, this suggests that manipulating tasks may result in more complex effects on difficulty than initially thought. The standard version of the task appears to result in optimum performance for all groups; by contrast, the no-planning version appears to result in systematically lower scores across the three ability groups. The lack of support (or scaffolding) appears to have a greater negative impact on test scores achieved by the High and Borderline groups while at the same time having only a very slight (and certainly non-significant) impact on the Low group who may be at a level of language ability where any changes have little impact on performance. Finally, the reduction in response time appears to have had little impact on the performances of the High and Borderline groups, though it clearly has had a different impact on the Low group, with their mean score at its lowest point.
Estimated Marginal Means of tottask
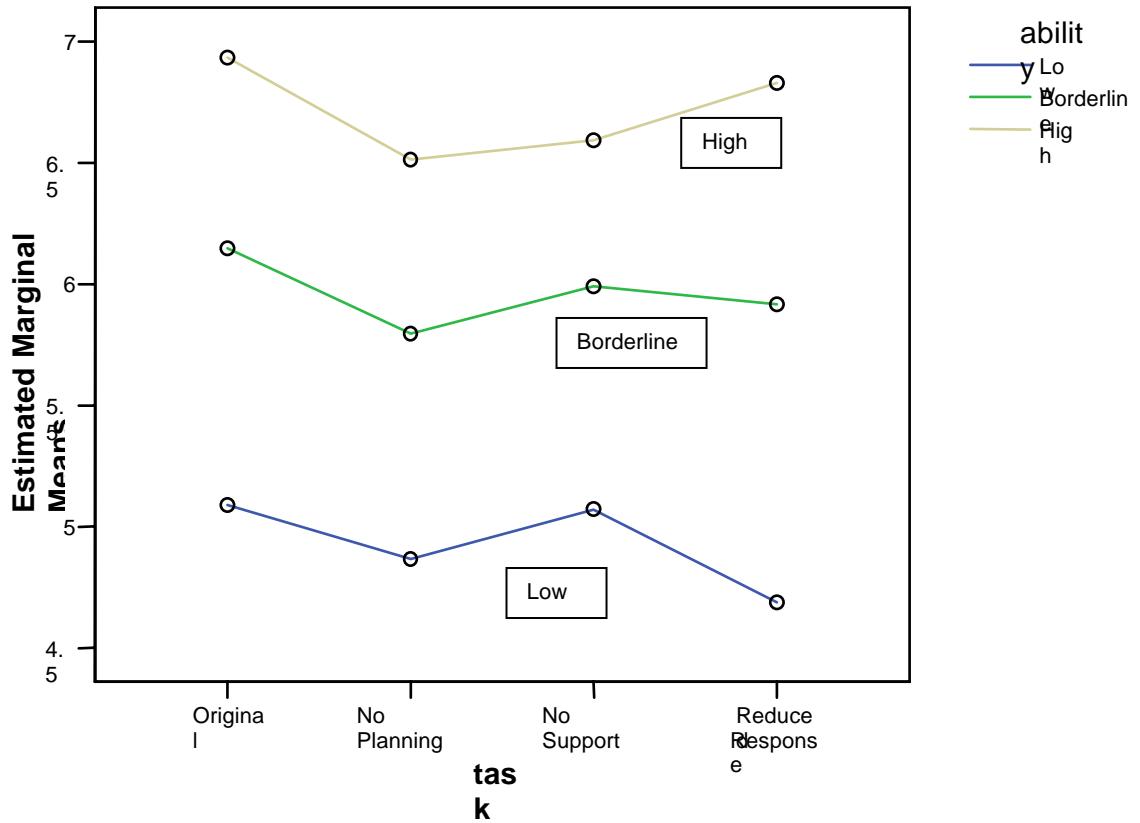
Figure 5: Line diagram comparing task mean score by ability group
5.3 Questionnaire data analysis (from the perspective of the task)
For reasons of clarity of analysis and presentation, we will present the results from the three parts of the questionnaires separately. In the first part of the questionnaire, all participants were asked to respond to items related to how they dealt with their initial response to each task version. The results are shown in Table 13 below. These results are based on a series of univariate ANOVAs carried out on the data after the questionnaires had been shown to be working as predicted through factor analysis.
The factor analysis of the data was carried out to find evidence that the questionnaires were producing consistent results. Since the three parts of the instrument had been designed to elicit information on specific aspects of the candidates’ behaviour, it was expected that a factor analysis of the responses should result in identifying background factors that matched the planning. The results of the analysis of Part 1 indicated a very clear two-factor solution, with the first four items loading on Factor 1 (which we suggest indicates a more general background knowledge of speaking test response), while the latter four items load a second factor (which appears to be more task-specific knowledge).
| Factor | Item | Component 1 | Component 2 |
|---|---|---|---|
| Goal setting | I read the task very carefully to understand what was required. | .104 | .702 |
| Goal setting | I thought of HOW to deliver my speech in order to respond well to the topic. | .114 | .748 |
| Goal setting | I thought of HOW to satisfy the audiences and examiners. | .273 | .643 |
| Goal setting | I understood the instructions for this speaking test completely. | .182 | .657 |
| Generating Ideas | I had ENOUGH ideas to speak about this topic. | .750 | .236 |
| Generating Ideas | I felt it was easy to produce enough ideas for the speech from memory. | .813 | .185 |
| Generating Ideas | I know A LOT about this type of speech, i.e., I know how to make a speech on this type of topic. | .823 | .180 |
| Generating Ideas | I know A LOT about other types of speaking test, e.g., interview, discussion. | .745 | .126 |
Extraction Method: Principal Component Analysis. Rotation Method: Varimax with Kaiser Normalisation. A Rotation converged in 3 iterations.
Table 14: Factor analysis of Questionnaire Part 1 (before speaking)
When this is taken into account, the analysis of the responses to individual items should reflect this two-factor solution.
In the first section, which explores candidates’ awareness of how they might go about responding to the task when in the initial stages of reading and considering their response, we can see that there are a number of significant differences between the tasks and the ability groups (though as with all responses to the questionnaire items there is no interaction between the two variables).
| Item | Ave. | Task Type | Ability Group | ||
|---|---|---|---|---|---|
| 1. I read the task very carefully to understand what was required. | 4.2 | √ | Less likely for No Planning | √ | Less likely for BORDERLINE group |
| 2. I thought of HOW to deliver my speech in order to respond well to the topic. | 3.7 | √ | Less likely for No Planning | ✕ | No meaningful differences |
| 3. I thought of HOW to satisfy the audiences and examiners. | 3.3 | ✕ | No meaningful differences | ✕ | No meaningful differences |
| 4. I understood the instructions for this speaking test completely. | 4 | √ | Less likely for No Planning | √ | More likely for HIGH group |
| 5. I had ENOUGH ideas to speak about this topic. | 3.1 | √ | More likely in Original, least for No Planning & No Support | √ | Less likely for LOW group |
| 6. I felt it was easy to produce enough ideas for the speech from memory. | 3.1 | √ | More likely in Original, least for No Planning & No Support | √ | Less likely for BORDERLINE group |
| 7. I know A LOT about this type of speech, i.e., I know how to make a speech on this type of topic. | 2.9 | ✕ | No meaningful differences | ✕ | No meaningful differences |
| 8. I know A LOT about other types of speaking test, e.g., interview, discussion. | 3 | ✕ | No meaningful differences | ✕ | No meaningful differences |
- = no significant difference found • = significant difference found Note: the Likert scale upon which the Average (column 2) is calculated is from 1-5
Table 15: Univariate ANOVA results for Questionnaire Part 1 (before speaking)
The mean response levels (in the Ave. column) indicate that the candidates are likely to read the instructions carefully, and that they tended to have no problem understanding the task. However, they were less likely to consider the audience (Item 3) or to give much thought to the generation of ideas prior to speaking (Items 5 - 8).
It is interesting to note that there is less likelihood that candidates responding to the No Planning version of the tasks will either read the rubric as carefully as for the other versions or think about how to respond in the same was as they might do for the other versions. However, it should be noted that the low mean response to the first item appears to have been heavily influenced by the Borderline group. Review of the data indicates that no errors in data entry could have led to this, and in the absence of post-test interview data, the reason for the very low response cannot easily be explained.
We can also see that the No Planning task appears to have resulted in candidates failing to fully understand the instructions (not surprising in light of the earlier responses which indicated they may not have read them carefully), though this was not a problem for the High ability group.
In the second part of the section, which focused on generating ideas in the pre-planning stage, candidates indicated that the manipulation of the task appears to have had a significant impact on their ability to produce ideas from their background knowledge. Where the task has been altered in terms of planning time or support offered, the candidates report significantly more difficulty in generating ideas - this is most significant for the Low and Borderline groups. For Items 5 and 6 the pattern of response for the Low group was similar across the four tasks, while both the High and Borderline groups indicated a high likelihood for both the Original task and the Reduced Response version and a low likelihood for the other two versions. Perhaps not surprisingly, in the final pair of items, which link the generating of ideas to what is essentially background knowledge, there are no meaningful differences between the tasks or between the three ability levels.
As with the factor analysis of the first section of the questionnaire, the analysis of the second section suggests that this part of the instrument is also working well (Table 16); note that in this analysis the No Planning task was not included as the candidates were not asked to complete a questionnaire since they had not been given any time for planning. The single exception seems to be Item 7, which loads on two factors, so in the analysis that follows this item has been removed. The six-factor solution reflects the original design.
| Factor | Item | Component 1 | Component 2 | Component 3 | Component 4 | Component 5 |
|---|---|---|---|---|---|---|
| Time Element | 1. I thought of MOST of my ideas for the speech BEFORE planning an outline. | -.071 | -.070 | .222 | .084 | .635 |
| Time Element | 2. During the period allowed for planning, I was conscious of the time. | .114 | .171 | -.067 | -.059 | .805 |
| Task Specific Planning | 3. I followed the 3 short prompts provided in the task when I was planning. | -.035 | .771 | .167 | -.061 | -.107 |
| Task Specific Planning | 4. The information in the short prompts provided was necessary for me to complete the task. | -.118 | .731 | -.001 | .042 | .156 |
| Task Specific Planning | 5. I wrote down the points I wanted to make based on the 3 short prompts provided in the task. | -.111 | .602 | .050 | .443 | .118 |
| Linguistic Planning | 6. I wrote down the words and expressions I needed to fulfil the task. | -.110 | .002 | .152 | .730 | .050 |
| Linguistic Planning | 7. I wrote down the structures I need to fulfil the task. | .439 | .000 | .162 | .512 | .310 |
| Language used when Planning | 8. I made notes only in ENGLISH. | -.758 | .114 | -.078 | .209 | .022 |
| Language used when Planning | 9. I took notes only in my own language. | .785 | -.056 | .084 | .157 | -.001 |
| Language used when Planning | 10. I took notes in both ENGLISH and own language. | .862 | -.092 | -.016 | -.039 | .044 |
| Organisation | 11. I planned an outline on paper BEFORE starting to speak. | -.057 | -.082 | .014 | -.652 | .045 |
| Organisation | 12. I planned an outline in my mind BEFORE starting to speak. | -.232 | -.004 | -.431 | .410 | -.200 |
| Generating & Practicing | 13. Ideas occurring to me at the beginning tended to be COMPLETE. | -.111 | .265 | .726 | .059 | .016 |
| Generating & Practicing | 14. I was able to put my ideas or content in good order. | .040 | .257 | .661 | .243 | -.066 |
| Generating & Practicing | 15. I practiced the speech in my mind WHILE I was planning. | .192 | -.396 | .584 | -.015 | .246 |
| Generating & Practicing | 16. After finishing my planning, I practiced what I was going to say in my mind until it was time to start. | .369 | -.309 | .543 | .000 | .241 |
Extraction Method: Principal Component Analysis. Rotation Method: Varimax with Kaiser Normalisation. A Rotation converged in 7 iterations.
Table 16: Factor analysis of Questionnaire Part 2 (planning - excludes Task 2)
The mean responses in Table 17 show an interesting pattern, particularly with the high levels for Items 3, 4 and 5 indicating that candidates tended to rely to a great extent on the bullet-pointed prompts: the high mean for Item 8 (when combined with the low means for Items 9 and 10) indicate that planning tends to be done in the target language (though the Low ability group are more likely to use L1). The low means for Items 11 and 12 suggest that little concern is given to planning an outline before speaking. This appears to contradict Item 5, where candidates say they wrote down the points they wanted to make before speaking. It is possible that they interpreted this as actually making a full plan or script of what to say, though not necessarily on paper. This needs to be clarified before any future administration of the instrument.
In the first part of the section (labeled ‘Time Element’) there is little difference across ability levels, though there appears to be a significant effect for the Reduced response version of the task for the item referring to awareness of time. Since there are only two significant effects for all items related to planning we can deduce that manipulating tasks in the ways adapted here may have a limited impact on the planning phase. These aspects can be summarised as:
-
With reduced response time candidates may feel they are under less pressure and so are less conscious of time when responding
-
Removing support from a task appears to make it more difficult for students to plan their response
-
High level candidates are more likely to rely on the supporting points in a task rubric
-
Low level candidates are more likely to use either their own language only or a combination of the target language and their own language in planning.
-
Low level students are more likely to practise what they are about to say both during and after planning
| Item | Ave | Task Type | Ability Level | ||
|---|---|---|---|---|---|
| 1. I thought of MOST of my ideas for the speech BEFORE planning an outline. | 3.64 | x | No meaningful difference | x | No meaningful differences |
| 2. During the period allowed for planning, I was conscious of the time. | 3.31 | √ | Least likely for Reduced Response | x | No meaningful differences |
| 3. I followed the 3 short prompts provided in the task when I was planning. | 3.99 | x | No meaningful differences | x | No meaningful differences |
| 4. The information in the short prompts provided was necessary for me to complete the task. | 3.78 | x | No meaningful differences | √ | HIGH group more likely to respond positively |
| 5. I wrote down the points I wanted to make based on the 3 short prompts provided in the task. | 3.84 | x | No meaningful differences | x | No meaningful differences |
| 6. I wrote down the words and expressions I needed to fulfil the task. | 3.35 | x | No meaningful difference | x | No meaningful differences |
| 7. I wrote down the structures I need to fulfil the task. | 2.4 | x | No meaningful difference | √ | LOW group more likely to respond positively |
| 8. I took notes only in ENGLISH. | 4.05 | x | No meaningful difference | x | No meaningful differences |
| 9. I took notes only in my own language. | 1.9 | x | No meaningful difference | √ | LOW group more likely to respond positively (but low means) |
| 10. I took notes in both ENGLISH and own language. | 2.14 | x | No meaningful difference | √ | Lower level more likely to respond positively |
| 11. I planned an outline on paper BEFORE starting to speak. | 1.25 | x | No meaningful difference | x | No meaningful differences |
| 12. I planned an outline in my mind BEFORE starting to speak. | 1.38 | x | No meaningful difference | x | No meaningful differences |
| 13. Ideas occurring to me at the beginning tended to be COMPLETE. | 3.12 | x | No meaningful difference | x | No meaningful differences |
| 14. I was able to put my ideas or content in good order. | 2.88 | √ | Less likely for No Support | x | No meaningful differences |
| 15. I practiced the speech in my mind WHILE I was planning. | 2.89 | x | No meaningful difference | √ | LOW group more likely to respond positively (but low means) |
| 16. After finishing my planning, I practiced what I was going to say in my mind until it was time to start. | 2.72 | x | No meaningful difference | √ | HIGH group less likely to respond positively |
- = no significant difference found • = significant difference found Note: Items 3, 4 and 5 not included in No Support version (as they refer to supporting points)
Table 17: Univariate ANOVA results for Questionnaire Part 2 (during planning)
In the final section of the questionnaire, candidates were asked to respond to items related to what they did as they were speaking. The factor analysis reflected the original design, as so the section was considered to have worked as predicted.
| Factor | Item | Component 1 | Component 2 | Component 3 | Component 4 |
|---|---|---|---|---|---|
| Idea Development (ability) | 1. I felt it was easy to put ideas in good order. | .819 | .083 | .079 | -.028 |
| Idea Development (ability) | 2. I was able to express my ideas using appropriate words. | .705 | .203 | .134 | .015 |
| Idea Development (ability) | 3. I was able to express my ideas using correct grammar. | .695 | .194 | .133 | .088 |
| Idea Development (ability) | 6. I was able to put sentences in logical order. | .736 | .226 | .086 | .040 |
| Idea Development (ability) | 7. I was able to CONNECT my ideas smoothly in the whole speech. | .602 | .264 | .073 | -.136 |
| Idea Development (ability) | 14. I felt it was easy to complete the task. | .748 | .125 | .158 | .094 |
| Idea Development (temporal) | 4. I thought of MOST of my ideas for the speech WHILE I was actually speaking. | -.048 | .205 | .330 | .714 |
| Idea Development (temporal) | 5. Some ideas had to be omitted while I was speaking. | .103 | -.132 | -.326 | .759 |
| Time Awareness | 8. I was conscious of the time WHILE I was making this speech. | .194 | .009 | .819 | -.025 |
| Time Awareness | 9. I tried NOT to speak more than the required length of time in the instructions. | .239 | .278 | .629 | .012 |
| Monitoring | 10. I was listening and checking the correctness of the contents and their order WHILE I was making this speech. | .251 | .754 | .030 | -.017 |
| Monitoring | 11. I was listening and checking whether the contents and their order fit the topic WHILE I was making this speech. | .195 | .786 | .049 | -.020 |
| Monitoring | 12. I was listening and checking the correctness of sentences WHILE I was making this speech. | .215 | .783 | .090 | .016 |
| Monitoring | 13. I was listening and checking whether the words fit the topic WHILE I was making this speech. | .170 | .744 | .221 | .107 |
Extraction Method: Principal Component Analysis. Rotation Method: Varimax with Kaiser Normalisation. A Rotation converged in 5 iterations.
Table 18: Factor analysis of Questionnaire Part 3 (during speaking)
The most interesting thing about mean responses in this section is the lack of variation across the items. In the first part, there is very much a ‘no view’ perspective displayed, suggesting that the candidates were not overly challenged by the tasks. In support of the findings for the previous section, there appears to have been a tendency for candidates to plan while speaking (Item 4) and a slight tendency for them to monitor the contents and language of their responses (though the latter seems to have been most likely with the High ability level).
In the first part of the section, which related to ease and ability to develop ideas, the suggestion appears to be that the candidates found the Original version of the task the easiest to respond to (though this was shared with the Reduced Response version for Item 1). Not surprisingly the High level candidates indicated that they found it easy to “express…ideas using good grammar,” while the Borderline candidates seemed to struggle with cohesion and coherence.
Low level candidates were more likely to omit ideas as they were speaking, though this was reported as being less likely with the No Support task version, possibly because the candidates considered the ‘idea’ to be related primarily with the three bullet-pointed supporting points suggested and when these were removed they struggled.
| Item | Ave. | Task Type | Ability Level | ||
|---|---|---|---|---|---|
| 1. I felt it was easy to put ideas in good order. | 2.9 | √ | Easier for Original and Reduced Response | × | No meaningful differences |
| 2. I was able to express my ideas using appropriate words. | 3 | × | No meaningful differences | × | No meaningful differences |
| 3. I was able to express my ideas using correct grammar. | 2.8 | × | No meaningful differences | √ | More likely with HIGH group |
| 6. I was able to put sentences in logical order. | 3 | × | No meaningful differences | √ | Less likely with BORDERLINE group |
| 7. I was able to CONNECT my ideas smoothly in the whole speech. | 2.8 | √ | More likely with Original, especially compared to No Planning | √ | Less likely with BORDERLINE group |
| 14. I felt it was easy to complete the task. | 2.9 | × | No meaningful differences | × | No meaningful differences |
| 4. I thought of MOST of my ideas for the speech WHILE I was actually speaking. | 3.4 | × | No meaningful differences | × | No meaningful differences |
| 5. Some ideas had to be omitted while I was speaking. | 3 | √ | Less likely with No Support version | √ | Most likely for LOW group |
| 8. I was conscious of the time WHILE I was making this speech. | 3.3 | × | No meaningful differences | × | No meaningful differences |
| 9. I tried NOT to speak more than the required length of time in the instructions. | 3.4 | × | No meaningful differences | × | No meaningful differences |
| 10. I was listening and checking the correctness of the contents and their order WHILE I was making this speech. | 3.3 | × | No meaningful differences | × | No meaningful differences |
| 11. I was listening and checking whether the contents and their order fit the topic WHILE I was making this speech. | 3.3 | × | No meaningful differences | √ | Less likely with Borderline group |
| 12. I was listening and checking the correctness of sentences WHILE I was making this speech. | 3.3 | × | No meaningful differences | √ | More likely with HIGH group |
| 13. I was listening and checking whether the words fit the topic WHILE I was making this speech. | 3.3 | × | No meaningful differences | √ | More likely with HIGH group |
- = no significant difference found • = significant difference found
Table 19: Univariate ANOVA results for Questionnaire Part 3 (during speaking)
Time did not seem to be particularly important to candidates, and though there was a slight tendency for them to be conscious of time, this does not appear to have varied across ability level or task type attempted. Similarly, though candidates tended to monitor their responses for content, organisation and language, this was not a very strong trend, with the exception of the High ability group who were significantly more likely to monitor their language (but not content or organisation) than the other groups.
6 CONCLUSIONS
In this research project we set out to establish whether the difficulty of a task could be varied by systematic manipulation along a number of dimensions. In doing this we were interested in whether the scores achieved by a group of test candidates would vary along with the cognitive processing associated with performance on the various tasks. This was hoped to provide the basis for a framework which could be used to manipulate tasks in order to systematically alter the difficulty of these tasks.
The project called for a set of four equivalent tasks to be identified so that all participants would respond to an unaltered version as well as three versions in which systematic variations had been made (removal of planning time; removal of support; and reduction of expected response time). In order to identify four equivalent tasks, a complex procedure was designed, in which a set of nine tasks was analysed both quantitatively (based on the performances of a group of 54 participants) and qualitatively (using the responses of these same participants to a series of short questionnaires).
At this stage, a set of four tasks was identified and manipulated as planned. A group of 74 participants then recorded their responses to the tasks which were presented to different people in different orders. At the same time, all respondents then completed questionnaires (one per task, so a total of four per participant) based on Weir’s (2005) socio-cognitive framework for test validation for speaking. The resulting data were then analysed using the two datasets.
Results of the analysis of the score data suggest that there are significant differences to be found in the responses of three ability groups to the four tasks, indicating that task difficulty may well be affected differently for test candidates of different ability. In other words, simply altering a task along a particular dimension may not result in a version that is equally more or less difficult for all test candidates. Instead, there is likely to be a variety of effects as a result of the alteration. For instance, here, mid-level and higher-level participants were not significantly affected by the reduction in response time, while this same alteration to the task resulted in the most serious negative effect for the lower level participants.
The analysis of the questionnaire data further complicates the picture. We can briefly summarise the findings as:
- The most significant effects of task manipulation on candidates appear to be at the prespeaking phase, particularly where no planning time is offered. However, these effects appear to differ depending on the ability level of the candidate.
- The effects on planning are far less obvious. The candidates report essentially the same approach to planning regardless of the task. Here, while there are far more significant differences in the ways in which candidates of different ability level approach task planning, there appears to be a clear tendency for them not to outline their response before speaking, so even though they take the time to plan, they seem to do much of their planning ‘on-line’ ie, as they are speaking (though lower level candidates report practising what they plan to say before speaking).
- When speaking, the candidates seemed to feel that the original version of the task offered them the greatest opportunity to perform at their best, though not surprisingly, this depended on their ability level (lower levels did not find any particular version easier in any way than the others). There was a significant difference in approach to monitoring of own output, with the higher level students more likely to monitor language, though not content or organisation).
6.1 Implications
We believe the study has implications for teachers who prepare students for examinations containing speaking tasks which involve individual long turn responses, for the test developers who design these tasks, for test validators and first and second language acquisition researchers.
6.1.1 Teachers
The differences in approach to task performance highlighted here suggest that teachers might focus more explicitly on pre-speaking strategies such as focusing more clearly on any bulleted prompts and on using the target language for any planning. The lack of impact on approach to planning of task manipulation suggests that students (certainly those involved in this study) have already formed strategies for task performance. However, to improve their understanding of a task, students should be encouraged to read task rubrics more carefully, focus on the language used in the instructions and perhaps ask for assistance where things are not clear.
6.1.2 Test developers
The notion of task equivalence is not as straightforward as it seems. The nine tasks initially used here were presumed by their developers to be equivalent. The methodology used to establish equivalence demonstrated how difficult it can be to create truly equivalent versions of a task. The main study also demonstrates how task difficulty can be affected by decisions to either include or exclude support (eg in the form of bulleted prompts) or by altering the planning time afforded to candidates. This suggests that any substantive changes to these conditions of task performance need to be empirically tested before they are considered in any test revision (or as alternative choices within a test). This is particularly relevant for the planning variable, where the difference in scores achieved was significantly lower for the ‘no planning’ condition than for the original version of the task (which allows one minute of planning time).
The situation regarding amount of response time seems to be less conclusive. Apart from a reduced awareness of time in the planning phase (possibly due to the perception that less speaking time meant there was less to worry about), there appears to have been no difference to the approach taken to task response. However, the scores achieved appear to have been significantly lower for this version than for the original version of the task (in the original version candidates spoke for 2 minutes as opposed to 1 minute in the reduced response version).
The rubric appears to be especially important in this type of task. It is clear that a number of candidates (typically at the lower level) had some difficulty understanding what to do. While this is possibly unavoidable in a test which is designed to be used across a broad range of abilities, it is clearly very important for the test developer to ensure measures are in place to avoid poor reading or listening skills affecting student spoken performance. In ‘live’ tests this is not so difficult (examiners can be trained to deal systematically with comprehension problems), though it is a potentially serious limitation of any computer-delivered test of this sort.
6.1.3 Test validators
In the same way that test developers need to focus on the area of task equivalence, test validators should also consider the area when establishing evidence of the context validity (see Weir 2005) of their tests. Consideration should be given to using the methodology developed here in order to establish true equivalence in test tasks, as well as to investigating how tasks are affected when variations are suggested by stakeholders.
6.1.4 Researchers
SLA researchers have argued since the mid-1980s that performing language elicitation tasks in a learning environment supports learning. While O’Sullivan (2000a: 298) argues that ‘[The] notion of an interlocutor effect on performance does not appear to have been sufficiently addressed in the [SLA] literature’, he also argues that the ’conditions under which tasks are performed should be more rigorously described’ (O’Sullivan, 2000a: 297). While there has been a recognition in the taskbased learning literature that task performance conditions can affect performance (Larson-Freeman & Long, 1991: 30-33), there is little evidence that this awareness has found its way into SLA or Applied Linguistics research.
The evidence presented in this project suggests that researchers need to more clearly understand the implications of decisions they make when designing tasks for use as elicitation devices in their studies. Research studies should contain both more detail of task design and equivalence and an awareness on the side of the researcher of the rationale for task selection and manipulation. In other words, tasks for both testing and research purposes should be specified in an equally systematic and comprehensive fashion using a model of validation such as that of Weir (2005) to ensure that the results obtained are credible in terms of the validity evidence available.
References
- Abdul Raof, AH, 2002, ‘The production of a performance rating scale: an alternative methodology’, unpublished PhD dissertation, The University of Reading, UK
- Berry, V, 1994, ‘Personality characteristics and the assessment of spoken language in an academic context’, paper presented at the 16th Language Testing Research Colloquium, Washington, DC
- Berry, V, 1997, ‘Gender and personality as factors of interlocutor variability in oral performance tests’, paper presented at the 19th Language Testing Research Colloquium, Orlando, Florida
- Berry, V, 2004, ‘A study of the interaction between individual personality differences and oral test performance test facets’, unpublished PhD dissertation, Kings College, The University of London
- Bonk, WJ and Ockey, GJ, 2003, ‘A many-facet Rasch analysis of the second language group oral discussion task’, Language Testing, vol 20, no 1, pp 89-110
- Brown, A, 1995, ‘The effect of rater variables in the development of an occupation specific language performance test’, Language Testing, vol 12, no 1, pp 1-15
- Brown, A, 1998, ‘Interviewer style and candidate performance in the IELTS oral interview’, paper presented at the 20th Language Testing Research Colloquium, Monterey, CA
- Brown, A, and Lumley, T, 1997, ‘Interviewer variability in specific-purpose language performance tests’ in Current Developments and Alternatives in Language Assessment, eds A Huhta, V Kohonen, L Kurki-Suonio and S Luoma, University of Jyväskylä and University of Tampere, Jyväskylä, pp137-150
- Brown, G, and Yule, G, 1983, Teaching the spoken language, Cambridge University Press, Cambridge
- Buckingham, A, 1997, ‘Oral language testing: do the age, status and gender of the interlocutor make a difference?’, unpublished MA dissertation, University of Reading
- Butler, FA, Eignor, D, Jones, S, McNamara, T, and Suomi, BK, 2000, TOEFL (2000) Speaking Framework: A Working Paper, TOEFL Monograph Series 20, Educational Testing Service, Princeton, NJ
- Bygate, M, 1987, Speaking, Oxford University Press, Oxford
- Bygate, M, 1999, ‘Quality of language and purpose of task: patterns of learners’ language on two oral communication tasks’, Language Teaching Research, vol 3, no 3, pp 185-214
- Chalhoub-Deville, M, 1995, ‘Deriving oral assessment scales across different tests and rater groups’, Language Testing, vol 12, pp16-33
- Clark, JLD and Swinton, SS, 1979, ‘An exploration of speaking proficiency measures in the TOEFL context’, TOEFL Research Report, Educational Testing Service, Princeton, NJ
- Crookes, G, 1989, ‘Planning and interlanguage variation’, Studies in Second Language Acquisition, vol 11, pp 367-383
- Ellis, R, 1987, ‘Interlanguage variability in narrative discourse: style shifting in the use of the past tense’, Studies in Second Language Acquisition, vol 9, pp 1-20
- Foster, P and Skehan, P, 1996, ‘The influence of planning and task type on second language performance’, Studies in Second Language Acquisition, vol 18, pp 299-323
- Foster, P and Skehan, P, 1999, ‘The influence of source of planning and focus of planning on taskbased performance’, Language Teaching Research, vol 3, no 3, pp 215-247
- Fulcher, G, 1996, ‘Testing tasks: issues in task design and the group oral’, Language Testing, vol 13, no 1, pp 23-51
- Fulcher, G, 2003, Testing second language speaking, Longman/Pearson, London
- Halleck, G, 1996, ‘Interrater reliability of the OPI: using academic trainee raters’, Foreign Language Annals, vol 29, no 2, pp 223-238
- Hasselgren, A, 1997, ‘Oral test subskill scores: what they tell us about raters and pupils’, in Current Developments and Alternatives in Language Assessment, eds A Huhta, V Kohonen, L Kurki-Suonio and S Luoma, University of Jyväskylä and University of Tampere, Jyväskylä, pp 241-256
- Henning, G, 1983, ‘Oral proficiency testing: comparative validities of interview, imitation, and completion methods’, Language Learning, vol 33, no 3, pp 315-332
- Hughes, A, 1989, Testing for language teachers, Cambridge University Press, Cambridge
- Hughes, A, 2003, Testing for language teachers: Second Edition, Cambridge University Press, Cambridge
- Iwashita, N, 1997, ‘The validity of the paired interview format in oral performance testing’, paper presented at the Language Testing Research Colloquium, Orlando, Florida
- Kormos, J, 1999, ‘Simulation conversations in oral proficiency assessment: a conversation analysis of role plays and non-scripted interviews in language exams’, Language Testing, vol 16, no 2, pp 163-188
- Kunnan, AJ, 1995, Test-taker characteristics and test performance: a structural modeling approach, UCLES/Cambridge University Press, Cambridge
- Larson-Freeman, D, and Long, MH, 1991, An introduction to second language acquisition research, Longman, London
- Lazaraton, A, 1996a, ‘Interlocutor support in oral proficiency interviews: the case of CASE, Language Testing, vol 13, no 2, pp 151-172
- Lazaraton, A, 1996b, ‘A qualitative approach to monitoring examiner conduct in the Cambridge Assessment of Spoken English (CASE)’, in Performance testing, cognition and assessment: selected papers from the Language Testing Research Colloquium, Cambridge and Arnhem, eds M Milanovic and N Saville, UCLES/Cambridge University Press, Cambridge, pp 18-33
- Linacre, JM, 2003, FACETS 3.45 computer program, MESA Press, Chicago, IL
- Lumley, T, 1998, ‘Perceptions of language-trained raters and occupational experts in a test of occupational English language proficiency’, English for Specific Purposes, vol 17, no 4, pp 347-367
- Lumley, T and O’Sullivan, B, 2000, ‘The effect of speaker and topic variables on task performance in a tape-mediated assessment of speaking’, paper presented at the Annual Asian Language Assessment Research Forum, The Hong Kong Polytechnic University
- Lumley, T and O’Sullivan, B, 2001, ‘The effect of test-taker sex, audience and topic on task performance in tape-mediated assessment of speaking’, Melbourne Papers in Language Testing, vol 9, no 1, pp 34-55
- Lumley, T and O’Sullivan, B, 2005, ‘The effect of test-taker gender, audience and topic on task performance in tape-mediated assessment of speaking’, Language Testing, vol 23, no 4, pp 415-437
- Luoma, S, 2004, Assessing Speaking, Cambridge University Press, Cambridge
- McNamara, T, 1997, ‘Interaction’ in second language performance assessment: whose performance?’ Applied Linguistics, vol 18, pp 446-466
- Mehnert, U, 1998, ‘The effects of different lengths of time for planning on second language performance’, Studies in Second Language Acquisition, vol 20, pp 83-108
- Norris, J, Brown, JD, Hudson, T and Yoshioka, J, 1998, Designing second language performance assessment, Technical Report #18, University of Hawai’i Press, Hawai’i
- O’Loughlin, K, 1995, ‘Lexical density in candidate output on direct and semi-direct versions of an oral proficiency test’, Language Testing, vol 12, no 2, pp 217-237
- O’Sullivan, B, 1995, ‘Oral language testing: does the age of the interlocutor make a difference?’ unpublished MA dissertation, University of Reading
- O’Sullivan, B, 2000a, ‘Towards a model of performance in oral language testing’, unpublished PhD dissertation, University of Reading
- O’Sullivan, B, 2000b, ‘Exploring gender and oral proficiency interview performance’, System, vol 28, no 3, pp 373-386
- O’Sullivan, B, 2002, ‘Learner acquaintanceship and oral proficiency test pair-task performance’, Language Testing, vol 19, no 3, pp 277-295
- O’Sullivan, B, and Weir, C, 2002, Research issues in testing spoken language, mimeo: internal research report commissioned by Cambridge ESOL
- O’Sullivan, B, Weir, C and ffrench, A, 2001, ‘Task difficulty in testing spoken language: a sociocognitive perspective’, paper presented at the 23rd Language Testing Research Colloquium, St Louis, Miss
- O’Sullivan, B, Weir, CJ and Saville, N, 2002, ‘Using observation checklists to validate speaking-test tasks’, Language Testing, vol 19, no 1, pp 33-56
- Ortega, L, 1999, ‘Planning and focus on form in L2 oral performance’, Studies in Second Language Acquisition, vol 20, pp 109-148
- Porter, D, 1991, ‘Affective factors in language testing’ in Language Testing in the 1990s, eds JC Alderson and B North, Modern English Publications in association with British Council, Macmillan, London, pp 32-40
- Porter, D and Shen SH, 1991, ‘Gender, status and style in the interview’, The Dolphin 21, Aarhus University Press, pp 117-128
- Purpura, J, 1998, ‘Investigating the effects of strategy use and second language test performance with high- and low-ability test-takers: a structural equation modeling approach’, Language Testing, vol 15, no 3, pp 333-379
- Robinson, P, 1995, ‘Task complexity and second language narrative discourse’, Language Learning, vol 45, no 1, pp 99-140
- Ross, S, 1992, ‘Accommodative questions in oral proficiency interviews’, Language Testing, vol 9, pp 173-186
- Ross, S and Berwick, R, 1992, ‘The discourse of accommodation in oral proficiency interviews’, Studies in Second Language Acquisition, vol 14, pp 159-176
- Shohamy, E, 1983, ‘The stability of oral language proficiency assessment on the oral interview testing procedure’, Language Learning, vol 33, pp 527-540
- Shohamy, E, 1994, ‘The validity of direct versus semi-direct oral tests’, Language Testing, vol 11, pp 99-123
- Shohamy, E, Reves, T and Bejarano, Y, 1986, ‘Introducing a new comprehensive test of oral proficiency’, ELT Journal, vol 40, no 3, pp 212-220
- Skehan, P, 1996, ‘A framework for the implementation of task based instruction’, Applied Linguistics, vol 17, pp 38-62
- Skehan, P, 1998, A cognitive approach to language learning, Oxford University Press, Oxford
- Skehan, P and Foster, P, 1997, ‘The influence of planning and post-task activities on accuracy and complexity in task-based learning’, Language Teaching Research, vol 1, no 3, pp 185-211
- Skehan, P and Foster, P, 1999, ‘The influence of task structure and processing conditions on narrative retellings’, Language Learning, vol 49, no 1, pp 93-120
- Skehan, P and Foster, P, 2001, ‘Cognition and tasks’ in Cognition and second language instruction, ed P Robinson, Cambridge University Press, Cambridge, pp 183-205
- Stansfield, CW and Kenyon, DM, 1992, ‘Research on the comparability of the oral proficiency interview and the simulated oral proficiency interview’, System, vol 20, pp 347-364
- Thompson, I, 1995, ‘A study of interrater reliability of the ACTFL oral proficiency interview in five European Languages: data from ESL, French, German, Russia, and Spanish’, Foreign Language Annals, vol 28, no 3, pp 407-422
- Underhill, N, 1987, Testing spoken language: a handbook of oral testing techniques, Cambridge University Press, Cambridge
- Upshur, JA and Turner, C, 1999, ‘Systematic effects in the rating of second-language speaking ability: test method and learner discourse’, Language Testing, vol 1, no 1, pp 82-111
- Weir, CJ, 1990, Communicative language testing, Prentice Hall International
- Weir, CJ, 1993, Understanding and developing language tests, Prentice Hall London
- Weir, CJ, 2005 Language testing and validation: an evidence-based approach, Palgrave, Oxford
- Wigglesworth, G, 1997, ‘An investigation of planning time and proficiency level on oral test discourse’, Language Testing, vol 14, no 1, pp 85-106
- Wigglesworth, G, and O’Loughlin, K, 1993, ‘An investigation into the comparability of direct and semi-direct versions of an oral interaction test in English’, Melbourne Papers in Language Testing, vol 2, no 1, pp 56-67
- Williams, J, 1992, ‘Planning, discourse marking, and the comprehensibility of international teaching assistants’, TESOL Quarterly, vol 26, pp 693-711
- Young, R, 1995, ‘Conversational styles in language proficiency interviews’, Language Learning, vol 45, no 1, pp 3-42
- Young, R, and Milanovic, M, 1992, ‘Discourse variation in oral proficiency interviews’, Studies in Second Language Acquisition, vol 14, pp 403-424
Appendix 1: Task Difficulty Checklist (Based On Skehan, 1998)
| MODERATOR VARIABLES | CONDITION | GLOSS (THE MORE DIFFICULT THE HIGHER THE NUMBER) | DIFFICULTY (CIRCLE ONE) |
|---|---|---|---|
| CODE COMPLEXITY | Range of linguistic input | Vocabulary and structure as appropriate to ALTE levels 1 - 5 (beginner to advanced) | 1 2 3 4 5 6 |
| CODE COMPLEXITY | Sources of input | Number and types of written and spoken input 1 = one single written or spoken source 5 = multiple written and spoken sources | 1 2 3 4 5 6 |
| COGNITIVE COMPLEXITY | Amount of linguistic input to be processed | Quantity of input 1 = sentence level (single question, prompts) 5 = long text (extended instructions and/or texts) | 1 2 3 4 5 6 |
| COGNITIVE COMPLEXITY | Availability of input | Extent to which information necessary for task completions is readily available to the candidate 1 = all information provided 5 = student attempts an open ended task [student provides all information] | 1 2 3 4 5 6 |
| COGNITIVE COMPLEXITY | Familiarity of information | 1 = the information given and/or required is likely to be within the candidates’ experience 5 = information given and/or required is likely to be outside the candidates’ experience | 1 2 3 4 5 6 |
| COGNITIVE COMPLEXITY | Organisation of information required | 1 = almost no organisation required 5 = extensive organisation required from a simple answer to a question to a complex response | 1 2 3 4 5 6 |
| COGNITIVE COMPLEXITY | As information becomes more abstract | 1 = concrete 5 = abstract | 1 2 3 4 5 6 |
| COMMUNICATIVE DEMAND | Time pressure | 1 = no constraints on time available to complete task (if candidate does not complete the task in the time given he/she is not penalised) 5 = serious constraints on time available to complete task (if candidate does not complete the task in the time given he/she is penalised) | 1 2 3 4 5 6 |
| COMMUNICATIVE DEMAND | Response level | 1 = more than sufficient to plan or formulate a response 5 = no planning time available | 1 2 3 4 5 6 |
| COMMUNICATIVE DEMAND | Scale | Number of participants in a task, number of relationships involved 1 = one person 5 = five or more people | 1 2 3 4 5 6 |
| COMMUNICATIVE DEMAND | Complexity of task outcome | 1 = simple unequivocal outcome 5 = complex unpredictable outcome | 1 2 3 4 5 6 |
| COMMUNICATIVE DEMAND | Referential complexity | 1 = reference to objects and activities which are visible 5 = reference to external/displaced (not in the here and now) objects and events | 1 2 3 4 5 6 |
| COMMUNICATIVE DEMAND | Stakes | 1 = a measure of attainment which is of value only to the candidate 5 = a measure of attainment which has a high external value | 1 2 3 4 5 6 |
| COMMUNICATIVE DEMAND | Degree of reciprocity required | 1 = no requirement of the candidate to initiate, continue or terminate interaction 5 = task requires each candidate to participate fully in the interaction | 1 2 3 4 5 6 |
| COMMUNICATIVE DEMAND | Structured | 1 = task is highly structured/scaffolded 5 = task is totally unstructured/unscaffolded | 1 2 3 4 5 6 |
| COMMUNICATIVE DEMAND | Opportunity for control | 1 = complete autonomy 5 = no opportunity for control | 1 2 3 4 5 6 |
Appendix 2: Readability Statistics For 9 Tasks
| Task 1 | Task 2 | Task 3 | Task 4 | Task 5 | Task 6 | Task 7 | Task 8 | Task 9 | |
|---|---|---|---|---|---|---|---|---|---|
| Counts | |||||||||
| Words | 35 | 33 | 36 | 43 | 34 | 35 | 46 | 31 | 38 |
| Characters | 153 | 142 | 150 | 162 | 169 | 169 | 185 | 146 | 151 |
| Paragraph | 1 | 1 | 1 | 1 | 1 | 1 | 1 | 1 | 1 |
| Sentences | 6 | 6 | 6 | 6 | 6 | 6 | 6 | 6 | 6 |
| Average | |||||||||
| Sentence/Paragraph | 6.0 | 6.0 | 6.0 | 6.0 | 6.0 | 6.0 | 6.0 | 6.0 | 6.0 |
| Words/Sentence | 5.8 | 5.5 | 6.0 | 7.1 | 5.6 | 5.8 | 7.6 | 5.1 | 6.3 |
| Characters/word | 4.2 | 4.0 | 3.9 | 3.6 | 4.7 | 4.6 | 3.8 | 4.5 | 3.8 |
| Readability | |||||||||
| Passive sentences | 0% | 0% | 0% | 0% | 0% | 0% | 0% | 0% | 0% |
| Flesch Reading Ease | 70.3 | 80.7 | 85.5 | 91.3 | 59.2 | 75.2 | 85.0 | 65 | 84.6 |
| Flesch-Kincaid Grade Level | 4.8 | 3.3 | 2.8 | 2.2 | 6.4 | 4.2 | 3.3 | 5.4 | 3.0 |
APPENDIX 3: THE ORIGINAL SET OF TASKS
You will have to talk about the topic for 2 minutes. You have 1 minute to think about what you are going to say.
| Tasks 1-5 | Tasks 6-9 |
|---|---|
| 1. Describe a city you have visited which has impressed you. You should say: Where it is situated Why you visited it What you liked about it And explain why you prefer it to other cities. | 6. Describe a teacher who has influenced you in your education. You should say: Where you met them What subject they taught What was special about them And explain why this person influenced you so much. |
| 2. Describe a competition (or contest) that you have entered. You should say: When the competition took place What you had to do How well you did it And explain why you entered the competition (or contest). | 7. Describe a film or a TV programme which has made a strong impression on you. You should say: What kind of film or TV programme it was, eg comedy When you saw the film or TV programme What the film or TV programme was about And explain why this film or TV programme made such an impression on you. |
| 3. Describe a part-time/holiday job that you have done. You should say: How you got the job What the job involved How long the job lasted And explain why you think you did the job well or badly. | 8. Describe a memorable event in your life. You should say: When the event took place Where the event took place What happened exactly And why this event was memorable for you. |
| 4. Describe a museum, exhibition or art gallery that you have visited. You should say: Where it is What made you decide to go there What you particularly remember about the place And explain why you would or would not recommend it to your friend. | 9. Describe something you own which is very important to you. You should say: Where you got it from How long you have had it What you use it for And explain why it is so important to you. |
| 5. Describe an enjoyable event that you experienced when you were at school. You should say: What the event was When it happened What was good about it And explain why you particularly remember this event. |
APPENDIX 4: THE FINAL SET OF TASKS
You will have to talk about the topic for 2 minutes. You have 1 minute to think about what you are going to say.
| Tasks A-D | Tasks E-H |
|---|---|
| A. Describe a city you have visited which has impressed you. You should say: Where it is situated Why you visited it What you liked about it And explain why you prefer it to other cities. | E. Describe a teacher who has influenced you in your education. You should say: Where you met them What subject they taught What was special about them And explain why this person influenced you so much. |
| B. Describe a part-time/holiday job that you have done. You should say: How you got the job What the job involved How long the job lasted And explain why you think you did the job well or badly. | F. Describe a film or a TV programme which made a strong impression on you. You should say: What kind of film or TV programme it was (eg comedy) When you saw it What it was about And explain why it made such an impression on you. |
| C. Describe a sports event that you have been to or seen on TV. You should say: What it was Why you wanted to see it What was the most exciting or boring part And explain why it was good or bad. | G. Describe a memorable event in your life. You should say: When the event took place Where the event took place What happened exactly And why this event was memorable for you. |
| D. Describe an enjoyable event that you experienced when you were at school. You should say: What the event was When it happened What was good about it And explain why you particularly remember this event. | H. Describe something you own which is very important to you. You should say: Where you got it from How long you have had it What you use it for And explain why it is so important to you. |
APPENDIX 5: SPSS ONE-WAY ANOVA OUTPUT
Multiple Comparisons
| (I) TASK | (J) TASK | Mean Difference (I-J) | Std. Error | Sig. | 95% CI Lower Bound | 95% CI Upper Bound |
|---|---|---|---|---|---|---|
| Task A | Task B | .3622 | .22786 | 1.000 | -.3591 | 1.0835 |
| Task A | Task C | -.0185 | .22570 | 1.000 | -.7330 | .6959 |
| Task A | Task D | .3824 | .22368 | 1.000 | -.3256 | 1.0905 |
| Task A | Task E | .4487 | .22786 | 1.000 | -.2726 | 1.1700 |
| Task A | Task F | .6891 | .22786 | .079 | -.0322 | 1.4104 |
| Task A | Task G | .9103* | .22786 | .003 | .1890 | 1.6315 |
| Task A | Task H | .7853* | .22786 | .019 | .0640 | 1.5065 |
| Task B | Task A | -.3622 | .22786 | 1.000 | -1.0835 | .3591 |
| Task B | Task C | -.3807 | .22786 | 1.000 | -1.1020 | .3406 |
| Task B | Task D | .0203 | .22586 | 1.000 | -.6947 | .7352 |
| Task B | Task E | .0865 | .23000 | 1.000 | -.6415 | .8146 |
| Task B | Task F | .3269 | .23000 | 1.000 | -.4011 | 1.0550 |
| Task B | Task G | .5481 | .23000 | .507 | -.1800 | 1.2761 |
| Task B | Task H | .4231 | .23000 | 1.000 | -.3050 | 1.1511 |
| Task C | Task A | .0185 | .22570 | 1.000 | -.6959 | .7330 |
| Task C | Task B | .3807 | .22786 | 1.000 | -.3406 | 1.1020 |
| Task C | Task D | .4010 | .22368 | 1.000 | -.3071 | 1.1090 |
| Task C | Task E | .4672 | .22786 | 1.000 | -.2540 | 1.1885 |
| Task C | Task F | .7076 | .22786 | .061 | -.0137 | 1.4289 |
| Task C | Task G | .9288* | .22786 | .002 | .2075 | 1.6501 |
| Task C | Task H | .8038* | .22786 | .015 | .0825 | 1.5251 |
| Task D | Task A | -.3824 | .22368 | 1.000 | -1.0905 | .3256 |
| Task D | Task B | -.0203 | .22586 | 1.000 | -.7352 | .6947 |
| Task D | Task C | -.4010 | .22368 | 1.000 | -1.1090 | .3071 |
| Task D | Task E | .0663 | .22586 | 1.000 | -.6487 | .7812 |
| Task D | Task F | .3067 | .22586 | 1.000 | -.4083 | 1.0216 |
| Task D | Task G | .5278 | .22586 | .572 | -.1871 | 1.2428 |
| Task D | Task H | .4028 | .22586 | 1.000 | -.3121 | 1.1178 |
| Task E | Task A | -.4487 | .22786 | 1.000 | -1.1700 | .2726 |
| Task E | Task B | -.0865 | .23000 | 1.000 | -.8146 | .6415 |
| Task E | Task C | -.4672 | .22786 | 1.000 | -1.1885 | .2540 |
| Task E | Task D | -.0663 | .22586 | 1.000 | -.7812 | .6487 |
| Task E | Task F | .2404 | .23000 | 1.000 | -.4877 | .9684 |
| Task E | Task G | .4615 | .23000 | 1.000 | -.2665 | 1.1896 |
| Task E | Task H | .3365 | .23000 | 1.000 | -.3915 | 1.0646 |
| Task F | Task A | -.6891 | .22786 | .079 | -1.4104 | .0322 |
| Task F | Task B | -.3269 | .23000 | 1.000 | -1.0550 | .4011 |
| Task F | Task C | -.7076 | .22786 | .061 | -1.4289 | .0137 |
| Task F | Task D | -.3067 | .22586 | 1.000 | -1.0216 | .4083 |
| Task F | Task E | -.2404 | .23000 | 1.000 | -.9684 | .4877 |
| Task F | Task G | .2212 | .23000 | 1.000 | -.5069 | .9492 |
| Task F | Task H | .0962 | .23000 | 1.000 | -.6319 | .8242 |
| Task G | Task A | -.9103* | .22786 | .003 | -1.6315 | -.1890 |
| Task G | Task B | -.5481 | .23000 | .507 | -1.2761 | .1800 |
| Task G | Task C | -.9288* | .22786 | .002 | -1.6501 | -.2075 |
| Task G | Task D | -.5278 | .22586 | .572 | -1.2428 | .1871 |
| Task G | Task E | -.4615 | .23000 | 1.000 | -1.1896 | .2665 |
| Task G | Task F | -.2212 | .23000 | 1.000 | -.9492 | .5069 |
| Task G | Task H | -.1250 | .23000 | 1.000 | -.8531 | .6031 |
| Task H | Task A | -.7853* | .22786 | .019 | -1.5065 | -.0640 |
| Task H | Task B | -.4231 | .23000 | 1.000 | -1.1511 | .3050 |
| Task H | Task C | -.8038* | .22786 | .015 | -1.5251 | -.0825 |
| Task H | Task D | -.4028 | .22586 | 1.000 | -1.1178 | .3121 |
| Task H | Task E | -.3365 | .23000 | 1.000 | -1.0646 | .3915 |
| Task H | Task F | -.0962 | .23000 | 1.000 | -.8242 | .6319 |
| Task H | Task G | .1250 | .23000 | 1.000 | -.6031 | .8531 |
APPENDIX 6: QUESTIONNAIRE ABOUT TASK 1
For each of the items below, circle the number that REFLECTS YOUR VIEWPOINT on a five point scale.
| Question | Option 1 | Option 2 | Option 3 | Option 4 | Option 5 |
|---|---|---|---|---|---|
| 1. The vocabulary in the task prompts was: | Very easy | Very difficult | |||
| 1. The vocabulary in the task prompts was: | 1 | 2 | 3 | 4 | 5 |
| 2. The grammatical structures in the task prompts were: | Very easy | Very difficult | |||
| 2. The grammatical structures in the task prompts were: | 1 | 2 | 3 | 4 | 5 |
| 3. Topic of the task was: | Very familiar | Very unfamiliar | |||
| 3. Topic of the task was: | 1 | 2 | 3 | 4 | 5 |
| 4. Information given in the task was: | Very concrete | Very abstract | |||
| 4. Information given in the task was: | 1 | 2 | 3 | 4 | 5 |
| 5. The planning time to complete (prepare for) the task was: | Too long | appropriate | Too short | ||
| 5. The planning time to complete (prepare for) the task was: | 1 | 2 | 3 | 4 | 5 |
| 6. Time to complete the task was: | Too long | appropriate | Too short | ||
| 6. Time to complete the task was: | 1 | 2 | 3 | 4 | 5 |
| 7. How much information did you use from the 4 short prompts provided in the task? | 1 = I used 100% of information provided in the task | ||||
| 7. How much information did you use from the 4 short prompts provided in the task? | 2 = I used 75% of information provided in the task | ||||
| 7. How much information did you use from the 4 short prompts provided in the task? | 3 = I used 50% of information provided in the task | ||||
| 7. How much information did you use from the 4 short prompts provided in the task? | 4 = I used 25% of information provided in the task | ||||
| 7. How much information did you use from the 4 short prompts provided in the task? | 5 = I did not use any information in the task at all | ||||
| 8. How did you use notes while you were speaking? | 1 = I read aloud my notes. | ||||
| 8. How did you use notes while you were speaking? | 2 = I referred to my notes line by line and looked up to speak. | ||||
| 8. How did you use notes while you were speaking? | 3 = I referred to my notes when I needed. | ||||
| 8. How did you use notes while you were speaking? | 4 = I prepared for my notes, but I did not use it. | ||||
| 8. How did you use notes while you were speaking? | 5 = I did not take my notes. |
Thank you very much for your cooperation.
APPENDIX 7: QUESTIONNAIRE - UNCHANGED AND REDUCED TIME VERSIONS
For students responding to the unchanged versions and to the reduced response time versions
For each of the items below, circle the number that reflects your view point on the five point scale.
What I thought of or did before I started
| Item | 1 | 2 | 3 | 4 | 5 |
|---|---|---|---|---|---|
| Scale anchor | strongly disagree | disagree | no view | agree | strongly agree |
| 1. I read the task very carefully to understand what was required. | 1 | 2 | 3 | 4 | 5 |
| 2. I thought of HOW to deliver my speech in order to respond well to the topic. | 1 | 2 | 3 | 4 | 5 |
| 3. I thought of HOW to satisfy the audiences and examiners. | 1 | 2 | 3 | 4 | 5 |
| 4. I understood the instructions for this speaking test completely. | 1 | 2 | 3 | 4 | 5 |
| 5. I had ENOUGH ideas to speak about this topic. | 1 | 2 | 3 | 4 | 5 |
| 6. I felt it was easy to produce enough ideas for the speech from memory. | 1 | 2 | 3 | 4 | 5 |
| 7. I know A LOT about this type of speech, i.e., I know how to make a speech on this type of topic. | 1 | 2 | 3 | 4 | 5 |
| 8. I know A LOT about other types of speaking test, e.g., interview, discussion. | 1 | 2 | 3 | 4 | 5 |
What I thought of or did in planning stage
| Item | 1 | 2 | 3 | 4 | 5 |
|---|---|---|---|---|---|
| Scale anchor | strongly disagree | disagree | no view | agree | strongly agree |
| 1. I thought of MOST of my ideas for the speech BEFORE planning an outline. | 1 | 2 | 3 | 4 | 5 |
| 2. During the period allowed for planning, I was conscious of the time. | 1 | 2 | 3 | 4 | 5 |
| 3. I followed the 3 short prompts provided in the task when I was planning. | 1 | 2 | 3 | 4 | 5 |
| 4. The information in the short prompts provided was necessary for me to complete the task. | 1 | 2 | 3 | 4 | 5 |
| 5. I wrote down the points I wanted to make based on the 3 short prompts provided in the task. | 1 | 2 | 3 | 4 | 5 |
| 6. I wrote down the words and expressions I needed to fulfil the task. | 1 | 2 | 3 | 4 | 5 |
| 7. I wrote down the structures I need to fulfil the task. | 1 | 2 | 3 | 4 | 5 |
| 8. I took notes only in ENGLISH. | 1 | 2 | 3 | 4 | 5 |
| 9. I took notes only in my own language. | 1 | 2 | 3 | 4 | 5 |
| 10. I took notes in both ENGLISH and own language. | 1 | 2 | 3 | 4 | 5 |
| 11. I planned an outline on paper BEFORE starting to speak. | 1. Yes | 2. No | |||
| 12. I planned an outline in my mind BEFORE starting to speak. | 1. Yes | 2. No | |||
| 13. Ideas occurring to me at the beginning tended to be COMPLETE. | 1 | 2 | 3 | 4 | 5 |
| 14. I was able to put my ideas or content in good order. | 1 | 2 | 3 | 4 | 5 |
| 15. I practiced the speech in my mind WHILE I was planning. | 1 | 2 | 3 | 4 | 5 |
| 16. After finishing my planning, I practiced what I was going to say in my mind until it was time to start. | 1 | 2 | 3 | 4 | 5 |
What I thought of or did while I was speaking
| Item | 1 | 2 | 3 | 4 | 5 |
|---|---|---|---|---|---|
| Scale anchor | strongly disagree | disagree | no view | agree | strongly agree |
| 1. I felt it was easy to put ideas in good order. | 1 | 2 | 3 | 4 | 5 |
| 2. I was able to express my ideas using suitable words. | 1 | 2 | 3 | 4 | 5 |
| 3. I was able to express my ideas using correct grammar. | 1 | 2 | 3 | 4 | 5 |
| 4. I thought of MOST of my ideas for the speech WHILE I was speaking. | 1 | 2 | 3 | 4 | 5 |
| 5. WHILE I was speaking, I did not use some ideas that I had planned. | 1 | 2 | 3 | 4 | 5 |
| 6. I was able to put sentences in logical order. | 1 | 2 | 3 | 4 | 5 |
| 7. I was able to CONNECT my ideas smoothly in the whole speech. | 1 | 2 | 3 | 4 | 5 |
| 8. I was conscious of the time WHILE I was making this speech. | 1 | 2 | 3 | 4 | 5 |
| 9. I tried to finish speaking within the time. | 1 | 2 | 3 | 4 | 5 |
| 10. I was listening and checking the correctness of the contents and their order WHILE I was making this speech. | 1 | 2 | 3 | 4 | 5 |
| 11. I was listening and checking whether the contents and their order fit the topic WHILE I was making this speech. | 1 | 2 | 3 | 4 | 5 |
| 12. I was listening and checking the correctness of sentences WHILE I was making this speech. | 1 | 2 | 3 | 4 | 5 |
| 13. I was listening and checking whether the words fit the topic WHILE I was making this speech. | 1 | 2 | 3 | 4 | 5 |
| 14. I felt it was easy to complete the task. | 1 | 2 | 3 | 4 | 5 |
| 15. Comments on the above items: |
Thank you for completing this questionnaire
APPENDIX 8: QUESTIONNAIRE - NO PLANNING VERSION
For students responding to the no planning versions
For each of the items below, circle the number that reflects your view point on the five point scale.
What I thought of or did before I started
| Item | 1 | 2 | 3 | 4 | 5 |
|---|---|---|---|---|---|
| Scale anchor | strongly disagree | disagree | no view | agree | strongly agree |
| 1. I read the task very carefully to understand what was required. | 1 | 2 | 3 | 4 | 5 |
| 2. I thought of HOW to deliver my speech in order to respond well to the topic. | 1 | 2 | 3 | 4 | 5 |
| 3. I thought of HOW to satisfy the audiences and examiners. | 1 | 2 | 3 | 4 | 5 |
| 4. I understood the instructions for this speaking test completely. | 1 | 2 | 3 | 4 | 5 |
| 5. I had ENOUGH ideas to speak about this topic. | 1 | 2 | 3 | 4 | 5 |
| 6. I felt it was easy to produce enough ideas for the speech from memory. | 1 | 2 | 3 | 4 | 5 |
| 7. I know A LOT about this type of speech, i.e., I know how to make a speech on this type of topic. | 1 | 2 | 3 | 4 | 5 |
| 8. I know A LOT about other types of speaking test, e.g., interview, discussion. | 1 | 2 | 3 | 4 | 5 |
What I thought of or did while I was speaking
| Item | 1 | 2 | 3 | 4 | 5 |
|---|---|---|---|---|---|
| Scale anchor | strongly disagree | disagree | no view | agree | strongly agree |
| 1. I felt it was easy to put ideas in good order. | 1 | 2 | 3 | 4 | 5 |
| 2. I was able to express my ideas using suitable words. | 1 | 2 | 3 | 4 | 5 |
| 3. I was able to express my ideas using correct grammar. | 1 | 2 | 3 | 4 | 5 |
| 4. I thought of MOST of my ideas for the speech WHILE I was speaking. | 1 | 2 | 3 | 4 | 5 |
| 5. WHILE I was speaking, I did not use some ideas that I had planned. | 1 | 2 | 3 | 4 | 5 |
| 6. I was able to put sentences in logical order. | 1 | 2 | 3 | 4 | 5 |
| 7. I was able to CONNECT my ideas smoothly in the whole speech. | 1 | 2 | 3 | 4 | 5 |
| 8. I was conscious of the time WHILE I was making this speech. | 1 | 2 | 3 | 4 | 5 |
| 9. I tried to finish speaking within the time. | 1 | 2 | 3 | 4 | 5 |
| 10. I was listening and checking the correctness of the contents and their order WHILE I was making this speech. | 1 | 2 | 3 | 4 | 5 |
| 11. I was listening and checking whether the contents and their order fit the topic WHILE I was making this speech. | 1 | 2 | 3 | 4 | 5 |
| 12. I was listening and checking the correctness of sentences WHILE I was making this speech. | 1 | 2 | 3 | 4 | 5 |
| 13. I was listening and checking whether the words fit the topic WHILE I was making this speech. | 1 | 2 | 3 | 4 | 5 |
| 14. I felt it was easy to complete the task. | 1 | 2 | 3 | 4 | 5 |
| 15. Comments on the above items: |
Thank you for completing this questionnaire
APPENDIX 9: QUESTIONNAIRE - UNSCAFFOLDED VERSIONS
For students responding to the unscaffolded versions
For each of the items below, circle the number that reflects your view point on the five point scale.
What I thought of or did before I started
| Item | 1 | 2 | 3 | 4 | 5 |
|---|---|---|---|---|---|
| Scale anchor | strongly disagree | disagree | no view | agree | strongly agree |
| 1. I read the task very carefully to understand what was required. | 1 | 2 | 3 | 4 | 5 |
| 2. I thought of HOW to deliver my speech in order to respond well to the topic. | 1 | 2 | 3 | 4 | 5 |
| 3. I thought of HOW to satisfy the audiences and examiners. | 1 | 2 | 3 | 4 | 5 |
| 4. I understood the instructions for this speaking test completely. | 1 | 2 | 3 | 4 | 5 |
| 5. I had ENOUGH ideas to speak about this topic. | 1 | 2 | 3 | 4 | 5 |
| 6. I felt it was easy to produce enough ideas for the speech from memory. | 1 | 2 | 3 | 4 | 5 |
| 7. I know A LOT about this type of speech, i.e., I know how to make a speech on this type of topic. | 1 | 2 | 3 | 4 | 5 |
| 8. I know A LOT about other types of speaking test, e.g., interview, discussion. | 1 | 2 | 3 | 4 | 5 |
What I thought of or did in planning stage
| Item | 1 | 2 | 3 | 4 | 5 |
|---|---|---|---|---|---|
| Scale anchor | strongly disagree | disagree | no view | agree | strongly agree |
| 1. I thought of MOST of my ideas for the speech BEFORE planning an outline. | 1 | 2 | 3 | 4 | 5 |
| 2. During the period allowed for planning, I was conscious of the time. | 1 | 2 | 3 | 4 | 5 |
| 3. I followed the 3 short prompts provided in the task when I was planning. | 1 | 2 | 3 | 4 | 5 |
| 4. The information in the short prompts provided was necessary for me to complete the task. | 1 | 2 | 3 | 4 | 5 |
| 5. I wrote down the points I wanted to make based on the 3 short prompts provided in the task. | 1 | 2 | 3 | 4 | 5 |
| 6. I wrote down the words and expressions I needed to fulfil the task. | 1 | 2 | 3 | 4 | 5 |
| 7. I wrote down the structures I need to fulfil the task. | 1 | 2 | 3 | 4 | 5 |
| 8. I took notes only in ENGLISH. | 1 | 2 | 3 | 4 | 5 |
| 9. I took notes only in my own language. | 1 | 2 | 3 | 4 | 5 |
| 10. I took notes in both ENGLISH and own language. | 1 | 2 | 3 | 4 | 5 |
| 11. I planned an outline on paper BEFORE starting to speak. | 1. Yes | 2. No | |||
| 12. I planned an outline in my mind BEFORE starting to speak. | 1. Yes | 2. No | |||
| 13. Ideas occurring to me at the beginning tended to be COMPLETE. | 1 | 2 | 3 | 4 | 5 |
| 14. I was able to put my ideas or content in good order. | 1 | 2 | 3 | 4 | 5 |
| 15. I practiced the speech in my mind WHILE I was planning. | 1 | 2 | 3 | 4 | 5 |
| 16. After finishing my planning, I practiced what I was going to say in my mind until it was time to start. | 1 | 2 | 3 | 4 | 5 |
What I thought of or did while I was speaking
| Item | 1 | 2 | 3 | 4 | 5 |
|---|---|---|---|---|---|
| Scale anchor | strongly disagree | disagree | no view | agree | strongly agree |
| 1. I felt it was easy to put ideas in good order. | 1 | 2 | 3 | 4 | 5 |
| 2. I was able to express my ideas using suitable words. | 1 | 2 | 3 | 4 | 5 |
| 3. I was able to express my ideas using correct grammar. | 1 | 2 | 3 | 4 | 5 |
| 4. I thought of MOST of my ideas for the speech WHILE I was speaking. | 1 | 2 | 3 | 4 | 5 |
| 5. WHILE I was speaking, I did not use some ideas that I had planned. | 1 | 2 | 3 | 4 | 5 |
| 6. I was able to put sentences in logical order. | 1 | 2 | 3 | 4 | 5 |
| 7. I was able to CONNECT my ideas smoothly in the whole speech. | 1 | 2 | 3 | 4 | 5 |
| 8. I was conscious of the time WHILE I was making this speech. | 1 | 2 | 3 | 4 | 5 |
| 9. I tried to finish speaking within the time. | 1 | 2 | 3 | 4 | 5 |
| 10. I was listening and checking the correctness of the contents and their order WHILE I was making this speech. | 1 | 2 | 3 | 4 | 5 |
| 11. I was listening and checking whether the contents and their order fit the topic WHILE I was making this speech. | 1 | 2 | 3 | 4 | 5 |
| 12. I was listening and checking the correctness of sentences WHILE I was making this speech. | 1 | 2 | 3 | 4 | 5 |
| 13. I was listening and checking whether the words fit the topic WHILE I was making this speech. | 1 | 2 | 3 | 4 | 5 |
| 14. I felt it was easy to complete the task. | 1 | 2 | 3 | 4 | 5 |
| 15. Comments on the above items: |
Thank you for completing this questionnaire
Author biodata
Cyril Weir
Cyril Weir has a PhD in language testing and has published widely in the fields of testing and evaluation. He is the author of Communicative Language Testing, Understanding and Developing Language Tests and Language Testing and Validation: an evidence based approach. He is the coauthor of Evaluation in ELT, An Empirical Investigation of the Componentiality of L2 Reading in English for Academic Purposes, Empirical Bases for Construct Validation: the College English Test - a case study, and Reading in a Second Language and co-editor of Continuity and Innovation: Revising the Cambridge Proficiency in English Examination 1913-2002. Cyril Weir has taught short courses, lectured and carried out consultancies in language testing, evaluation and curriculum renewal in over 50 countries worldwide. With Mike Milanovic of UCLES he is the series editor of the Studies in Language Testing series published by CUP and on the editorial board of Language Assessment Quarterly and Reading in a Foreign Language. Cyril Weir is currently Powdrill Professor in English Language Acquisition at the University of Bedfordshire, where he is also the Director of the Centre for Research in English Language Learning and Assessment (CRELLA) which was set up on his arrival in 2005.
Barry O’Sullivan
Barry O’Sullivan has a PhD in language testing, and is particularly interested in issues related to performance testing, test validation and test-data management and analysis. He has lectured for many years on various aspects of language testing, and is currently Director of the Centre for Language Assessment Research (CLARe) at Roehampton University, London. Barry’s publications have appeared in a number of international journals and he has presented his work at international conferences around the world. His book Issues in Business English Testing: the BEC revision project was published in 2006 by Cambridge University Press in the Studies in Language Testing series; and his next book is due to appear later this year. Barry is very active in language testing around the world and currently works with government ministries, universities and test developers in Europe, Asia, the Middle East and Central America. In addition to his work in the area of language testing, Barry taught in Ireland, England, Peru and Japan before taking up his current post.
Tomoko Horai
Tomoko Horai is a PhD student at Roehampton University, UK. She has an MA in Applied Linguistics and an MA in English Language Teaching, in addition to a MEd in TESOL/Applied Linguistics. She also has a number of years of teaching experience in a secondary school in Tokyo. Her current research interests are intra-task comparison and task difficulty in the testing of speaking. Her work has been presented at a number of international conferences including Language Testing Research Colloquium 2006, British Association of Applied Linguistics (BAAL) 2006, International Association of Teaching English as a Foreign Language (IATEFL) 2005 and 2006, Language Testing Forum 2005, and Japan Association of Language Teachers (JALT) 2004 and 2005.