
Cognitive processes involved in performing the IELTS Speaking Test: Respondents’ strategic behaviours in simulated testing and non-testing contexts
Official IELTS research report on IELTS Test - Speaking; Impact and Washback - Impact theory and practice, published in 2013.
Abstract
Research on second-language acquisition offers repeated findings suggesting a positive relationship between learners’ strategy use and second-language performance. From the language-testing perspective, however, the evidence that is needed to substantiate how test-takers’ strategic behaviours may interact with test performance in the speaking domain is grossly lacking, even though the strategic component has been part of the language-ability and communicative competence models that numerous researchers have put forward over the past three decades.
In this context, this project sets out to probe and describe the strategic behaviours that test-takers/learners used when performing the International English Language Testing System (IELTS) Speaking Test. Specifically, the study involved collecting stimulated verbal report data from 40 Chinese-speaking, English-as-an-additional-language students at both intermediate and advanced levels, to examine the strategic behaviours of those who perform the IELTS Speaking Test in a simulated testing situation versus those who perform it in a non-testing situation. The study was designed to analyse test-takers’/learners’ strategic behaviours, through both elicitation from stimulated recalls carried out in the participants’ first language and observation of the participants’ actual production during their performance of the three IELTS speaking tasks.
The findings provided IELTS with an empirically grounded understanding of learners’ strategies in performing the three tasks of the IELTS Speaking Test in both simulated testing and non-testing situations. The results showed that participants used 90 different individual strategies during the IELTS Speaking Test and overall, there were 2454 instances of strategy use identified in participants’ performing of the three tasks.
Of the six strategy categories, metacognitive, communication, and affective strategies had the highest percentages. Results from the mixed-model multivariate analysis of variance suggested that there were statistically significant between-subjects effects for context (i.e., simulated testing vs. non-testing), with a moderate effect size. The between-subjects effects were not statistically significant for proficiency level (i.e., intermediate vs. advanced level). Task had a significant within-subjects effect, with a large effect size, but there was a significant interaction between task and context, with a moderate effect size. The effects of the three tasks on strategy use were statistically significant with respect to the affective and communication strategy variables, with small to moderate effects.
The theorisation of strategic competence as an integral component of the construct of communicative competence, and, by extension, of strategy use needs to be carefully considered. The findings generated point to the need to conduct multifactorial experiments involving multivariate statistical analysis. The report concluded with statements about empirical and methodological implications and specific directions for future research that should involve an adequate sample size based on the power analysis, as well as an inter-disciplinary approach to gain insight into the complex nature of test-takers’/learners’ cognitive processes and strategic behaviours.
References
- Bachman, LF, 1990, Fundamental Considerations in Language Testing, Oxford University Press, Oxford, UK
- Canale, M, and Swain, M, 1980, Theoretical bases of communicative approaches to second language teaching and testing, Applied Linguistics, vol 1, pp 1-47
- Ducasse, AM, 2011, The role of interactive communication in IELTS Speaking and its relationship to candidates’ preparedness for study or training contexts, IELTS Research Reports, vol 12, pp 125-150
- Seedhouse, P, and Harris, A, 2011, Topic development in the IELTS Speaking Test, IELTS Research Reports, vol 12, pp 69-124
1 INTRODUCTION
As Cohen (2012) stated, test items and tasks must measure what they purport to measure. As such, one issue that concerns researchers and theorists in both the second-language acquisition (SLA) and language testing (LT) fields is how to best validate the constructs that underlie language tests. As researchers from both fields have pointed out, it is necessary to know the inferences that are explicitly and implicitly made based on test-takers’ performance (e.g., Bachman and Cohen, 1998, 2006; Young, 2000). Among those inferences, there is the need to understand the strategic behaviours underlying a test-taker’s performance.
As Fulcher (2003) pointed out, “Strategies are concerned with the relationship of the internal processes and knowledge base of the test-takers to the external real-time action of communicating” (p 33). Canale and Swain (1980) were the first to identify strategic competence as an integral part of communicative competence, and they defined strategic competence as: “verbal and non-verbal communication strategies that may be called into action to compensate for breakdowns in communication due to performance variables or insufficient competence” (p 30). Later, extending Canale’s (1983) and Swain’s (1985) work, Bachman (1990) expanded the notion of strategic competence and hypothesised that it underlay all language use. Bachman and Palmer (1996), in their evaluation and modification of the communicative competence model, postulated that metacognitive strategies play a central role in test-taking.
Over the past four decades, SLA research on learner strategies has demonstrated that learners’ strategy use is associated with SLA and performance (see Cohen and Macaro, 2008). From the LT perspective, however, test-takers’ strategic behaviours have not been given sufficient attention, even though they have been included in the language ability models or communicative competence models that numerous theorists in the field have proposed (e.g., Bachman, 1990, 2002; Douglas, 1997; Fulcher, 2003). Recently, Weir and O’Sullivan (2011) included cognitive validity in their model of conceptualising test validity and viewed this cognitive validity as dependent on the processes that test-takers use in responding to test items and tasks.
With this view in mind and in light of the lack of evidence from examinations of construct-relevant strategic behaviours in the speaking domain, this project set out to probe and describe the strategic behaviours that respondents use when performing the IELTS (International English Language Testing System) Speaking Test in simulated testing (here after “testing”) and non-testing situations.
Findings from the present study point to the strategies that learners used to perform each speaking task in the IELTS Speaking Test under both testing and non-testing situations. By involving both testing and non-testing situations, the study aims to contribute to the fields of SLA and LT in response to the call for a fuller picture of the oral construct with the provision of cognitive-validity evidence. This report first provides definitions of strategic behaviours and how they relate to the construct of speaking, followed by a brief review of relevant research in the literature. Then, the study’s research design and methodology are described, and key findings are presented. Before concluding, the empirical and methodological implications are presented.
2 RELATION TO THE EXISTING LITERATURE AND RESEARCH
2.1 Defining strategic behaviours
Theoretically, strategic behaviours are defined as “the conscious, goal-oriented thoughts and actions that learners use to regulate cognitive processes with the goal of improving language learning or language use” (Huang, 2010, p 246). For this study, they are defined as test-takers’ (in the testing context) or learners’ (in the non-testing context) conscious thoughts and actions that are directly related to the test-taking/task performing process and that are used to acquire or manipulate information.
Operationally, these strategic behaviours are the observable actions taken by test-takers/learners in this study, as well as their thoughts elicited by means of verbal, think-aloud reports. Strategy use can be argued to be closely linked to cognitive processes, since the term “cognitive processes,” which is taken from cognitive psychology, refers to all processes by which sensory input is transformed, reduced, elaborated, stored, recovered, and used (Neisser, 1976). Strategies are deliberate thoughts and behaviours test-takers/learners use to manage or carry out cognitive processes with the goal of successful test/task performance.
On the basis of this conceptualisation, this study examined strategic behaviours as the behaviours that test-takers/learners used to complete the three IELTS speaking tasks under testing and non-testing situations.
2.2 Strategic competence as part of the speaking construct
LT researchers have ongoing concerns about the various sources of variability that may influence performance on language tests (e.g., Bachman, 1990; Bachman and Palmer, 1996; Chalhoub-Deville 2001; McNamara, 1996; Purpura, 1999; Shaw and Weir, 2007). Even though researchers and theorists view the L2 communicative construct as multidimensional (e.g., Bachman, 1990; Bachman and Palmer, 1996; Purpura, 1998; Wesche, 1987), as pointed out by Kunnan (1998) and Douglas (2000), research has yet to support with evidence the specific components and processes underlying this multidimensional construct. It also has yet to show how these components interact with each other in language use. Among these components are the strategies that test-takers/learners use.
Learners’/speakers’ ability to use communication strategies to deal with communication breakdowns has been referred to as their strategic competence, which is a component of Canale and Swain’s (1980) widely cited theoretical framework of communicative competence. Since then, Canale (1983), Bachman (1990), Bachman and Palmer (1996), Douglas (1997) and Fulcher (2003) have all further discussed and expanded this component to include various strategic components (see Swain et al., 2009). Much systematic research has examined the construct validation of the concept of communicative competence in L2 education (e.g., Bachman and Palmer, 1996; Harley, Cummins, Swain and Allen, 1990; Jamieson et al., 2000; Milanovic et al., 1996; Palmer, Groot and Trosper, 1981; Swain, 1985; Wesche, 1981). Whether it is termed Canale and Swain’s (1980) communicative competence framework, Bachman’s (1990) and Bachman and Palmer’s (1996) communicative language ability model, or the social-cognitive construct representation (see Chalhoub-Deville, 2003), strategic competence remains critical and has been recognised as interacting with other components of communicative competence (Swain et al., 2009). Although there is a recognition that strategies and the interaction among strategies and tasks may affect performance, and that the strategies that test-takers/learners use can provide insights concerning test validity, research remains lacking about the strategic component in the speaking domain and about the precise nature of strategic competence as applied to SLA and LT contexts.
Cognitive validity relates directly to Messick’s (1989) evidence for substantive validity in assessing the theoretical assumptions about the skills and abilities that test-takers use when answering test items. The key idea is that test developers and users need to verify that test-takers actually use the assumed processes, as opposed to other, unrelated processes that introduce construct-irrelevant variance into the scores. In such a case, a speaking task performed in a testing situation may lead to different oral language production than how the task would be performed under a non-testing situation. For example, test-takers may focus more on accuracy and/or fluency than on communicating ideas. The differing
focus may lead to the deployment of different strategies to accomplish communicative goal(s).
The possibility that the context of testing may influence performance and that oral language production and strategic behaviours in a testing situation may differ from those in a non-testing situation raise a major issue about how the test assesses learners’ communicative competence, as well as the extent to which a test performance can represent the cognitive processing involved in performing similar tasks in real-world encounters. Douglas (2000) stated that validation is “a dynamic process in which many different types of evidence are gathered and presented” and through which we can begin to obtain a better understanding of what a particular test is actually testing (p 258). Chalhoub-Deville (2001) also called for language researchers and test constructors to “expand their test specifications to include the knowledge and skills that underlie the language construct” (p 225). The strategic behaviours that test-takers use when responding to assessment tasks is an important source of construct-validity evidence (e.g., Bachman, 2002; Chalhoub-Deville, 2001; McNamara, 1996), and the subject warrants ongoing, rigorous, and in-depth investigation.
2.3 Taxonomies and research on speaking strategies in the second-language acquisition (SLA) and language testing (LT) fields
Since the pioneering research of Rubin (1975) and Stern (1975), researchers have proposed various ways of classifying learner strategies (e.g., Nakatani, 2006; O’Malley and Chamot, 1990; Oxford, 1990, 2011; Rubin, 1987; Stern, 1992; Wenden and Rubin, 1987), with some overlap among the strategy categories across various taxonomies or systems of classification. Although there is some consensus in the categorisation of learner strategies, reaching a consensus regarding a unified theoretical underpinning for learner strategies remains a challenge that has generated much debate (see Cohen, 2011; Cohen and Macaro, 2008; Macaro, 2006). In the testing context, some researchers have distinguished between construct-relevant and construct-irrelevant strategies (e.g., Allan, 1992; Cohen, 2012), and some have criticised the definitional “fuzziness” of the categorisation of learner strategies and the research tools that researchers have used (e.g., Dornyei, 2005; Gao, 2007; Tseng et al., 2006). Some of the issues regarding the categorisation of strategies are, for example: strategies may be used in combination with others; a single strategy may be used for multiple purposes; different individual strategies may overlap; or different individual strategies may be subdividable into other sub-strategies (e.g., Cohen, 2007, 2012; Dornyei, 2005; Nikolov, 2006; Rose, 2012).
In terms of research, much work in the SLA field in the 1970s was devoted to descriptive studies that identified learner strategy types and frequencies (e.g., Rubin, 1975; Naiman, Fröhlich, Stern and Todesco, 1978).
Since the 1980s, the focus has shifted from a product to a process orientation. This shift in focus has generated much interest in the role of cognitive processing and the study of strategy use in SLA (e.g., Cohen, 1984; Cohen and Aphek, 1981; Homburg and Spaan, 1981; O’Malley and Chamot, 1990; Wenden and Rubin, 1987). In the 1990s, research established the role that learner strategies play in making language-learning more efficient and successful (e.g., O’Malley and Chamot, 1990; Oxford, 1990).
Studies also have shown a positive association between proficiency level and the use of certain types of strategies, especially, for example, metacognitive (e.g., Flaitz and Feyten, 1996), cognitive (e.g., Oxford and Ehrman, 1995), compensation (Dreyer and Oxford, 1996), and social-affective strategies (Nakatani, 2006). In the area of speaking, several studies have addressed how learner strategies can help learners develop their oral communication ability (e.g., Cohen and Olshtain, 1993; Cohen, Weaver and Li, 1996; Dadour, 1995).
In the language testing field, since 1970 when Bormuth first called for researchers to pay more attention to how test-takers respond to questions in first-language testing tasks, a growing number of studies have examined the strategies and processes of test-takers (e.g., Anderson, Bachman, Perkins and Cohen, 1991; Buck, 1991; Cohen, 1998; Phakiti, 2003; Purpura, 1997, 1998; Wijh, 1996; Yoshida-Morise, 1998). But little research has examined the interaction among language proficiency level, strategic behaviours, and performance in speaking with inconsistent results in terms of the relationship between proficiency level and strategy use (see Cohen, 2011; Swain et al., 2009). Until now, no studies have investigated test-takers’/learners’ strategic behaviours in performing IELTS-like speaking tasks and the relationships among language-proficiency level, reported strategic behaviours, and speaking performance in testing and non-testing contexts.
Even though learner strategy research has flourished over the past 40 years, strategy use in relation to tasks and contexts has only recently been recognised as an area that needs significant empirical evidence to move the field forward (Macaro, 2006). Research on variations in tasks and contexts, as well as their effects on language use, has supported the hypothesis that both performance and strategy use differ across tasks (e.g., Bachman and Cohen, 1998; Poulisse, 1990; Huang, 2004, 2007, 2010; Swain et al., 2009). Findings from previous research have also suggested that less-proficient L2 learners tend to use the same strategies repeatedly, whereas more-proficient L2 learners draw on a greater variety of strategies to accomplish the different language tasks at hand (see Anderson, 2005). Thus, the relative effectiveness or noneffectiveness of strategy use may be task-, context-, and learner-dependent. In other words, the nature of a strategy remains constant; it is the task demands that vary and that bring about variation in different learners’ deployment of strategies (Macaro, 2006).
In the present study, all speaking strategies used during the communicative event (i.e., for the purpose of performing the IELTS speaking tasks) were examined. Given that the study involved both testing and non-testing situations and that responding to a language measure naturally involves using strategies for different purposes (such as language learning, language use, and testing-related strategies), the analysis in this study used a strategy classification scheme based on a compilation of L2 use, learning, test-taking, and communication strategies in the theoretical and empirical literature (e.g., Cohen and Upton, 2006; Fulcher, 2003; Kæsper and Kellerman, 1997; O’Malley and Chamot, 1990, Oxford, 1990, 2011; Paribakht, 1985; Pressley and Afflerbach, 1995; Purpura, 1998; Swain et al., 2009; Yoshida-Morise, 1998; Yule and Tarone, 1997).
In this study, the analysis of test-takers’/learners’ strategic behaviours included the following six major categories:
(a) approach strategies (i.e., orienting oneself to the speaking task)
(b) communication strategies (i.e., involving conscious plans for solving a linguistic problem to reach a communication goal) (c) cognitive strategies (i.e., manipulating the target language for understanding and producing language) (d) metacognitive strategies (i.e., examining the learning process to organise, plan, and evaluate efficient ways of learning) (e) affective strategies (i.e., involving self-talk or mental control over affect) (f) social strategies (i.e., interacting with others to improve language learning/use).
This study examined both observable and reported strategic behaviours, as theoretically and operationally defined previously, in performing the IELTS speaking tasks. Strategic behaviours, encompassing the so-called “test-management strategies” (i.e., “the processes consciously selected to assist in producing [responses]” (Cohen, 2012, p 263) are also included because, while some may consider test-management strategies to be construct-irrelevant, one may also argue that such strategies as organising thoughts, monitoring time, attending to the interlocutor’s interest, and so on are reasonably related to important skills involved in a speaker’s ability to expressing opinions verbally or to engage in a dialogue, regardless of whether it is in a testing, simulated testing, or non-testing situation.
2.4 Stimulated retrospective recall as a data-gathering method
A large body of research in the area of learners’ and test-takers’ strategies has used questionnaires to elicit learners’ strategic behaviours (e.g., Phakiti, 2003; Purpura, 1999; Taguchi, 2001; Yoshizawa, 2002). It is highly questionable how faithfully strategies elicited through questionnaire items not specific to a particular research/language context reflect learners’ actual strategic behaviours in response to a task. Methodologically, to enhance the quality of the data, this study has gone beyond the common self-report or questionnaire-based methods used to gather strategy-related data.
As Macaro (2006) pointed out, “Questionnaires and inventories provide the broad picture; verbal reports (think-aloud techniques and task-based retrospectives) effectively yield insights into skill-specific or task-specific strategy use” (p 321, emphasis mine). Since the 1980s, verbal reports have been a primary research method used to gather data about learners’ or test-takers’ strategic behaviours. Among different verbal-report approaches, various types of verbal reporting (e.g., introspective, immediate retrospective and delayed retrospective) have been widely employed in L2 studies (Cohen, 1998, 2012; Ericsson and Simon, 1993; Gass and Mackey, 2000). For example, diaries or dialogue journals and verbal reports have been used extensively by L2 strategy researchers (e.g., Anderson and Vandergrift, 1996; Bowles and Leow, 2005; Carson and Longhini, 2002; Halbach, 2000; Schmidt and Frota, 1986; Phakiti, 2003).
Learners’ introspection or retrospection may not provide a complete picture of any particular process and, as thoroughly examined by researchers across disciplines, is not without criticisms (e.g., Cohen, forthcoming; Ericsson and Simon, 1993; Gass and Mackey, 2000; Green, 1998; LoCastro, 1994, Selinger, 1983, Young, 2005). However, the data gathered from verbal reports enable researchers to examine what a test is actually measuring by tapping the underlying processes that are not accessible from the product (e.g., test/oral-language production scores), nor from other sources (e.g., observations) that test-takers/learners use to solve a problem or perform a task. As Ericsson and Simon’s (1993) review of a large number of studies indicated, when the technique is used appropriately, verbal protocol analysis is a valid and useful procedure. Macaro (2006) also pointed out in his review of research on learner strategies that the methodology for eliciting learner strategy use is “at an acceptable level of validity and reliability” (p 321).
3 RESEARCH DESIGN AND METHODOLOGY
3.1 Guiding questions
This study was guided by the following inter-related research questions:
- Strategic behaviours: When participants perform the IELTS speaking tasks, what strategic behaviours do they report that they employ to regulate their cognitive processes in testing and non-testing situations?
- Strategic behaviours vis-à-vis contexts: Is there a difference in participants’ reported strategic behaviours between testing and non-testing situations?
- Strategic behaviours vis-à-vis proficiency levels: When participants perform the IELTS speaking tasks, are there differences in their reported strategy use between advanced versus intermediate participant groups in testing and non-testing situations?
- Strategic behaviours vis-à-vis task types: Are there differences in reported strategy use in performing the three IELTS speaking tasks in testing and non-testing situations?
- Strategic behaviours vis-à-vis oral language production: What are the relationships between participants’ reported and observed strategy use in testing and non-testing situations and their oral-language production scores?
3.2 Research design and participants
The study involved four groups of international English as-an-additional-language (EAL) students in British Columbia, Canada, with 10 participants in each group, for a total of 40 participants. Figure 1 shows the study’s overall design.
Subgroups A and B were international EAL students at the advanced and intermediate levels of English language proficiency, respectively; members of subgroups A and B performed the IELTS Speaking Test under a simulated testing situation. Subgroups C and D involved two groups of international EAL students at the advanced and intermediate levels, respectively; members of subgroups C and D performed the same speaking tasks in the IELTS Speaking Test in a non-testing situation.
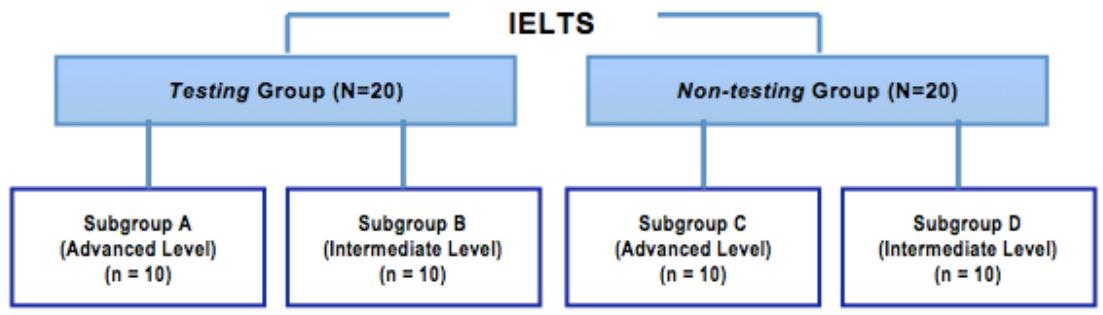
Figure 1: Research design
In the testing context, members of subgroups A and B performed the IELTS Speaking Test in a simulated testing situation; i.e., IELTS-certified examiner A followed the exact guidelines and procedures in administering the test to participants. In the non-testing context, members of subgroups C and D performed the identical speaking tasks contained in the IELTS Speaking Test in a language-learning setting; i.e., IELTS-certified examiner B, who is also the participants’ current or recent-past language teacher, was instructed to use the same tasks to practice speaking with participants.
Both the testing and non-testing groups were instructed prior to the testing and practicing session to treat the test or practice accordingly. Each participant was also reminded before the start of each of the three speaking tasks to perform the subsequent task in the way one would perform it in a formal testing situation for the testing-group or in a language-learning, practicing situation for the non-testing group. In the final think aloud session, each participant was also asked whether he/she performed the test as requested.
The sample size for this study was chosen for the following reasons: (a) to contain costs, (b) to ensure that there would not be more variables than subjects so that statistical analyses could be conducted, and (c) to obtain in-depth reports of strategy use from each participant. Furthermore, the study focused on participants whose native language is Mandarin Chinese for the following reasons: (a) to elicit as much information as possible from participants by allowing them to freely choose which language to use during the stimulated recall process so that they could best express their thoughts, (b) to limit the study to participants who speak a language of which the principal investigator has expert knowledge, (c) to enhance the strength of conclusions with the resources available, (d) to deal with the issue of the representative nature of the participants, and (e) because, historically, test-takers who speak Chinese as their first language have constituted the largest pool of international students enrolled at the university from which the sample was drawn.
They are also one of the largest groups of examinees in English-language proficiency testing in North America. Table 1 summarises the participants’ background characteristics. (With the exception of one individual, all participants were majoring in finance or business at the time of the study.)
3.3 Research instruments
3.3.1 Background questionnaire
A questionnaire was distributed to all four groups to collect information about participants’ backgrounds (e.g., age, gender, knowledge of other languages, educational experience, length of stay in English-speaking countries, and IELTS speaking test-taking experience and scores). All participants completed the questionnaire before the language proficiency pre-test. (All participants had previously taken the IELTS Speaking Test, with a range of reported IELTS scores from 5 to 6.5 and a mean of 5.8.)
3.3.2 Pre-test language proficiency
The oral proficiency of all participants was assessed prior to the start of the study by two experienced examiners who have extensive experience in in-house assessments from various language schools. The test was adapted from Swain et al.’s (2009) pre-test - the first part was modified, in that participants were required to tell a story using the pictures; the remaining parts and the time allowed for preparation and response were unchanged. The pre-test was used to recruit participants at the appropriate proficiency levels suitable for proceeding to the familiarisation test one week before the administration of the main speaking tasks. Note that the format of the pre-test simply involved the test administrators reading the instructions and questions out loud and then measuring the preparation and response time for each item; the test administrators were instructed to follow the procedures in terms of timing the responses exactly according to the test instructions.
| Characteristic | Testing group | Non-testing group | Overall |
|---|---|---|---|
| Age (years) | M = 23.5, SD = 2.26 | M = 24.2, SD = 2.69 | M = 23.9, SD = 2.48 |
| English language learning (years) | M = 10.92, SD = 1.79 | M = 10.85, SD = 3.82 | M = 10.88, SD = 2.95 |
| Length of stay in English-speaking countries (months) | M = 22.05, SD = 19.37 | M = 26.5, SD = 17.33 | M = 24.3, SD = 18.31 |
| Gender | Female: 9 (45%)Male: 11 (55%) | Female: 5 (25%)Male: 15 (75%) | Female: 14 (35%)Male: 26 (65%) |
Table 1: Participants’ characteristics (N = 40)
3.3.3 IELTS Speaking Test
Two versions of the IELTS Speaking Test were used. One version was provided to participants so that they could become familiar with the test and the task types, and the scores were also used to cross-check with the results from the pre-test and to divide the learners into the two proficiency levels for data analysis.
The intermediate group consisted of those respondents who scored 6.0 and below; the advanced group were those who scored above 6.0. This division is based on the institutional admissions requirement of an IELTS score of 6.0 and above.
The other version was used for the main study for both testing and non-testing groups. The mean scores for tests administered in sessions 1 and 2 were similar (familiarisation: M = 6.40, SD = 0.50; main: M = 6.31, SD = 0.54). By context, the scores also were similar in both situations (testing, familiarisation: M = 6.40, SD = 0.51; testing, main: M = 6.3, SD = 0.50; non-testing, familiarisation: M = 6.41, SD = 0.48; non-testing, main: M = 6.34, SD = 0.56).
The current testing time frame of 11 to 14 minutes was expanded for the administration of the test in the main study to facilitate stimulated recall immediately after each of the three speaking tasks. The task types are summarised in Table 2.
| Task | Task type | Preparation time | Testing time |
|---|---|---|---|
| 1 | Answer questions about themselves and their families | None | 3-4 min. |
| 2 | Speak about a topic | 1 min. | 2-3 min. |
| 3 | Engage in a longer discussion on the topic in Task 2 | None | 3-4 min. |
Table 2: A summary of task types in the IELTS Speaking Test
Task 1 of the IELTS Speaking Test involves asking test-takers to respond to general questions about themselves (e.g., their homes, families, jobs, studies and interests) and a range of everyday familiar topics. Task 2 involves having test-takers talk on a particular topic for one to two minutes, with one minute of preparation time. The examiner then asks one or two questions to conclude this portion of the test. Task 3 involves a discussion of more abstract issues, which are linked to Task 2, with a similar set of directive prompts or input.
3.4 Data collection procedures
Before the two major data collection sessions, when interested participants first contacted the research assistant, the purpose of the research was clarified to them, following the university’s ethical guidelines. Their IELTS test-taking experiences and scores were specifically asked in order to ensure that they met the general participant-selection criteria (i.e., Chinese-as-a-first-language and English-as-an-additional-language university-level students, with intermediate and above proficiency levels). Participants who met the preliminary selection criteria were scheduled to come to the first data collection session, where the procedures were followed as described below.
Session 1:
- Each of the 40 participants was, again, provided with a clear explanation of the purpose of the study and what they would be required to do during the two data collection sessions. They were also given an opportunity to ask any questions that might have arisen since their recruitment, as per the university’s ethical guidelines. We then asked participants to give their informed consent to participate.
- Each participant completed the background questionnaire.
- Each participant completed a 10-minute pre-test proficiency assessment.
- Participants were individually administered a version of the IELTS Speaking Test that served to familiarise them with the task types to be expected in the following week.
- Each participant tried out a stimulated recall session and engaged in a practice session of stimulated recall after his/her performance of the final speaking task. In other words, the test’s time frame was not expanded in the administration of the three speaking tasks. During the practice stimulated recall session after Task 3, the examiner recorded the scores for each participant.
During the week between data-collection sessions 1 and 2, the principal investigator trained the research assistants in refining the questions and operations carried out during the stimulated recall sessions. Also during this week, three raters independently rated the audio clips from the 10-minute language-proficiency test to determine each participant’s proficiency in spoken English. (The three raters each had graduate degrees and professional experiences in English language teaching.) The oral-language production scores derived from the familiarisation testing session were then used to corroborate results from the pre-test proficiency assessment and to divide the learners into the two proficiency levels for data analysis. During the familiarisation round, it was discovered that some participants already knew one of the certified examiners, as previously mentioned in Section 3.2. These participants were assigned to the non-testing group, and the rest were assigned to the testing group. Each participant’s schedule for the following week was arranged accordingly and then confirmed by both email and phone.
Session 2:
- The testing group, i.e., 20 participants, were formally administered another version of the IELTS Speaking Test. As with the familiarisation test administered in Session 1, the examiner followed the same script in the provision of the instructions and prompts when implementing the test to ensure a standardised management of the speaking test for test reliability and validity.
- The non-testing group, i.e., 20 participants, were administered speaking tasks identical to those in the IELTS Speaking Test administered to the testing group. The tasks, which followed the same format, were administered in a non-testing situation, as described in Section 3.2.
- All participants engaged in verbal reports through a process of stimulated recall immediately after performing each task (Bowles, 2010; Ericsson and Simon, 1993; Gass and Mackey, 2000, 2012; Green, 1998). While the participants engaged in the stimulated recall, both examiners rated and recorded each participant’s spoken performance, using IELTS’s official scoring criteria, before proceeding to the next task.
- For both groups, the entire process was video-taped by two cameras and audio-taped by a digital recorder to (a) facilitate stimulated recall, and (b) prevent any unanticipated technical glitches that might occur when technology is used. This recall was conducted in the participants’ first language immediately after performing each of the three IELTS speaking tasks so that the participants’ short-term or working memory could be quickly accessed and the contents could be reported (Ericsson and Simon, 1993; Jourdenais, 2001).
3.5 Data coding and analyses
3.5.1 Data coding
All video and audio clips were organised and renamed with numbers to safeguard participants’ identities. All 40 participants’ stimulated recall sessions, for a total of 120 clips, were fully transcribed. Meticulous care was taken in the data-coding stage of the project. Data coding of all stimulated recall sessions and oral-production data (i.e., data gathered from the participants’ actual performance during the IELTS speaking tasks) was carried out. The coding scheme of participants’ strategic behaviours was modified, as previously mentioned, drawing on the classification systems synthesised from the literature in L2 learning and LT fields. The coding scheme consists of six strategy categories, namely approach, cognitive, communication, metacognitive, affective, and social. Appendix 1 includes definitions and examples captured from the data in both Chinese and English for all strategies.
This is the first study to include the coding of the oral-production data. The principal investigator (PI) and one research assistant (RA) independently coded 100% of the data from the stimulated recall sessions, as well as 100% of the oral-production data for strategic behaviours. Unlike the data from the stimulated recall sessions, which were fully transcribed, the oral-production data were coded directly from the recordings without transcription for two main reasons: (a) there was a need to contain costs, (b) the coding of strategic behaviours involved mainly observable strategy use that was absent from the participants’ stimulated recalls, and (c) the coding was used to corroborate findings from the stimulated recall data. In other words, any observable strategic behaviours from the oral-production data that were not reported by participants during the stimulated sessions were added. Behaviours mentioned by participants in the stimulated recall sessions were double-checked and ambiguities in the reported strategies were verified. In addition, the second RA coded 60% of the data, and the third RA coded 30% of the data randomly selected from the data set. Inter-coder reliability was calculated by the number of agreements divided by the total number of coding decisions. The inter-coder agreement percentages between the PI and the three RAs were 96% for the first RA, 92% among the PI and RAs 1 and 2, and 91% among the three coders. All coding disagreements were discussed until they were resolved.
3.5.2 Sampling design matrix
For statistical analyses, a multifactorial experimenta design was implemented with N = 40 participants, including two fixed factors (context and proficiency level), producing between-subjects effects, and three repeated measures (tasks) producing between-subjects effects. The factorial design matrix was balanced because there was an equal number (i.e., n = 10) of participants in each cell (Table 3).
| Factors | Repeated measures | |||
|---|---|---|---|---|
| Context | Proficiency Level | Task 1 | Task 2 | Task 3 |
| Non-testing | Advanced | 10 | 10 | 10 |
| Non-testing | Intermediate | 10 | 10 | 10 |
| Testing | Advanced | 10 | 10 | 10 |
| Testing | Intermediate | 10 | 10 | 10 |
Table 3: Factorial design matrix
The 40 participants were divided into two mutually exclusive groups according to context, termed non-testing (n = 20) and testing (n = 20). Each context was further sub-divided into two mutually exclusive subgroups according to their proficiency level, termed advanced (n = 10) and intermediate (n =10). The multifactorial model was crossed, because each proficiency level was the same in each context, meaning that each level of context could be compared with each proficiency level.
3.5.3 Dependent and independent variables
Repeated measures on the six dependent variables (i.e., the reported and observed strategies) were collected for the performance of three IELTS speaking tasks (denoted as task 1, task 2, and task 3). All groups performed an identical set of three tasks. The independent variables were the four groups of participants, stratified by the two factors, specifically context (testing vs. non-testing) and proficiency level (intermediate vs. advanced).
The six dependent variables used to measure strategy use were the following strategies: affective, approach, cognitive, communication, metacognitive, and social. Each strategy-use score was constructed by (1) calculating a total strategy-use frequency score, by adding up the individual participants’ scores for the use of individual strategies within each strategy category; (2) computing the total individual strategy-use frequency score for each strategy category (i.e., the sum of the scores for affective, approach, cognitive, communication, metacognitive, and social) reported by each participant; (3) converting each strategy-use score into a proportion of the total strategy-use score; and (4) performing arcsine transformations of the proportions.
Arcsine transformations were needed for the parametric statistical analysis, because (1) proportions are not
continuous, but restricted in range from 0 to 1; (2) proportions are usually not normally distributed, but tend to be skewed, clustering towards one or the other end of the range; (3) the arcsine transformation stretches out the extreme proportions close to 0 and 1, and compresses the proportions close to thereby centralising the distributions; and (4) the transformed data fit better to the statistical model, providing for more precise inferences, including interactions. (The potential problem with using an arcsine transformation is that the descriptive statistics of arcsines are more difficult to interpret, because they are expressed in radians [Tabachnik and Fidell, 2007].)
3.5.4 Interaction
Because participants were exposed to multiple factors simultaneously and the level of each factor could potentially influence the level of every other factor, the interaction effects were evaluated. Each interaction reflects the effects of two or more factors acting in combination rather than alone (Hair et al., 2010). In this study, interactions implied that participants’ strategies diverged in a non-parallel fashion with respect to the different levels of each factor. The interactions tested in this study were as follows: context x level, context x task, task x level, and context x level x task. Specifically, the following null hypotheses were tested:
H 1: There were no between-subjects effects (i.e., the mean scores for the dependent variables were not significantly different among the four mutually exclusive groups of participants with respect to context and proficiency level) : There were no within-subjects effects (i.e., the mean scores for the dependent variables were not significantly different across the three tasks performed consecutively by all participants) H 3: There were no significant interactions among context, task, and proficiency level.
3.5.5 Mixed model multivariate analysis of variance (MANOVA)
The null hypotheses were tested to compare the mean arcsine-transformed scores reported by the four groups of participants for six types of strategy use (i.e., affective, approach, cognitive, communication, metacognitive, and social) in testing and non-testing contexts. A mixed model multivariate analysis of variance (MANOVA) with multiple dependent variables, fixed effects, and repeated measures, was justified to answer the research questions. MANOVA tests for the effects of one or more factors (categorical independent variables) on multiple dependent variables (measured at the scale/interval level). MANOVA creates a new composite dependent variable from a linear combination of multiple inter-correlated dependent variables, , for six dependent variables, and the new composite dependent variable, The coefficients a to a are calibrated to provide maximal differences between with respect to the effects of the specified factors.
The advantage of using MANOVA is that differences between mean values may not be identified when the dependent variables are tested individually, but MANOVA may reveal differences using a linear combination of dependent variables. In addition, MANOVA protects against Type I errors that may occur when multiple hypothesis tests are conducted (i.e., the null hypothesis of no significant difference is falsely rejected when, in fact, it should not be rejected). The probability of making a Type I error is 1 - (1-α) k where α = the significance level and k = the number of tests performed (Hair et al., 2010). For example, if six tests are conducted to compare six dependent variables across participant groups in this study at the conventional significance level of α = .05, then the probability of making a Type I error is .265 (i.e., about one in every four tests might provide erroneous results by random chance). Before MANOVA could be conducted, diagnostic tests were implemented to determine whether the data violated any of its theoretical assumptions.
Significance. Statistical significance was evaluated by comparing the p values of the inferential test statistics against a prescribed significance level (α = .05). Note that the p values reflected statistical significance (i.e., whether or not the findings were caused by random chance), and did not necessarily imply that the results were important or had any meaningful implications in reality. Statistical significance is not equivalent to practical significance (i.e., the strengths of the relationships between the variables). Effect sizes were computed because they reflected the practical significance of the results. It is recognised that many researchers in education and psychology argue that the use of p values should be reconsidered, or at least reduced in importance, in favour of effect sizes (Ferguson, 2009; Hill and Thompson, 2004; Kotrlik and Williams, 2003; Kline, 2004; Kraemer et al., 2003). The advantage of effect sizes is that, unlike p values, they are not a function of the sample size. The effect size used in this study was eta squared (η²), representing the proportion of the variance explained. Applying Ferguson’s (2009) criteria, η² = .04 indicated a minimal effect; η² = .25 indicated a moderate effect; and η² = .64 indicated a strong effect.
Sample size. In MANOVA, like all inferential statistical tests, the p values of the test statistics are a function of the sample size. If the sample size is too small, there is insufficient power to reject a null hypothesis, and a Type II error could occur (i.e., the null hypothesis is
falsely not rejected when, in fact, it should be rejected) According to Hair et al. (2010, p 453) with respect to MANOVA, “As a bare minimum, the sample size in each cell (group) must be greater than the number of dependent variables. As a practical guide, a recommended minimum cell size is 20 observations” (p 453, emphasis mine). The sample size in each group in this study (n = 10) was greater than the number of dependent variables (k = 6); however, the size was half of the recommended minimum cell size of 20, which could potentially provide insufficient power for MANOVA.
Normality. Each dependent variable, theoretically, should be normally distributed; MANOVA is robust, however, meaning that multivariate statistics are not necessarily compromised by deviations from normality. As long as the factorial design is balanced (Table 3), and deviations from normality are caused by skewness and not outliers, MANOVA is relatively insensitive to the shape of the frequency distribution (Hair et al., 2010). Deviations from normality were identified in this study using Kolmogorov-Smirnov (K-S) statistics (see Table 4). Only one variable (social strategies) deviated strongly from normality at α = .001 (K-S = 2.763, p < .001).
The distributions of the six dependent variables after combining the frequency counts for the participant groups are displayed in Figure 2. The distribution of social strategies was skewed. Although the distributions of approach, communication, cognitive, metacognitive, and affective strategies were not perfectly normal, compared to theoretical bell-shaped normal probability distributions, they were sufficiently close to normality to justify the use of parametric statistics.
Outliers. Outliers (i.e., extremely large or small values, reflecting unusual cases that are not representative of the sample) cause more bias in parametric statistics than departures from normality. Because the computational formulae of MANOVA are based upon sums of squares, outliers may distort inferences (Hair et al., 2010; Huberty and Olejnik, 2006). Univariate outliers were identified in this study by computing the Z scores (i.e., the number of standard deviations each dependent variable was away from its corresponding mean value). No outliers, with Z scores outside the expected normal limits of ± 3.3 (Tabachnik and Fidell, 2007) were identified in approach, communication, metacognitive, and affective (see Table 5).
| Kolmogorov-Smirnov test | Variables | |||||
|---|---|---|---|---|---|---|
| Kolmogorov-Smirnov test | Affective | Approach | Cognitive | Communication | Metacognitive | Social |
| n | 120 | 120 | 120 | 120 | 120 | 120 |
| K-S | 1.486 | 1.375 | 1.850 | .802 | .493 | 2.763 |
| p | .024 | .046 | .002 | .541 | 968 | <.001* |
Note: * Significant deviation from normality at α = .001
Table 4: Tests for normality of six dependent variables

Figure 2: Frequency distribution histograms of the dependent variables
Note: APP = approach; COM = communication; COG = cognitive; METACOG = metacognitive; SOC = social; AFF = affective
The cognitive strategy variable, with a maximum Z score of 3.312, which is just at the margin of the limits, was considered acceptable to conduct MANOVA, and, as such, it was included in the analysis. (Note that slight deviations from normality with respect to ANOVA should have no effect on the results; in other words, the statistical inferences remain robust in the face of such a slight deviation from normality [refer to Hair et al. 2010]).
Previous simulation studies using various non-normal distributions have indicated that “the false positive rate is not affected very much by the violation of the assumption” (McDonald, 2009, pp 150-154).) One clear positive outlier with a Z score of 4.156 was found, however, in social, indicating that the social strategy variable should be excluded from the analysis.
| Variable | Minimum Z score | Maximum Z score |
|---|---|---|
| Affective | -1.248 | 2.290 |
| Approach | -1.238 | 3.291 |
| Cognitive | -1.121 | 3.312 |
| Communication | -2.048 | 3.271 |
| Metacognitive | -2.721 | 2.374 |
| Social | -.667 | 4.156 |
Table 5: Test results for outliers
Inter-correlation between dependent variables. The multiple dependent variables in a MANOVA model, in theory, should be multi-collinear (i.e., inter-correlated with each other). A matrix plot (Figure 3) fitted with linear (simple linear regression) trend lines depicts the linear relationships between the six variables (affective, approach, cognitive, communication, metacognitive and social). Seven significant (p < .05) Pearson’s correlation coefficients (r = -.169 to r = -.617) confirmed that the variables justifiably could be combined for the purposes of MANOVA (see Table 6).

Note: AFF = affective; APP = approach; COG = cognitive; COM = communication; METACOG = metacognitive; SOC = social
Figure 3: Matrix plot between six dependent variables
| Variable | Affective | Approach | Cognitive | Communication | Metacognitive | Social |
|---|---|---|---|---|---|---|
| Affective | 1 | |||||
| Approach | -.115 | 1 | ||||
| Cognitive | .063 | 1 | ||||
| Communication | -.088 | 1 | ||||
| Metacognitive | -.108 | -.064 | 1 | |||
| Social | -.036 | -.126 | .023 | 1 |
Note: Significant at
Table 6: Matrix of correlation coefficients between six dependent variables (N = 40)
Sphericity. The repeated measures of each dependent variable in MANOVA, theoretically, should not depart from sphericity; that is, the variances of the differences between the repeated measures (i.e., the three tasks) should be homogeneous. Departures from sphericity were tested using Mauchly’s test (see Table 7) at α = .001. None of the dependent variables departed from sphericity, apart from the social strategy variable (Mauchly’s W = .625, p < .001), indicating that the social strategy variable should be excluded from the MANOVA model.
| Including the social strategy variable | Excluding the social strategy variable | |||||
|---|---|---|---|---|---|---|
| Variable | Mauchly’s W | df | p | Mauchly’s W | df | p |
| Affective | .951 | 2 | .413 | .962 | 2 | .497 |
| Approach | .764 | 2 | .009 | .765 | 2 | .008 |
| Cognitive | .776 | 2 | .012 | .843 | 2 | .046 |
| Communication | .946 | 2 | .379 | .959 | 2 | .472 |
| Metacognitive | .971 | 2 | .596 | .972 | 2 | .601 |
| Social | .227 | 2 | <.001* |
Note: * Significant at α = .001
Table 7: Test for sphericity of within-subject effects
Homogeneity of variance. The variances of each dependent variable in MANOVA theoretically should be homogeneous (i.e., variances are equal) across the groups, identified using Levene’s test. Only one measure, cognitive (task 1), marginally violated the assumption of homogeneity of variance at α = .05, indicated by p = .046 for the Levene’s F statistic (Table 8).
| Variable | Levene’s F | df1 | df2 | p |
|---|---|---|---|---|
| Affective (Task 1) | 2.175 | 3 | 36 | .108 |
| Affective (Task 2) | 1.835 | 3 | 36 | .158 |
| Affective (Task 3) | .709 | 3 | 36 | .553 |
| Approach (Task 1) | .355 | 3 | 36 | .786 |
| Approach (Task 2) | 1.902 | 3 | 36 | .147 |
| Approach (Task 3) | .537 | 3 | 36 | .660 |
| Cognitive (Task 1) | 2.948 | 3 | 36 | .046* |
| Cognitive (Task 2) | 1.968 | 3 | 36 | .136 |
| Cognitive (Task 3) | .208 | 3 | 36 | .890 |
| Communication (Task 1) | .005 | 3 | 36 | 1.000 |
| Communication (Task 2) | .215 | 3 | 36 | .885 |
| Communication (Task 3) | .617 | 3 | 36 | .609 |
| Metacognitive (Task 1) | 1.006 | 3 | 36 | .401 |
| Metacognitive (Task 2) | 1.395 | 3 | 36 | .260 |
| Metacognitive (Task 3) | .434 | 3 | 36 | .730 |
| Social (Task 1) | .833 | 3 | 36 | .485a |
| Social (Task 2) | .722 | 3 | 36 | .546a |
| Social (Task 3) | 2.783 | 3 | 36 | .055a |
Note: * Statistically significant at α = .05. a Social strategy variable was included in Levene’s test, but not in MANOVA.
Table 8: Levene’s test for homogeneity of variance (N = 40)
4 RESULTS
This section first reports the descriptive statistics for guiding question 1 (Section 4.1), followed by the results from the mixed model MANOVA to address the remaining guiding questions (Section 4.2). It is important to note that the questions are addressed in multivariate terms, i.e., under the premise that all variables operated and interacted simultaneously, in combination, and not separately.
4.1 Strategic behaviours
The frequencies of the individual strategies that participants used were analysed by strategy category. Overall, participants used 90 different individual strategies across all tasks (see Table 9). The total number of instances of individual strategies across all tasks and participants was 2454.
| Individual strategy | Total | M | Range | SD | % in relation to strategy category | % in relation to total number of strategy used |
|---|---|---|---|---|---|---|
| Approach | ||||||
| Developing reasons | 105 | 2.62 | 8 | 2.059 | 48.61% | 4.28% |
| Generating choices | 9 | .23 | 1 | .423 | 4.17% | 0.37% |
| Generating ideas | 66 | 1.65 | 7 | 1.442 | 30.56% | 2.69% |
| Identifying task format | 4 | .10 | 2 | .379 | 1.85% | 0.16% |
| Identifying task purpose | 10 | .25 | 3 | .588 | 4.63% | 0.41% |
| Making choices | 8 | .20 | 1 | .405 | 3.70% | 0.33% |
| Recalling questions | 9 | .23 | 3 | .577 | 4.17% | 0.37% |
| Recalling what one has said | 5 | .13 | 2 | .404 | 2.31% | 0.20% |
| Communication | ||||||
| Abandoning | 9 | .23 | 2 | .480 | 1.26% | 0.37% |
| Approximating | 12 | .30 | 2 | .516 | 1.68% | 0.49% |
| Avoiding | 9 | .22 | 2 | .480 | 1.26% | 0.37% |
| Borrowing | 5 | .13 | 1 | .335 | 0.70% | 0.20% |
| Code-switching | 2 | .05 | 1 | .221 | 0.28% | 0.08% |
| Coining words | 2 | .05 | 2 | .316 | 0.28% | 0.08% |
| Elaborating to clarify meaning | 42 | 1.05 | 4 | 1.037 | 5.87% | 1.71% |
| Elaborating to fill time | 29 | .72 | 2 | .679 | 4.06% | 1.18% |
| Elaborating to meet requirements | 25 | .63 | 2 | .740 | 3.50% | 1.02% |
| Guessing | 5 | .13 | 1 | .335 | 0.70% | 0.20% |
| Linking | 240 | 6.00 | 9 | 1.867 | 33.57% | 9.78% |
| Paraphrasing | 36 | .90 | 4 | 1.057 | 5.03% | 1.47% |
| Pausing to formulate speech | 43 | 1.08 | 4 | 1.228 | 6.01% | 1.75% |
| Pausing to generate ideas/solutions | 50 | 1.2 | 5 | 1.324 | 6.99% | 2.04% |
| Pausing to make choices | 5 | .13 | 1 | .335 | 0.70% | 0.20% |
| Referring to notes | 10 | .25 | 1 | .439 | 1.40% | 0.41% |
| Referring to questions | 7 | .18 | 1 | .385 | 0.98% | 0.29% |
| Repeating | 10 | .25 | 2 | .494 | 1.40% | 0.41% |
| Restarting | 68 | 1.7 | 8 | 1.964 | 9.51% | 2.77% |
| Reviewing notes | 1 | .02 | 1 | .158 | 0.14% | 0.04% |
| Simplifying | 16 | .15 | 2 | .427 | 2.24% | 0.65% |
| Slowing down | 7 | .18 | 2 | .446 | 0.98% | 0.29% |
| Spelling out to clarify meaning | 1 | .02 | 1 | .158 | 0.14% | 0.04% |
| Spelling to ensure comprehension | 1 | .02 | 1 | .158 | 0.14% | 0.04% |
| Stalling to fill time | 25 | .32 | 1 | .423 | 3.50% | 1.02% |
| Thinking ahead | 2 | .05 | 1 | .221 | 0.28% | 0.08% |
| Using keywords | 3 | .08 | 1 | .267 | 0.42% | 0.12% |
| Using L1 | 48 | 1.18 | 3 | 1.059 | 6.71% | 1.96% |
| Using L2 to organise thoughts | 2 | .05 | 1 | .221 | 0.28% | 0.08% |
| Cognitive | ||||||
| Analysing linguistic choices | 2 | .05 | 1 | .221 | 1.02% | 0.08% |
| Analysing questions | 8 | .20 | 1 | .405 | 4.08% | 0.33% |
| Anticipating examiner’s feedback | 3 | .08 | 1 | .267 | 1.53% | 0.12% |
| Anticipating problems | 3 | .08 | 1 | .267 | 1.53% | 0.12% |
| Anticipating questions | 4 | .10 | 1 | .304 | 2.55% | 0.20% |
| Anticipating rating criteria | 4 | .10 | 1 | .304 | 2.04% | 0.16% |
| Attending to oral production | 7 | .18 | 2 | .446 | 3.57% | 0.29% |
| Attending to task requirements | 17 | .22 | 2 | .446 | 8.67% | 0.70% |
| Using imagination | 5 | .13 | 1 | .335 | 2.55% | 0.20% |
| Inferring | 6 | .15 | 2 | .427 | 3.06% | 0.24% |
| Memorising | 2 | .05 | 1 | .221 | 1.02% | 0.08% |
| Organising thoughts | 50 | 1.25 | 4 | 1.080 | 25.51% | 2.04% |
| Outlining | 4 | .10 | 2 | .379 | 2.04% | 0.16% |
| Recalling vocabulary | 1 | .03 | 1 | .158 | 0.51% | 0.04% |
| Recalling what one has written | 3 | .08 | 1 | .267 | 1.53% | 0.12% |
| Translating | 39 | .98 | 3 | .974 | 19.90% | 1.59% |
| Using intuition | 3 | .03 | 1 | .158 | 1.53% | 0.12% |
| Using mechanical means | 34 | .85 | 3 | .700 | 17.35% | 1.39% |
| Individual strategy | Total | M | Range | SD | % in relation to strategy category | % in relation to total number of strategy used |
|---|---|---|---|---|---|---|
| Metacognitive | ||||||
| Evaluating language skills | 25 | .63 | 3 | .807 | 2.69% | 1.02% |
| Evaluating language production | 79 | 1.98 | 5 | 1.387 | 8.50% | 3.22% |
| Evaluating mental process | 9 | .23 | 2 | .530 | 0.97% | 0.37% |
| Evaluating performance | 168 | 4.2 | 10 | 2.151 | 18.08% | 6.85% |
| Evaluating strategies | 7 | .18 | 1 | .385 | 0.75% | 0.29% |
| Evaluating task | 100 | 2.5 | 5 | 1.377 | 10.76% | 4.07% |
| Evaluating what one has heard | 81 | 2.03 | 5 | 1.330 | 8.72% | 3.30% |
| Evaluating affect | 54 | 1.35 | 4 | 1.210 | 5.81% | 2.20% |
| Generating goals | 8 | .20 | 3 | .608 | 0.86% | 0.33% |
| Generating future solutions | 17 | .43 | 4 | .813 | 1.83% | 0.69% |
| Generating future strategies | 50 | 1.25 | 10 | 1.765 | 5.38% | 2.04% |
| Setting goals | 122 | 3.05 | 15 | 2.819 | 13.13% | 4.97% |
| Identifying problems | 49 | 1.22 | 6 | 1.423 | 5.27% | 2.00% |
| Monitoring examiner’s/teacher’s feedback | 10 | .18 | 2 | .501 | 1.07% | 0.41% |
| Monitoring time | 14 | .35 | 2 | .580 | 1.51% | 0.57% |
| Planning | 33 | .83 | 2 | .844 | 3.55% | 1.34% |
| Self-monitoring | 28 | .70 | 3 | .911 | 3.01% | 1.14% |
| Self-correcting | 75 | 1.87 | 7 | 1.800 | 8.07% | 3.06% |
| Social | ||||||
| Asking examiner questions to direct conversation | 1 | .02 | 1 | .158 | 0.85% | 0.04% |
| Asking examiner questions to engage the examiner | 2 | .05 | 1 | .221 | 1.71% | 0.08% |
| Attending to the listener’s interest | 7 | .28 | 2 | .446 | 5.98% | 0.29% |
| Create a positive impression | 2 | .05 | 1 | .221 | 1.71% | 0.08% |
| Using examiner’s feedback in one’s response | 8 | .20 | 1 | .405 | 6.84% | 0.33% |
| Seeking clarification | 88 | 2.20 | 7 | 1.728 | 75.21% | 3.59% |
| Seeking examiner’s feedback | 6 | .15 | 1 | .362 | 5.13% | 0.24% |
| Seeking help | 1 | .02 | 1 | .158 | 0.85% | 0.04% |
| Seeking social interaction | 2 | .05 | 1 | .221 | 1.71% | 0.08% |
| Affective | ||||||
| Asking questions to lower anxiety | 1 | .02 | 1 | .158 | 0.36% | 0.04% |
| Fearing judgement | 1 | .02 | 1 | .158 | 0.36% | 0.04% |
| Justifying affective state | 31 | .78 | 6 | 1.459 | 11.03% | 1.26% |
| Justifying performance | 163 | 4.08 | 9 | 2.411 | 58.01% | 6.64% |
| Lowering anxiety | 51 | 1.28 | 5 | 1.198 | 18.15% | 2.08% |
| Monitoring affective state | 14 | 0.35 | 3 | .736 | 4.98% | 0.57% |
| Overriding affective challenges | 9 | 0.23 | 3 | .620 | 3.20% | 0.37% |
| Engaging in positive self-talk | 12 | 0.28 | 2 | .599 | 3.91% | 0.45% |
Table 9: Frequencies and percentages of strategy use for all three tasks combined (N = 40 for all strategies)
As Table 9 shows, the individual strategy with the highest percentage in each category were developing reasons (approach; 48.6%), linking (communication; 33.6%), organising thoughts (cognitive; 25.5%), evaluating performance (metacognitive; 18.1%), seeking clarification (social; 75.2%), and justifying performance (affective; 58%). Overall, the top-10 individual strategies were as follows.
- Communication: Linking to prior experiences/knowledge (9.78%)
- Metacognitive: Evaluating performance (6.85%)
- Affective: Justifying performance (6.64%)
- Metacognitive: Setting goals (4.97%)
- Approach: Developing reasons (4.28%)
- Metacognitive: Evaluating tasks (4.07%)
- Social: Seeking clarification (3.59%)
- Metacognitive: Evaluating what one has heard (3.30%)
- Metacognitive: Evaluating language production (3.22%)
- Metacognitive: Self-correcting (3.06%)
Among the above individual strategies, six were in the metacognitive strategy category and one each was in the categories of communication, affective, approach, and social. Overall, the metacognitive strategy category represents 37.86% of all individual strategy used, followed by communication (29.14%), affective (11.45%), approach (8.80%), cognitive (7.99%), and social (4.77%).
Results from examining the relationships among the strategy categories, as shown in Table 6 above, indicated that the only significant relationships were negative and occurred in seven cases with different degrees of magnitude: the affective category was significantly
negatively correlated with cognitive (r = -.366, p < .05), communication , and metacognitiv (r = -.169, p < .05); and the approach category was significantly negatively correlated with communication , as were cognitive and social (r = -.352, p < .05), communication and metacognitive (r = -.617, p < .05), and metacognitive and social categories (r = -.350, p < .05). These negative and significant correlations suggest that, for example, participants who reported more affective strategies tended to report fewer cognitive, communication, and metacognitive strategies, and vice versa. Participants who reported more approach strategies tended to report fewer communication strategies, and vice versa. The same tendency applied to the relative use between cognitive and social, between communication and metacognitive, and between metacognitive and social strategies.
The descriptive statistics computed for the arcsinetransformed strategy-use scores, stratified by context, level, and task, are presented in Appendix 2a. Figure 4 below is a clustered and stacked bar chart to visualise and compare the means.
As with the results from the raw frequency counts, the arcsine-transformed means also indicated that the highest overall mean scores representing the highest proportional strategy use across the three tasks and two factors were for metacognitive (M = .383, SD = .140), followed by communication (M = .322, SD = .132). Lower mean scores were recorded for affective (M = .102, SD = .081), approach (M = .085, SD = .069), and cognitive (M = .077, SD = .069). The lowest mean scores, representing the least-proportional strategy use, was for social (M = .052, SD = .079). (The descriptive statistics for non-arcsine-transformed strategy-use scores, stratified by context, level, and task, are also presented in Appendix 2b.)

Note: AFF = affective; APP = approach; COM = communication; COG = cognitive; METACOG = metacognitive; SOC = social; A = advanced; I = intermediate; L = non-testing; T = testing Figure 4: Comparison of mean (arcsine-transformed) scores for the use of strategies
4.2 Multivariate effects
Based on the results from the diagnostic tests described in Section 3.5.5, apart from the social strategy variable, data for the participants’ reported and observed strategy use did not strongly violate the theoretical assumptions of MANOVA. Elimination of outliers and transformation using √X or log (X+1) did not normalise the social strategy variable, because of the low frequency of usage. The effects of task, context, and performance level on a linear combination of the five dependent variables (excluding the social strategy variable) with interaction effects was therefore determined using MANOVA. (Interaction reflects the effects of two or more factors acting in combination rather than alone. Significant interaction implied that participants’ strategies diverged in a non-parallel fashion with respect to the different levels of each factor.)
The general linear model procedure with repeated measures option was selected in SPSS, using the methods described by Field (2009) to compute the multivariate MANOVA statistics (Wilks’ λ, Hotelling’s T-Square, Pillai’s trace and Roy’s largest root and F) for the between-subjects effects (i.e., across the two contexts and two proficiency levels) and the within-subjects effects (i.e., across the three tasks). (Note that Wilks’ λ was interpreted in this study, because it is the most commonly used MANOVA statistic and is generally applied when
there are more than two groups. Hotelling’s trace is used only to compare two groups. Pillai’s trace is the most conservative, whereas Roy’s largest root is the least conservative MANOVA statistic [refer to Huberty and Olejnik, 2006].) Interaction terms were included only if they were significant at α = .05. The results are presente in Table 10.
The decision rule was to reject the null hypothesis of no significant between-subjects or within-subjects effect if p < .05 for Wilks’ λ. Using this decision rule, the results showed that the between-subjects effects were statistically significant for context (Wilks’ λ (10, 33) = .645, p = .010), with a moderate effect size (η² = .355). The between-subjects effects were not statistically significant for level (Wilks’ λ (10, 33) = .970, p = .958), with a negligible effect size (η² = .030). Task had a significant within-subjects effect (Wilks’ λ (10, 28) = .156, p < .001), with a large effect size (η² = .844). There was, however, a significant interaction between task and context (Wilks’ λ (10, 28) = .449, p = .005), with a moderate effect size (η² = .551).
4.2.1 Between-subjects effects
The null hypothesis of no significant between-subjects effects was not rejected, indicated by p > .05 for the F statistic (Table 11). The between-subjects effects were, however, confounded by the interaction of task x context.
| Effect | Wilk’sλ | Hypothesis | Error | p | η² | |
|---|---|---|---|---|---|---|
| Between-subjects | Context | .645 | 5 | 33 | .010* | .355 |
| Between-subjects | Level | .970 | 5 | 33 | .958 | .030 |
| Within-subjects | Task | .156 | 10 | 28 | <.001* | .844 |
| Within-subjects | Task x Context | .449 | 10 | 28 | .005* | .551 |
Note: * Significant at α = .05
Table 10: Multivariate statistics
| Source | Measure | df | F | p | |
|---|---|---|---|---|---|
| Context | Affective | 1 | .100 | .754 | .003 |
| Context | Approach | 1 | .601 | .443 | .016 |
| Context | Cognitive | 1 | 1.201 | .280 | .031 |
| Context | Communication | 1 | .061 | .807 | .002 |
| Context | Metacognitive | 1 | .095 | .760 | .003 |
| Level | Affective | 1 | .469 | .498 | .013 |
| Level | Approach | 1 | .278 | .601 | .007 |
| Level | Cognitive | 1 | .001 | .976 | .000 |
| Level | Communication | 1 | .030 | .862 | .001 |
| Level | Metacognitive | 1 | .455 | .504 | .012 |
Note: * Significant at α = .05
Table 11: Between-subjects effects
4.2.2 Within-subjects effects
The null hypothesis of no significant within-subjects effects was tested assuming a linear model (Table 12). The effects of the three tasks on reported strategy use were statistically significant with respect to affective, communication and metacognitive variables, indicated by p < .05 for the F statistics, with small to moderate effects sizes (η² = .128, .413, and .459, respectively). The main effects were confounded by significant interactions at α = .05 of task x context with respect to affective and communication variables.
Overall, these results indicated that (a) a linear combination of the scores for strategy use differed significantly between the testing and non-testing contexts, but not between the intermediate and advanced proficiency levels; (b) a linear combination of the scores varied significantly across the three tasks; and (c) there was an interaction between task and context. (Note: A preliminary analysis using untransformed raw frequency counts indicated no significant interactions, so that the interaction terms could be excluded from the model. A significant task x context interaction was found using the arcsine-transformed data, however; therefore, the interaction terms were included in the within-subjects and between-subjects effects.)
The task x context interactions between the mean strategy use scores for affective, approach, cognitive, communication, and metacognitive are displayed using interaction plots in Figure 5 on the following page. The interactions were disordinal, i.e., the two lines representing the change in the mean values of the testing group and the non-testing group across the three tasks were not parallel, but tended to cross each other. The mean scores did not change systematically (e.g., increase, decrease, or stay the same) across task 1, task 2, and task 3 for each category of strategy use. The significant interaction for the affective variable was reflected by an increase in scores between task 2 and task 3 for the non-testing group, which was not paralleled by the testing
group. The significant interaction for the communication variable was reflected by a significant decline in the scores among tasks 1, 2, and 3 in the testing group, which was not paralleled by the non-testing group.
Statistically, the testing and the non-testing groups’ usage of strategies across the three tasks were not parallel. Figure 5 further illustrates that task 1 tended to elicit lo use of cognitive and metacognitive strategies, but higher usage of affective and communication strategies for members of the testing group. Task 2 is generally associated with a higher usage of approach, cognitive, and metacognitive strategies, with both groups exhibiting similar usage in the cognitive and metacognitive strategies. Task 3 tended to be associated with a lower usage of communication and cognitive strategies for both groups, and with a higher usage of approach and metacognitive strategies for the testing group and affective strategies for the non-testing group.
Table 13 provides a list of the top-five individua strategies that had the highest mean for each task. The strategies unique to each task in each context are highlighted in bold. In terms of the top-five individual strategies, the strategies that participants used to perform the three tasks in the testing and non-testing contexts are similar. Linking (communication strategy) and evaluating performance (metacognitive strategy) are two common top-five individual strategies that the participants used in both testing and non-testing contexts to perform all three tasks. The use of restarting to ensure and demonstrate correctness of utterances is unique to the testing situation. Also noted is the fact that none of these individual strategies belong to so-called non-construct-related, test wiseness strategies, which test developers aim to avoid (Cohen, 2012). As also pointed out by Cohen (forthcoming), “[T]est-wiseness strategies are best applied to the former two types of items [i.e., listening and reading tasks] and not to the latter [i.e., speaking and writing tasks].”
| Source | Measure | df | F | p | |
|---|---|---|---|---|---|
| Task | Affective | 1 | 5.445 | .025* | .128 |
| Task | Approach | 1 | 2.399 | .130 | .061 |
| Task | Cognitive | 1 | 1.430 | .239 | .037 |
| Task | Communication | 1 | 26.028 | <.001* | .413 |
| Task | Metacognitive | 1 | 31.436 | <.001* | .459 |
| Task x Context | Affective | 1 | 4.688 | .037* | .112 |
| Task x Context | Approach | 1 | 2.743 | .106 | .069 |
| Task x Context | Cognitive | 1 | .861 | .359 | .023 |
| Task x Context | Communication | 1 | 6.668 | .014* | .153 |
| Task x Context | Metacognitive | 1 | 2.628 | .114 | .066 |
Note: * Significant at α = .05
Table 12: Within-subjects effects

Figure 5: Interaction plots
| Task | Individual strategies Non-testing | Individual strategies Testing | Individual strategies Overall |
|---|---|---|---|
| 1 | Seeking clarification (Soc) Linking (Com) Evaluating performance (Meta) Justifying performance (Aff) Evaluating task (Meta) | Linking (Com) Evaluating performance (Meta) Restarting (Com) Seek clarification (Soc) Justifying performance (Aff) | Linking (Com) Evaluating performance (Meta) Justifying performance (Aff) Setting goal (Meta) Developing reasons (App) |
| 2 | Linking (Com) Evaluating performance (Meta) Organising thoughts (Cog) Justifying performance (Aff) Setting goal (Meta) | Evaluating task (Meta) Linking (Com) Justifying performance (Aff) Setting goal (Meta) Developing reasons (App) | Linking (Com) Seeking clarification (Soc) Evaluating performance (Meta) Justifying performance (Aff) Evaluating task (Meta) |
| 3 | Justifying performance (Aff) Evaluating performance (Meta) Linking (Com) Evaluating task (Meta) Setting goal (Meta) | Evaluating performance (Meta) Setting goal (Meta) Linking (Com) Developing reasons (App) Evaluating task (Meta) | Evaluating performance (Meta) Justifying performance (Aff) Linking (Com) Setting goal (Meta) Evaluating task (Meta) |
Note: AFF = affective; APP = approach; COG = cognitive; COM = communication; METACOG = metacognitive; SOC = social; A = advanced; I = intermediate.
Table 13: Top-five individual strategies by task
5 SUMMARY AND DISCUSSIONS
5.1 Summary of results
This section first presents a summary of the finding according to each of the guiding research questions presented in Section 3.1. It is important to stress that the questions were addressed using multivariate analyses, as previously demonstrated, and, although the questions are presented separately in this section for readability, the guiding questions are inter-connected and related, and thus individual questions should not be considered as separate entities. Following the summary, the study’s empirical and methodological implications are discussed.
Strategic behaviours: When participants perform the IELTS speaking tasks, what strategic behaviours do they report that they employ to regulate their cognitive processes in testing and non-testing situations?
Participants reported that they used all six strategies (approach, cognitive, communication, metacognitive, affective, and social) in both testing and non-testing contexts. Social strategies was the least-used strategy type, skewing the frequency distribution to the right and causing a strong deviation from normality; therefore, it was excluded from subsequent parametric statistical analysis. The scores for the other five strategies were found to be normally distributed, based on a conservative .001 level of significance for the Kolmogorov-Smirnov test, and no outliers were identified. These scores for strategy use did not strongly violate the assumptions of MANOVA.
Overall, participants used 90 different individual strategies across all tasks (see Table 9). The metacognitive strategy category represents 37.86% of all individual strategies used, followed by communication (29.14%), affective (11.45%), approach (8.80%), cognitive (7.99%), and social (4.77%). Similar to findings generated from previous studies examining test-takers’ strategic behaviours in performing speaking tasks (e.g., Swain et al., 2009), metacognitive and communication strategies were the top two strategy categories, with similar usage in proportion to the participants’ total strategy use. Whereas affective strategies have been among the least-reported strategies in the SLA literature (Huang, 2012; Oxford, 2011), in this study, these strategies were the third-most frequently used. Cognitive strategies, which, along with communication and metacognitive strategies have been prominent in previous research in both SLA and LT fields, as described in Section 2.3, were used less frequently by participants performing IELTS speaking tasks. The use of social strategies is unique to the present study because of the nature of the tasks involved in the first and third IELTS speaking tasks. Within each strategy category, the most frequently used individual strategies are similar to the ones identified in the previous study, with the exception that the social strategy is unique to the present study. In line with the results from
the overall usage of the six categories of strategies, among the top-10 individual strategies used by the participants, there was a similar use of metacognitive strategies in setting goals and evaluating performance and oral production and communication strategy in linking to previous experiences/knowledge in order respond.
Strategic behaviours vis-à-vis contexts: Is there a difference in participants’ reported strategic behaviours between testing and non-testing situations?
The MANOVA null hypothesis that there was no significant difference between the participants’ reported strategy use in a testing situation compared with a non-testing situation was rejected. This means that the testing and non-testing groups used significantly different strategies. Because disordinal interactions were identified (i.e., the two lines representing the change in the mean values of the testing group and the non-testing group across the three tasks were not parallel), the main effects of context on strategy use could not be easily interpreted, because the effects of context depended on the task. This important finding underscores the reality that simple associations between strategy use and second-language performance commonly suggested in the literature largely ignore the complex nature of the interrelationships among variables. This complexity warrants further empirical investigation because it has serious implications for test validity.
Strategic behaviours vis-à-vis proficiency levels: When participants perform the IELTS speaking tasks, are there differences in their reported strategy use between advanced vs. intermediate participant groups in testing and non-testing situations?
The MANOVA null hypothesis that there was no significant difference between the participants’ reported strategy use at an advanced proficiency level compared to that at an intermediate proficiency level was not rejected. This means that the strategies reported by the participants at the two proficiency levels did not differ significantly. This finding supports previous studies indicating that strategy use may not be related to language performance in the testing context in a simplistic, direct way (e.g., Purpura, 1999; Swain et al., 2009) and is also in line with growing evidence in the language-learning context that disputes the commonly-held perception derived from early good-language-learners studies that more efficient learners use more strategies or that the more strategies a learner can employ the better. What matters for individual learners, rather, is successfully managing a repertoire of strategies that work in various contexts in response to specific tasks. It is important to note, however, that absence of statistical significance is not evidence for absence (Alderson, 2004). It is possible that the finding of no significant difference could be the result of an accident in sampling that may have happened because the sample was not large enough to achieve sufficient power.
Strategic behaviours vis-à-vis tasks: Are there differences in reported strategy use in performing the three IELTS speaking tasks in testing and non-testing situations?
The MANOVA null hypothesis that there was no significant difference between the participants’ reported strategy use across three tasks was rejected. This means that the mean strategy-use scores reported by participants for the use of the five strategies tended to fluctuate up and down between task 1 and task 3, explaining why there were significant within-subjects effects in the MANOVA model. Significant disordinal interactions were found between task and context with respect to the affective and communication strategies. This is an important finding, because when interactions between factors are statistically significant, then the results of a mixed-model MANOVA are difficult to interpret, because the interactions confound the description and interpretation of the main (between-subjects and withinsubjects) effects associated with each factor (Hair et al., 2010). Given the type and nature of the IELTS speaking tasks, which involve both monologues and dialogues across the three tasks, it is understandable that affective and communication strategies stood out because they can be used differently across tasks between the two contexts. More importantly, the finding indicates that further research is needed to examine test-takers’/learners’ patterns of strategy use for the same and different tasks on multiple occasions.
Strategy use vis-à-vis oral production: What are the relationships between participants’ reported and observed strategy use in testing and non-testing situations and their oral-language production scores?
The results showed that, overall, there was no difference in participants’ oral-language production, as measured by their IELTS speaking scores between the testing (M = 6.35, SD = 0.51) and non-testing (M = 6.37, SD = 0.55) groups. Results from the repeated measures ANOVA also showed that there was no significant difference between the scores for the two sets of ratings (p = .213) and there was no interaction (p = .933). Excluding the interaction also resulted in the value of p = .207 (refer to Appendix 3 for the results of the repeated-measures ANOVA on rater scores).
It is important to point out again that this guiding research question was addressed in the preceding research questions through the examination of whether there were meaningful multivariate relationships among a set of variables. A simple bivariate correlation matrix, which was the basis for how this guiding question was originally phrased following how research questions have been predominantly phrased in the field, tends to be full of errors (e.g., Baron and Kenny, 1986; Edwards and Lambert, 2007). (Note: the results generated in the study from the correlational analyses between strategy use [by category and by individual strategies] and oral-language production scores by proficiency level and context showed that all the p values were greater than .05.) The simple bivariate correlation matrix was judged as inappropriate to evaluate the relationships between the strategy use mediated and/or moderated by the key variables (i.e., context, proficiency, and task) for two main reasons.
First, a correlation matrix suffers from Type I errors caused by random chance, leading to meaningless conclusions about the relationships between variables. If one constructs a 5 x 5 matrix, containing 25 correlation coefficients, then the chance of making a Type I error (i.e., declaring a statistically significant correlation at α = .05, when there is, in fact, no significant relationship) is 1 - (1-.05)25 = .722; that is, nearly 3 out of 4 of the correlations will be statistically significant because of random chance, and not because there is a meaningfu relationship between or among the variables (Duffy, 2010).
Second, many of the bivariate correlations between two variables in a correlation matrix are the result of partial correlation, otherwise known as spurious correlation (e.g., Haig, 2003). Spurious correlation between two variables occurs if they are jointly correlated with a third variable, known as a controlling or mediating variable. If the effects of the third variable are controlled/removed, then there is no correlation between the first two variables. Alternatively, the third variable may not be a controlling variable, but a mediating variable (i.e., it alters the strength and/or direction of the correlation between the first two variables).
5.2 Empirical implications
The examination of learners’ strategic behaviours and their strategy use in relation to context, proficiency, and task may have the following empirical implications:
-
Learners’ strategic behaviours are phenomena that are clearly present in learners’ speaking performance, as elicited through their stimulated recalls and observed in their oral-production data. The ways in which the use of those strategies interacts with multi-faceted individual (e.g., proficiency levels), task (e.g., task types), and contextual (e.g., the situation in which learners perform the task) variables point to the need for a re-evaluation of the theoretical basis and the limitations of methods used to study learners’ strategic behaviours in the literature. The crucial next step forward is to draw insights from the mode of cognition in cognitive psychology and of the hierarchical brain structure in neuroscience to propose a theoretical framework that maps behavioural, psychological, and neural processes (e.g., Flavell, 1979; Nelson and Naren, 1990; Shallice and Burgess, 1996; Shimamura, 2008).
-
Evidence relevant to the test’s cognitive validity, as indicated by the results regarding participants’ strategic behaviours elicited under testing and non-testing situations, is compelling and merits further investigation. With the exception of social
strategies, overall, members of the non-testing group generally used fewer strategies across the five strategy categories than members of the testing group (Appendices 2a and 2b). The betweensubjects effects also were statistically significant for context (Table 10).
This preliminary finding underscores the key focus of this study in understanding whether the IELTS Speaking Test elicits behaviours not normally engaged in by learners in non-testing situations. One may argue that, although all participants from the testing group were asked and reminded to perform the speaking tasks as if their admission to a university depended on their scores rated by the certified IELTS examiner and all participants from the non-testing group were instructed to perform the tasks as if they were practicing them with an instructor in a normal classroom learning situation, the fact that testing-group members’ performance had no real consequence for them, and that practicing the IELTS speaking tasks with the instructor, who is also an IELTS-certified examiner, might have triggered test-taking-like feelings or behaviours for the non-testing group, might have generated different speaking scores and/or elicited different strategic behaviours than those that would have occurred in each context in real life. One could also argue, however, that it is simply not possible to gather test-takers’/learners’ strategic behaviours while implementing both conditions in a “real” testing or learning situation, and, that to the greatest extent possible, both conditions were implemented to maximise the simulation of the respective conditions. Since this is the first study to examine learners’ strategic behaviours in simulated testing and non-testing contexts, further research is needed to verify these findings that have important implications in the development and validation of the IELTS Speaking Test.
-
The evidence for strategic competence as a component interacting with other components of communicative competence was not empirically substantiated by the results, which indicated that participants at intermediate and advanced proficiency levels, as measured by their orallanguage production scores, did not differ significantly in their use of strategies to perform the IELTS speaking tasks. This finding is congruent with findings from previous research, although in a different high-stakes standardised testing context (Swain et al., 2009), which calls into question the strategic component of the communicative competence framework put forward and modified by numerous researchers over the past four decades; there is still a lack of empirical evidence that substantiates its conceptualisation.
-
The examination of participants’ strategic behaviours in performing the three speaking tasks suggested that there are both similarities and differences in the patterns and frequency of strategy use. The findings suggest that different contexts and tasks may trigger the deployment of different strategies. The picture of how the use of strategies is task dependent is a complex one, however, as evidenced by the significant interactions found between task and context. In addition to whether the context is testing or non-testing, other factors need to be considered to understand the finding in the present study concerning whether strategy use is task-specific, for example: (a) learning might have occurred, as a stimulated-recall session was implemented after each task and the tasks were administered in the same order to all participants based on the structure of the test, and counterbalancing the task order among the participant groups was not possible; and (b) learners’ preference for using certain types of strategies may be manifested in the similarity of the types of strategy use across the tasks (e.g., Table 13). This study provides a clear indication that further research is needed to map out strategies against tasks in order to develop “a parsimonious framework” that can be applied to different contexts (Macaro, 2006, p 329). One way to accomplish this may involve having learners perform the same task on multiple occasions for all three tasks to ascertain the sequence, clusters, and quality/effectiveness of strategy use in performing particular task types.
-
This study is in line with the call by Cohen (forthcoming) for test constructors to be aware of what strategic behaviours a test item or task involves through the collection of verbal report data. The findings from the study clearly suggest that learners’ strategy use is an important variable that comes into play in learners’ test performance and that strategies are applicable to both testing and non-testing contexts. The findings that participants reported using a variety of strategies and that their strategy use differed significantly by task imply that learners’ strategic behaviours are integral to performing IELTS speaking tasks, and, as such, the need to validate strategic behaviours as part of the construct of communicative performance is a valid concern. The evidence from this study does not point to respondents’ use of test-wiseness strategies. An important step forward in determining whether a certain strategy is considered construct irrelevant in order to identify potential sources of invalidity in the measurements may not be as straightforward and simplistic as how the categorisation of testing-taking strategies, especially in the reading and speaking domains, is put forward in the literature. How the use of specific types of strategies can substantiate claims about the validity of inferences made based on the IELTS performance needs to be crosschecked with task designers’ intent concerning the natural or desirable use of certain strategies in order to inform test-construction choices that can best assess the respondents’ underlying speaking competence.
5.3 Methodological implications
In methodological terms, this study is the first to examine learners’ strategic behaviours in both testing and non-testing contexts that points to further work in the oral construct with the provision of cognitive validity evidence. Several methodological implications that may provide the breakthroughs needed to validate the language ability models or communicative competence models within which strategic competence “plays … a central role” in communicating (Douglas, 1997, p 6), which, as pointed out previously, theorists in the field have proposed and recognised (e.g., Bachman, 1990; Bachman and Palmer, 1996; Canale and Swain, 1980; Chapelle and Douglas, 1993; Chapelle, Grabe and Berns, 1997; Douglas, 1997; Fulcher, 2003; Swain, 1985), must be considered.
- Common criticisms and counter-arguments surrounding such issues as reactivity (e.g., in this case, the potential effects of drawing participants’ attention to the cognitive processes underlying the tasks they engage in), individual participants’ verbal reporting abilities (i.e., concerning the abilities participants use to verbalise their thought processes), and validity (i.e., whether the data accurately reflect learners’ behaviours) have been extensively discussed in the literature (see e.g., Bowles, 2010; Ericsson and Simon, 1993; Young, 2005). With regard to the first issue, although the respondents may be more critically engaged in or consciously aware of the process of performing a speaking task due to the stimulated recall, one may argue that the respondents “are still not capable of producing anything outside the scope of their current knowledge and abilities” (Young, 2005, p 24), which are what the test is designed to assess: the underlying competency. As for the second issue, no claim has ever been made that a complete picture of respondents’ strategies behaviours can be obtained through the procedure regardless of their verbal reporting abilities. Measures were taken in this study, such as giving respondents the time needed to verbalise and the option to verbalise in whatever language comes naturally to them or that is most comfortable to them during the stimulated recall sessions. There is also the general consensus among researchers that a greater understanding of participants’ thought processes and behaviours can be obtained through their verbalisation than through relying on researchers’ observations alone when the participants work in silence.
For the issue of validity, unlike all work that has been conducted during the past four decades, this is the first study to examine learners’ strategic behaviours from both post-task stimulated recall data and learners’ oral production data that has moved beyond the collection of learners’ strategic behaviours based on survey instruments, retrospective reflections, or stimulated recalls alone. This more thorough way to examine learners’ strategic behaviours may have contributed findings that seem to differ from previous findings (e.g., Paribakht, 1985; Phatiki, 2003; Purpura, 1997, 1998; Nakatani, 2006). Construct validation is not a one-shot effort. Further replication is warranted to see whether the present study’s results can be validated.
If further studies do not support how learners’ strategic behaviours may differ according to proficiency levels this lack of support will have important implications about the strategic component of the construct of oral communicative competence, which, thus far, researchers have not been able to substantiate through empirical evidence.
-
Along the line of methods used to elicit strategic behaviours, the use of rigorous stimulated recall sessions carried out immediately after each task is, as Macaro (2006) stated in his critical review of research on strategies for language learning and language use, a methodology for eliciting learner strategy use “at an acceptable level of validity and reliability” and can “effectively yield insights into skill-specific or task-specific strategy use” (p 321). This statement may have to be reconsidered, however. Although the stimulated-recall sessions were carried out in the language that participants felt most comfortable using (all 40 of them mainly used their first language, Chinese) to minimise possible interferences in the participants’ thought/cognitive processes, advancements in neuroscience methodology, such as functional magnetic resonance imaging (fMRI), to study metacognitive ability, as well as the most cutting-edge studies in psychology and neuroscience to understand the neural substrates supporting cognitive performance in memory, perception, and decision making, have suggested that metacognitive accuracy is dissociable from task performance and may vary among individuals (e.g., Fleming, Weil, Nagy, Dolan and Rees, 2010; Fleming and Dolan, 2012; Fleming, Huijgen and Dolan, 2012) or not be congruent with self-reports (e.g., Falk, Berkman and Lieberman, 2012). The field of learner strategic behaviours has come to a critical juncture, and to move the field forward, interdisciplinary research must be pursued. The methods used to study learners’ cognitive processes must incorporate data gathered from other sources to provide a fuller picture of learners’ strategic behaviours and (re-)evaluate the validity of the research methods and the findings that have been generated during the past four decades. Such advances are likely to contribute to exciting developments and new perspectives in this crucial line of LT research.
-
Studies that attempt to examine learners’ task-specific strategic behaviours that are elicited through nonquestionnaire-based methods in relation to multiple key variables must reconsider the statistical procedures used to address research questions. In real-world circumstances, no variable operates in isolation. Even when performing a series of experiments with just one dependent variable and one independent variable in each study, given what is now known about the multi-faceted nature of contextual, instructor-related, and learner variables, asking univariate research questions and conducting multiple univariate inferential tests (e.g., t-test or univariate ANOVA) to address each of the research questions that are inter-related need to be reassessed for several reasons: (a) there is a highly elevated chance of making Type I errors (i.e., the more univariate inferential tests that researchers perform, the more chance there is
that a statistically significant result will be generated by random chance); and (b) interactions using univariate statistics cannot be properly identified. Interactions are very important when the dependent variables (e.g., strategy use) are presumably influenced by multiple factors (e.g., context, proficiency level, and task). Presenting the results for each of the guiding research question assumes that each variable is a completely separate entity, which contradicts the reality of how variables operate in the real world. The dependent variables (strategy use) are inter-correlated with each other. The effects of each level of each factor (context, proficiency, and task) may interact with each other. This is particularly relevant in studies that attempt to validate a test’s cognitive validity.
-
Because the statistical inferences of MANOVA might be compromised by the small sample size, future studies that involve a larger number of participants are urgently needed. A power analysis was performed using G*Power 3 software (Faul et al., 2007) to predict the absolute minimum total sample size. The input parameters were a moderate effect size (f(V) = .25 (i.e., 25% of the variance in the dependent variable is explained); α = .05 (i.e., a 5% chance of a Type I error); power = .8 (i.e., a 20% chance of a Type II error), four groups of participants, and 18 measurements (i.e., six dependent variables x three repeated measures). The output (Figure 6) predicted that the total sample size should be 175; the implication is that a minimum of 45 in each group is needed to achieve sufficient power to test the null hypotheses of MANOVA.
-
Insufficient power because of a small sample size did not warrant the computation of correlation coefficients or performing the complex analysis of moderation and mediation used in social-psychological research (e.g., Fairchild and MacKinnon, 2009) in order to explain the pathway by which variables are related (Rose, Holmbeck, Coakley and Franks, 2004). To correctly calculate a moderate Pearson correlation coefficient of .5 (assuming a null hypothesis of zero correlation), the sample size should be 29 (Figure 7). To correctly calculate a smaller correlation coefficient of .25, the sample size should be increased to 97.
Conducting a large-scale study is further warranted because the claim that studies with small sample sizes can produce reliable, significant outcomes has been recently challenged in other fields. Specifically, results generated in individual studies that subsequently produced significant effects in meta-analyses failed to reach significance in definitive large studies. These results point to the unreliability of conclusions in metaanalyses in which small numbers of non-significant studies are pooled to produce significant results (see e.g., Rerkasem and Rothwell, 2010)

Figure 6: Results of the power analysis

Figure 7: Results of power analysis for correlational analysis (correlation coefficient of .5)
Finally, to enhance the scientific contribution of learner strategies, mediational and/or moderational research in social psychology, which has never been used in either the SLA or LT field, must be employed to examine complex relationships among the key variables that have significant implications for construct validity explored in the present study. The use of those statistical techniques “can lead to deeper and more comprehensive knowledge about relationships by providing information about the conditions under which the two variables will be associated (moderation) and also about the intervening processes that help to explain the association (mediation)” (Rose et al., 2004, p 66), and “mediational modals are causal models that illustrate a [developmental] pathway of influence among variables” (ibid). Evidence of causal links between strategy use and proficiency in the speaking domain is seriously lacking and mediational and/or moderational research may hold the key to a fuller evaluation of the validity of strategic competence in the construct of speaking.
6 CONCLUSION
The research reported here was motivated by a lack of evidence about the strategic component of the speaking construct in the LT context. Since the theoretical proposition of the strategic component in the model of communicative competence in the 1980s and various researchers’ recognition of it (demonstrated by the inclusion of different versions of the strategic component in various language ability models), the picture that has emerged from the body of research on learners’ strategic behaviours in language-learning or language-use contexts is less than clear and conclusive. This study responded to researchers’ call (e.g., Cohen, forthcoming, 2012; Macaro, 2006) to look into the interactions among the various key factors, such as respondents’ proficiency levels, strategy use by task, method of data collection, and how these factors relate to speaking performance.
This study is the first in the field to examine learners’ strategic behaviours through elicitation from stimulated recalls carried out in the participants’ first language and corroborated with participants’ actual oral production during their performance of the three speaking tasks in the IELTS Speaking Test in testing and non-testing situations. The study went beyond frequency counts and simple analysis of variance and bivariate correlational analysis to capture complicated interactions among various key variables. This study suggests that strategy use differed significantly between testing and non-testing contexts and that the three IELTS speaking tasks elicited significantly different use of strategies in the two contexts. In terms of the relationship between strategy use and speaking performance outcomes, as measured by the oral-language production scores derived from participants’ performance on the IELTS speaking tasks, the study’s findings did not seem to match findings from previous studies using questionnaires, although not in the speaking domain, of the difference in strategy use between more proficient learners and less proficient learners (e.g., Phakiti, 2003; Taguchi, 2001; Tian, 2000; Yoshizawa, 2002), but seemed to be in line with the findings from Swain et al. (2009) about the use of strategies elicited through stimulated recalls between learners with different proficiency levels on another high-stakes standardised speaking test and from previous studies suggesting that effective learners use strategies appropriate to tasks (see Macaro, 2006).
In terms of learners’ strategic behaviours in testing and non-testing contexts, as Davies (2008) stated, the IELTS Test was developed to assess a respondent’s English proficiency in relation to his/her ability to participate successfully in English communication. The results, as set out in this report, which probe the cognitive validity issue of the IELTS Speaking Test about whether the test triggers a different set of strategic behaviours than that of non-testing situations, brought the field to a critical point for a large-scale study to rigorously study learners’ overt and subconscious strategic behaviours in all its complexity. Bachman and Palmer (1996) once pointed out that whether strategic competence was included in the construct definition for a specific test depended on whether “the test developer had wanted to measure not only language knowledge but also the test takers’ flexibility in adapting their language use to different situations” (p 120). In actuality, flexibility is needed in language use in the “real-world,” because language use is never static. For a test to reflect authentic language use, for the test takers’ performance to be evaluated “according to real-world criterion elements” (e.g., processes and outcomes), and for a test score to be reflective of the inferences to be made about an underlying ability, then the question about the extent to which findings from research on learners’ strategic behaviours contribute to making language tests more valid must be taken very seriously.
As Westen and Rosenthal (2003) stated, “construct validation is not only continuous (a matter of degree, not a categorical distinction between valid and invalid) but continual (a perpetual, self-refining process)” (p 609). The study provided some clear directions as to what the next steps should be in establishing the cognitive validity of the IELTS Speaking Test. How the key factors (i.e., proficiency level, context, and task) explored in the study interact with each other and with test performance is an area that can be addressed methodologically and innovatively in ways that contribute to the test’s validity and substantially move the field forward.
ACKNOWLEDGEMENTS
I wish to express my deep gratitude to IELTS Australia, the British Council and Cambridge English Language Assessment for supporting this project; to numerous undergraduate and graduate students who assisted in recruiting participants, conducting stimulated recalls transcribing and coding data, with special acknowledgement to Jill Fu, who conducted all the video-stimulated recall sessions and Xiaoqian Guo, who coded all of the stimulated recall and oral production data with me; to the two IELTS examiners involved in the study; to Jenny Osborne and Bethany Marett for the key roles they played in guiding, supporting, and facilitating the project; to the two anonymous reviewers who provided valuable feedback; and, finally, to all the students who participated diligently throughout the research.
References
- Alderson, P, 2004, ‘Absence of evidence is not evidence of absence’, British Medical Journal, vol 328, no 7438, pp 476-477
- Allan, A, 1992, ‘Development and validation of a scale to measure test-wiseness in EFL/ESL reading test-takers’, Language Testing, vol 9, no 2, pp 101-122
- Anderson, N, 2005, ‘L2 learning strategies’, in Handbook of research in second language teaching and learning, ed E Hinkel, Lawrence Erlbaum Associates, Mahwah, NJ, pp 757-771
- Anderson, N, Bachman, LF, Perkins, K and Cohen, A, 1991, ‘An exploratory study into the construct validity of a reading comprehension test: Triangulation of data sources’, Language Testing, vol 8, no 1, pp 41-66
- Anderson, NJ and Vandergrift, L, 1996, ‘Increasing metacognitive awareness by using think-aloud protocols and other verbal report formats’ in Language learning around strategies around the world: Cross cultural perspectives, ed R Oxford, Second Language Teaching and Curriculum Center, University of Hawai’I, Honolulu, pp 3-18
- Bachman, L F, 1990, Fundamental considerations in language testing, Oxford University Press, Oxford, UK
- Bachman, LF, 2002, ‘Some reflections on task-based language performance assessment’, Language Testing, vol 19, no 4, pp 453-476
- Bachman LF and Cohen, AD, eds, 1998, Interfaces between second language acquisition and language testing research, Cambridge University Press, Cambridge, UK
- Bachman, LF and Palmer, AS, 1996, Language testing in practice, Oxford University Press, Oxford, UK
- Baron, RM and Kenny, DA, 1986, ‘The moderatormediator variable distinction in social psychological research: Conceptual, strategic, and statistical considerations’, Journal of Personality and Social Psychology, vol 51, pp 1173-1182
- Bowles, MA, 2010, The think-aloud controversy in second language research. Routledge, Abingdon, UK
- Bowles, MA and Leow, RP, 2005, ‘Reactivity and type of verbal report in SLA research methodology: Expanding the scope of investigation’, Studies in Second Language Acquisition, vol 27, pp 415-440
- Buck, G, 1991, ‘The testing of listening comprehension: An introspective study’, Language Testing, vol 8, pp 67-91
- Canale, M, 1983, ‘On some dimensions of language proficiency’, in Issues in language testing research’, ed JW Oller, Jr, Newbury House, Rowley, MA, pp 333-342
- Canale, M and Swain, M, 1980, ‘Theoretical bases of communicative approaches to second language teaching and testing’, Applied Linguistics, vol 1, pp 1-47
- Carson, J and Longhini, A, 2002, ‘Focusing on learning styles and strategies: A diary study in an immersion setting’, Language Learning, vol 52, pp 401-438
- Chalhoub-Deville, M, 2001, ‘Task-based assessments: Characteristics and validity evidence’ in Researching pedagogic tasks: Second language learning, teaching and testing, eds M Bygate, P Skehan and M Swain, Longman, Harlow, UK, pp 210-228
- Chalhoub-Deville, M, 2003, ‘Second language interaction: Current perspectives and future trends’, Language Testing, vol 20, pp 369-383
- Chapelle, C and Douglas, D, 1993, ‘Interpreting L2 performance data’, paper presented at the Second Language Research Colloquium, Pittsburgh, PA
- Chapelle, C, Grabe, W and Berns, M, 1997, Communicative language proficiency: Definition and implications for TOEFL 2000 (TOEFL Monograph Series. Rep. No. 10), Educational Testing Service, Princeton, NJ
- Cohen, AD, 1984, ‘On taking language tests: What the students report’, Language Testing, vol 1, no 1, pp 70-81
- Cohen, AD, 1998, Strategies in learning and using a second language, Longman, London, UK
- Cohen, AD, 2006, ‘The coming age of research on test-taking strategies’, Language Assessment Quarterly, vol 3, no 4, pp 307-331
- Cohen, AD, 2007, ‘Coming to terms with language learner strategies: surveying the experts’ in Language learner strategies: 30 years of research and practice, eds AD Cohen and E Macaro, Oxford University Press, Oxford, UK
- Cohen, AD, 2011, ‘L2 learner strategies’ in Handbook of research in second language teaching and learning, ed E Hankel, Routledge, Abingdon, UK, pp 681-698
- Cohen, AD, 2012, ‘Test taker strategies and task design’ in The Routledge handbook of language testing, eds G Fulcher and F Davidson, Routledge, Abingdon, UK, pp 262-277
- Cohen, AD, forthcoming, ‘Using test-wiseness strategy research in task development’ in The companion to language assessment. Vol. 2: Approaches and development, ed AJ Kunnan, Wiley/Blackwell, Hoboken, MJ
- Cohen, AD and Aphek, E, 1981, ‘Easifying second language learning’, Studies in Second Language Acquisition, vol 3, no 2, pp 221-235
- Cohen, AD and Olshtain, E, 1993, ‘The production of speech acts by EFL learners’, TESOL Quarterly, vol 27, pp 33-58
- Cohen, AD and Upton TA, 2006, Strategies in responding to new TOEFL reading tasks (TOEFL Monograph No. MS-33), Educational Testing Service, Princeton, NJ
- Cohen, AD, Weaver, S and Li, T-Y, 1996, The impact of strategies-based instruction on speaking a foreign language. CARLA Working Papers Series #4, Center for Advanced Research on Language Acquisition, Minneapolis, MN
- Cohen, AD and Macaro, E, eds, 2008, Language learner strategies: 30 years of research and practice, Oxford University Press, Oxford, UK
- Dadour, S, 1995, The effectiveness of selected learning strategies in developing oral communication of English department students in faculties of education. Unpublished doctoral dissertation, Mansoura University, Damietta, Egypt
- Davies, A, 2008, ‘Assessing academic English: Testing English proficiency 1950-1989 - the IELTS
- Solution’, Studies in Language Testing 23, Cambridge University Press, Cambridge, UK
- Dornyei, Z, 2005, The psychology of the language learner: Individual differences in second language acquisition, Lawrence Erlbaum, Mahwah, NJ
- Douglas, D, 1997, Testing speaking ability in academic contexts: Theoretical considerations. (TOEFL Monograph Series Rep. No. 8.), Educational Testing Service, Princeton, NJ
- Douglas, D, 2000, Assessing languages for specific purposes, Cambridge University Press, Cambridge, UK
- Dreyer, C and Oxford, R, 1996, ‘Learning strategies and other predictors of ESL proficiency among Afrikaans speakers in South Africa’ in Language learning strategies around the world: Cross-cultural perspectives, ed RL Oxford, University of Hawaii Press, Hawaii, pp 61-74
- Duffy, S, 2010, ‘Random numbers demonstrate the frequency of Type I errors: Three spreadsheets for class instruction’, Journal of Statistics Education, vol 18, pp 1-18
- Edwards, JR and Lambert LS, 2007, ‘Methods for integrating moderation and mediation: A general analytical framework using moderated path analysis’, Psychological Methods, vol 12, pp 1-22
- Ericsson, KA and Simon, HA, 1993, Protocol analysis: Verbal reports as data. MIT Press, Boston, MA
- Fairchild, AJ and MacKinnon, DP, 2009, ‘A general model for testing mediation and moderation Effects’, Prevention Science, vol 10, pp 87-99
- Falk, MB, Berkman, ET and Lieberman, MD, 2012, ‘From neural responses to population behavior: Neural focus group predicts population-level media effects’, Psychological Science, vol 23, no 5, pp 439-445
- Faul, F, Erdfielder, E, Lang, A-G and Buchner, A, 2007, ‘G*Power 3: A flexible statistical power analysis program for the social, behavioral, and biomedical sciences’, Behavior Research Methods, vol 39, pp 175-191
- Ferguson, CF, 2009, ‘An effect size primer: a guide for clinicians and researchers’, Professional Psychology Research and Practice, vol 40, pp 532-538
- Field, AP, 2009, Discovering statistics using SPSS, 3rd ed, Sage, London
- Flaitz, J and Feyten, C, 1996, ‘A two-phase study involving consciousness raising and strategy use for foreign language learners’ in Language learning strategies around the world: Cross-cultural perspectives, ed, RL Oxford, Second Language Teaching and Curriculum Center, University of Hawai’i at Mānoa, pp 211-225
- Flavell, J, 1979, ‘Metacognition and cognitive monitoring: A new area of cognitive-developmental inquiry’, American Psychologist, vol 34, no 10, pp 906-911
- Fleming, SM and Dolan, RJ, 2012, ‘The neural basis of metacognitive ability’, Philosophical Transactions of The Royal Society, vol 367, pp 1338-1349
- Fleming, SM, Huijgen, J and Dolan, RJ, 2012, ‘Prefronta contributions to metacognition in perceptual decision making’, Journal of Neuroscience, vol 32, no 18, pp 6117- 6125
- Fleming, SM, Weil, R, Nagy, Z, Dolan, RJ and Rees, G, 2010, ‘Relating introspective accuracy to individual differences in brain structure’, Science, vol 329, pp 1541-1543
- Fulcher, G, 2003, Testing second language speaking, Longman/Pearson Education, London, UK
- Gao, X, 2007, ‘Has language learning strategy research coming to an end? A response to Tseng et al. (2006)’, Applied Linguistics, vol 28, no 4, pp 615-620
- Gass, SM and Mackey, A, 2000, Stimulated recall methodology in second language research, Lawrence Erlbaum Publishers, Mahwah, NJ
- Gass, SM and Mackey, A, 2012, Research methodologies in second language acquisition, Blackwell, London, UK
- Green, A, 1998, Verbal protocol analysis in language testing research, Cambridge University Press, Cambridge, UK
- Haig, BD, 2003, ‘What is spurious correlation?’, Understanding Statistics, vol 2, no 2, pp 125-132
- Hair, J Jr, Anderson, RE, Babin, BJ, Tatman, RL and Black, WC, 2010, Multivariate data analysis, Prentice Hall, Upper Saddle River, NJ
- Halbach, A, 2000, ‘Finding out about students’ learning strategies by looking at their diaries: A case study’, System, vol 26, pp 85-96
- Harley, B, Allen, P, Cummins, J and Swain, M, 1990, The development of second language proficiency, Cambridge University Press, Cambridge, UK
- Hill, CR and Thompson, B, 2004, ‘Computing and interpreting effect sizes’ in Higher education handbook of theory and research, ed, JC Smart, vol XIX, Klewer, Boston, MA, pp 175-196
- Homburg, TJ and Spaan, MC, 1981, ‘ESL reading proficiency assessment: Testing strategies’, in On TESOL ’81, eds, M Hines and W Rutherford, TESOL, Washington, DC, pp 25-33
- Huang, L-S, 2004, ‘Focus on the learner: Language learning strategies for fostering self-regulated learning’, Contact (Special Research Symposium Issue), vol 30, no 2, pp 37-54.
- Huang, L-S, 2007, ‘The Next Generation TOEFL® Academic Speaking Test: Test-Takers’ Strategic Behaviours’, paper presented at AAAL Conference, Costa Mesa, CA
- Huang, L-S, 2010, ‘Do different modalities of reflection matter? An exploration of adult second-language learners reported strategy use and oral language production’, System, vol 38, no 2, pp 245-261
- Huang, L-S, 2012, ‘Use of oral reflection in facilitating graduate EAL students’ oral language production and strategy use: An empirical action research’, International Journal for the Scholarship of Teaching and Learning, vol 6, no 2, pp 1-22
- Huberty, CJ and Olejnik, S, 2006, Applied MANOVA and discriminant analysis. John Wiley, New York, NY
- Jamieson, J, Jones, S, Kirsch, I, Mosenthal, P and Taylor, C, 2000, TOEFL 2000 framework: A working paper (TOEFL Monograph Series Rep. No. 16), Educational Testing Service, Princeton, NJ
- Jourdenais, R, 2001, ‘Cognition, instruction and protocol analysis’ in Cognition and second language instruction, ed, P Robinson, Cambridge University Press, Cambridge, UK
- Kæsper, G and Kellerman, E, 1997, eds, Communication strategies: Psycholinguistic and sociolinguistic perspectives, Longman, London, UK
- Kline, RB, 2004, Beyond significance testing: reforming data analysis methods in behavioral research, American Psychological Association, Washington, DC
- Kotrlik, JW and Williams, HA, 2003, ‘The incorporation of effect size in information technology, learning, and performance research’, Information Technology, Learning, and Performance Research Journal, vol 21, pp 1-7
- Kraemer, HC, Morgan, GA, Leech, NL, Gliner, JA, Vaske, JJ and Harmon, RJ, 2003, ‘Measures of clinical significance’, Journal of the American Academy of Child and Adolescent Psychiatry, vol 32, pp 1524-1529
- Kunnan, AJ, ed, 1998, Validation in language assessment: Selected papers from the 17th Language Testing Research Colloquium, Long Beach, Lawrence Erlbaum Associates, Inc, Mahwah, NJ
- LoCastro, V, 1994, ‘Learning strategies and learning environments’, TESOL Quarterly, vol 28, pp 409-414
- Macaro, E, 2006, Strategies for language learning and for language use: Revising the theoretical framework, The Modern Language Journal, vol 90, no 3, pp 320-337
- McDonald, JH, 2009, Handbook of biological statistics (2nd ed). Sparky House Publishing, Maltimore, MD
- McNamara, TF, 1996, Measuring second language performance, Longman, London, UK
- Messick, S, 1989, ‘Validity’, in Educational measurement, ed, RL Linn, Macmillian/American Council on Education, New York, NY, pp 13-103
- Milanovic, M, Saville, N, Pollitt, A and Cook, A, 1996, ‘Developing rating scales for CASE: Theoretical concerns and analyses’ in Validation in language testing, eds, A Cumming and R Berwick, Multilingual Matters. Clevedon, UK, pp 15-38
- Naiman, N, Fröhlich M, Stern HH and Todesco, A, 1978, The good language learner. Research in Education Series 7, Ontario Institute for Studies in Education, Toronto, ON
- Nakatani, Y, 2006, ‘Developing an oral communication strategy inventory’, Modern Language Journal, vol 90, no 2, pp. 151-168.
- Neisser, U, 1976, Cognition and reality: Principles and implications of cognitive psychology. Freeman, San Francisco, CA
- Nelson, TO and Naren, L, 1990, ‘Metamemory: A theoretical framework and new findings’, Psychology of Learning and Motivation, vol 26, pp 125-173
- Nikolov, M, 2006, ‘Test-taking strategies of 12- and 13- year-old Hungarian learners of EFL: Why whales have migraines’, Language Learning, vol 56, no 1, pp 1-51
- O’Malley, MJ and Chamot, AU, 1990, Learning strategies in second language acquisition, Cambridge University Press, Cambridge, UK
- Oxford, RL, 1990, Language learning strategies, Newbury House, New York, NY
- Oxford, RL, 2011, Teaching and researching language learning strategies, Pearson Education Limited, Harlow, UK.
- Oxford, RL and Ehrman, ME, 1995, ‘Adults’ language learning strategies in an intensive foreign language program in the United States’, System, vol 23, no 3, pp 38-45
- Palmer, AS, Groot, PJM and Trosper, GA, eds, 1981, The construct validation of tests of communicative competence, TESOL, Washington, DC
- Paribakht, T, 1985, ‘Strategic competence and language proficiency’, Applied Linguistics, vol 6, pp 132-146
- Phakiti, A, 2003, ‘A closer look at the relationship of cognitive and metacognitive strategy use to EFL reading achievement test’, Language Testing, vol 20, pp 26-56
- Poulisse, N, 1990, The use of compensatory strategies by Dutch learners of English, Foris, Dordrecht
- Pressley, M and Afflerbach, P, 1995, Verbal protocols of reading: The nature of constructively responsive reading, Lawrence Erlbaum, Hillsdale, NJ
- Purpura, JE, 1997, ‘An analysis of the relationships between test-takers’ cognitive and metacognitive strategy use and second language test performance’, Language Learning, vol 47, pp 289-325
- Purpura, JE, 1998, ‘Investigating the effects of strategy use and second language test performance with high- and low-ability test takers: A structural equation modelling approach’, Language Testing, vol 15, no 3, pp 333-379
- Purpura, JE, 1999, Learner strategy use and performance and language tests: A structural equation modelling approach, University of Cambridge Local Examinations Syndicate and Cambridge University Press, Cambridge, UK
- Rerkasem, K and Rothwell, PM, 2010, ‘Meta-analysis of small randomized controlled trials in surgery may be unreliable’, British Journal of Surgery, vol 97, no 4, pp 466-469
- Rose, H, 2012, ‘Reconceptualizing strategic learning in the face of self-regulation: Throwing language learning strategies out with the bathwater’, Applied Linguistics, vol 33, no 1, pp 92-98
- Rose, BM, Holmbeck, GN, Coakley, RM and Franks, E, 2004, ‘Mediator and moderator effects in developmental and behavioural pediatric research’, Developmental and Behavioral Pediatrics, vol 25, no 1, pp 58-67
- Rubin, J, 1975, ‘What the “good language learner” can teach us’, TESOL Quarterly, vol 9, pp 41-51
- Rubin, J, 1987, ‘Learner strategies: Theoretica assumptions, research history, and typology’ in Learner strategies in language learning, ed, A Wenden and J Rubin, Prentice-Hall International, Englewood Cliffs, NJ, pp 15-29
- Schmidt, R and Frota, SN, 1986, ‘Developing basic conversational ability in a second language: A case study of an adult learner of Portuguese’ in Talking to learn: Conversation in second language acquisition, ed, R Day, Newbury House, Rowley, MA, pp 237-326
- Selinger, HW, 1983, ‘The language learner as linguist: Of metaphors and realities’, Applied Linguistics, vol 4, pp 179-191
- Shallice, T and Burgess, P, 1996, ‘The domain of supervisory processes and temporal organization of behaviour’, Philosophical Transactions of the Royal Society, vol 351, pp 1405-1411
- Shaw, SD and Weir, CJ, 2007, Examining Writing: Research and practice in assessing second language writing, UCLES/Cambridge University Press, Cambridge, UK
- Shimamura, AP, 2008, ‘A neurocognitive approach to metacognitive monitoring and control’ in Handbook of memory and metamemory: Essays in honor of Thomas O. Nelso, eds, J Dunlosky and R Bjork, Psychology Press, New York, NY, pp 373-390
- Stern, HH, 1975, ‘What can we learn from the good language learner?’, Canadian Modern Language Review, vol 31, pp 304-318.
- Stern, HH, 1992, Issues and options in language teaching, Oxford University Press, Oxford, UK
- Swain, M, 1985, ‘Large-scale communicative language testing: A case study’ in New directions in language testing, eds, YP Lee, ACY Fok, R Lord and G Low, Pergmon Press, Oxford, UK, pp 35-46
- Swain, M, Huang, L-S, Barkaoui, K, Brooks, L and Lapkin, S, 2009, The speaking section of the TOEFL iBT™ (SSTiBT): Test-takers’ reported strategic behaviors (TOEFL iBT™ Research Series No. TOEFLiBT-10), Educational Testing Service, Princeton, NJ
- Tabachnick, BG and Fidell, LS, 2007, Using multivariate statistics, Allyn and Bacon, Boston, MA
- Taguchi, N, 2001, ‘L2 learners’ strategic mental processes during a listening test’, JALT Journal, vol 23, no 2, pp 176-201
- Tarone, E, 1998, ‘Research on interlanguage variation: Implications for language testing’ in Interfaces between second language acquisition and language testing research, eds, LF Bachman and AD Cohen, Cambridge University Press, New York, NY, pp 77-111
- Taylor, L and Falvey, P, eds, 2007, IELTS collected papers: Research in speaking and writing assessment, UCLES/Cambridge University Press, Cambridge, UK
- Tian, S, 2000, TOEFL reading comprehension: Strategies used by Taiwanese students with coaching-school training. Unpublished PhD dissertation, Teachers College, Columbia University, New York
- Tseng, W, Dornyei, Z and Schmitt, N, 2006, ‘A new approach to assessing strategic learning: The case of selfregulation in vocabulary acquisition’, Applied Linguistics, vol 27, pp 78-102
- Westen, D and Rosenthal, D, 2003, ‘Quantifying construct validity: Two simple measures’, Journal of Personality and Social Psychology, vol 84, no 3, pp 608-618.
- Weir, CJ and O’Sullivan, B, 2011, ‘Language testing = validation’ in Language testing: Theories and practices, ed, B O’Sullivan, Palgrave Macmillan, Basingstoke, UK, pp 13-32
- Wenden, A and Rubin, J, 1987, Learner strategies in language learning, Prentice-Hall International, Englewood Cliffs, NJ
- Wesche, MB, 1981, ‘Communicative testing in a second language’, Canadian Modern Language Review, vol 37, no 3, pp 551-571
- Wesche, MB, 1987, ‘Second language performance testing: The Ontario test of ESL as an example’, Language Testing, vol 4, pp 28-47
- Wijh, I, 1996, ‘A communicative test in analysis: Strategies in reading authentic texts’, in Validation in language testing, eds, A Cumming and Berwick, Multilingual Matters, Clevedon, UK, pp 154-170
- Yang, P, 2000, Effects of test-wiseness upon performance on the Test of English as a Foreign Language, unpublished PhD dissertation, University of Alberta, Edmonton.
- Young, KA, 2005, ‘Direct from the source: The value of ‘think-aloud’ data in understanding learning’, Journal of Educational Enquiry, vol 6, no 1, pp 19-33
- Yoshida-Morise, Y, 1998, ‘The use of communication strategies in LPIs’ in Talking and testing: Discourse approaches to the assessment of oral proficiency, eds, R Young and W He, John Benjamins Publishing Company, Amsterdam/Philadelphia, pp 205-238
- Yoshizawa, K, 2002, Relationships among strategy use, foreign language aptitude, and second language proficiency: A structural equation modelling approach, unpublished PhD dissertation, Temple University.
- Yule, G and Tarone, E, 1997, ‘Investigating L2 reference: Pros and cons’ in Advances in communication strategy research, eds, G Kasper and E Kellerman, Longman, New York, NY, pp 17-30
APPENDIX 1: SAMPLE CODING SCHEME
Note that some of the examples used to illustrate specific individual strategic behaviours, out of necessity, have been taken out of their original context provided through the participants’ IELTS speaking performance and stimulated recall sessions, and, as such, they may be potentially ambiguous to the reader.
Social strategies: involving interacting with the examiner/teacher in order to perform the task
| Individual strategies | Definition | Example |
|---|---|---|
| Asking examiner questions to direct conversation | Test-taker/learner asking the examiner questions to decide what to talk about | Instructor: Let’s move on to talk about national celebrations. Thinking of one main national celebration in your country, where did it start? What are its roots? L12: You mean an exact one or…? Instructor: Yeah, you can think one specific national celebration. L12: National celebration… Can I talk about Olympic Games? Is that [okay]…? Instructor: No, like something [that] happens regularly… L12: Oh, regular. I think [that] must be the Chinese New Year Celebration? Instructor: Yes. (L12, TASK 3) 1 |
| Asking examiner questions to engage the examiner | Test-taker/learner engaging in conversation by asking the examiner questions | Instructor: Can you tell me where you are from? L5: I’m from China, Shanghai. That was, that is my second-born place. My first was, … is Kunming. Have you ever heard about it? No? (L5, TASK 1) |
| Attending to the listener’s interest | Test-taker/learner directing attention or concentrating on the listener’s interest | 有什么很新颖得东西,然后能够让考官就是能够吸引到。I tried to think of some novel ideas, which could attract the examiner’s interest. (T5, TASK 3) |
| Creating a positive impression | Test-taker/learner trying to create a positive impression on the examiner/teacher | 因为通常我考雅思地时候,第一部分我是通畅不太在乎地,因为只要是跟他聊聊天,把他就是对我地印象就可能尽量往好的那个方面去转,那就好了。Because usually when I take IELTS tests, I don’t care too much about my fluency in the first part. The main thing is to create a good impression, and that’s it. (L7, TASK 3) |
| Seeking clarification | Test-taker/learner seeking clarification from the examiner | 第三部分的时候问题我问她到底想让我回答到哪个点上,所以就会再问一句。For the third section, I asked her which specific point she would like me to respond to, so I asked again. (L3, TASK 3) |
| Seeking help | Test-taker/learner seeking help from the examiner/teacher | 我直接就说跟他说,现在我有点紧张,我会直接说出来。再说的时候考官他会就跟我说你放松一些,没事,然后可能这个时候我就会转变一下,就好一点点…。I told him directly that I was a bit nervous. I would tell him directly. The examiner told me to relax and that everything is okay. Then, at that point I changed and felt a bit better… (T5, TASK 3) |
| Seeking social interaction | Test-taker/learner seeking interaction with the examiner/teacher | 基本上跟老师互动交流,两个人感觉在那边聊天,跟老师讨论这个历史方面儿交流学习。I basically exchanged ideas with the teacher. It felt like two people chatting; I discuss the topic related to history with the teacher and learn through dialogical interactions. (L11, TASK 3) |
Appendix 2A: Descriptive Statistics By Context, Proficiency Level, And Task
| Strategy category | Task | Context | Level | Mean | Std. deviation | N |
|---|---|---|---|---|---|---|
| Affective | 1 | Non-testing | Advanced | 0.109 | 0.115 | 10 |
| Affective | 1 | Non-testing | Intermediate | 0.064 | 0.089 | 10 |
| Affective | 1 | Non-testing | Total | 0.087 | 0.103 | 20 |
| Affective | 1 | Testing | Advanced | 0.123 | 0.058 | 10 |
| Affective | 1 | Testing | Intermediate | 0.105 | 0.100 | 10 |
| Affective | 1 | Testing | Total | 0.114 | 0.080 | 20 |
| Affective | 1 | Total | Advanced | 0.116 | 0.089 | 20 |
| Affective | 1 | Total | Intermediate | 0.084 | 0.094 | 20 |
| Affective | 1 | Total | Total | 0.100 | 0.092 | 40 |
| Affective | 2 | Non-testing | Advanced | 0.055 | 0.051 | 10 |
| Affective | 2 | Non-testing | Intermediate | 0.062 | 0.044 | 10 |
| Affective | 2 | Non-testing | Total | 0.058 | 0.047 | 20 |
| Affective | 2 | Testing | Advanced | 0.077 | 0.069 | 10 |
| Affective | 2 | Testing | Intermediate | 0.091 | 0.073 | 10 |
| Affective | 2 | Testing | Total | 0.084 | 0.069 | 20 |
| Affective | 2 | Total | Advanced | 0.066 | 0.060 | 20 |
| Affective | 2 | Total | Intermediate | 0.076 | 0.060 | 20 |
| Affective | 2 | Total | Total | 0.071 | 0.060 | 40 |
| Affective | 3 | Non-testing | Advanced | 0.147 | 0.071 | 10 |
| Affective | 3 | Non-testing | Intermediate | 0.160 | 0.071 | 10 |
| Affective | 3 | Non-testing | Total | 0.154 | 0.070 | 20 |
| Affective | 3 | Testing | Advanced | 0.137 | 0.088 | 10 |
| Affective | 3 | Testing | Intermediate | 0.096 | 0.084 | 10 |
| Affective | 3 | Testing | Total | 0.117 | 0.086 | 20 |
| Affective | 3 | Total | Advanced | 0.142 | 0.078 | 20 |
| Affective | 3 | Total | Intermediate | 0.128 | 0.083 | 20 |
| Affective | 3 | Total | Total | 0.135 | 0.079 | 40 |
| Approach | 1 | Non-testing | Advanced | 0.070 | 0.087 | 10 |
| Approach | 1 | Non-testing | Intermediate | 0.085 | 0.069 | 10 |
| Approach | 1 | Non-testing | Total | 0.077 | 0.077 | 20 |
| Approach | 1 | Testing | Advanced | 0.058 | 0.074 | 10 |
| Approach | 1 | Testing | Intermediate | 0.054 | 0.109 | 10 |
| Approach | 1 | Testing | Total | 0.056 | 0.090 | 20 |
| Approach | 1 | Total | Advanced | 0.064 | 0.079 | 20 |
| Approach | 1 | Total | Intermediate | 0.069 | 0.090 | 20 |
| Approach | 1 | Total | Total | 0.067 | 0.084 | 40 |
| Approach | 2 | Non-testing | Advanced | 0.097 | 0.049 | 10 |
| Approach | 2 | Non-testing | Intermediate | 0.082 | 0.062 | 10 |
| Approach | 2 | Non-testing | Total | 0.089 | 0.055 | 20 |
| Approach | 2 | Testing | Advanced | 0.114 | 0.052 | 10 |
| Approach | 2 | Testing | Intermediate | 0.108 | 0.087 | 10 |
| Approach | 2 | Testing | Total | 0.111 | 0.070 | 20 |
| Approach | 2 | Total | Advanced | 0.106 | 0.050 | 20 |
| Approach | 2 | Total | Intermediate | 0.095 | 0.075 | 20 |
| Approach | 2 | Total | Total | 0.100 | 0.063 | 40 |
| Approach | 3 | Non-testing | Advanced | 0.088 | 0.059 | 10 |
| Approach | 3 | Non-testing | Intermediate | 0.064 | 0.043 | 10 |
| Approach | 3 | Non-testing | Total | 0.076 | 0.052 | 20 |
| Approach | 3 | Testing | Advanced | 0.105 | 0.064 | 10 |
| Approach | 3 | Testing | Intermediate | 0.101 | 0.047 | 10 |
| Approach | 3 | Testing | Total | 0.103 | 0.055 | 20 |
| Approach | 3 | Total | Advanced | 0.096 | 0.061 | 20 |
| Approach | 3 | Total | Intermediate | 0.082 | 0.047 | 20 |
| Approach | 3 | Total | Total | 0.089 | 0.054 | 40 |
| Cognitive | Non-testing | Advanced | 0.015 | 0.033 | 10 | |
| Cognitive | Non-testing | Intermediate | 0.043 | 0.047 | 10 | |
| Cognitive | Non-testing | Total | 0.029 | 0.042 | 20 | |
| Cognitive | 1 | Testing | Advanced | 0.071 | 0.069 | 10 |
| Cognitive | 1 | Testing | Intermediate | 0.045 | 0.040 | 10 |
| Cognitive | 1 | Testing | Total | 0.058 | 0.057 | 20 |
| Cognitive | 1 | Total | Advanced | 0.043 | 0.060 | 20 |
| Cognitive | 1 | Total | Intermediate | 0.044 | 0.042 | 20 |
| Cognitive | 1 | Total | Total | 0.043 | 0.051 | 40 |
| Cognitive | 2 | Non-testing | Advanced | 0.139 | 0.063 | 10 |
| Cognitive | 2 | Non-testing | Intermediate | 0.129 | 0.047 | 10 |
| Cognitive | 2 | Non-testing | Total | 0.134 | 0.054 | 20 |
| Cognitive | 2 | Testing | Advanced | 0.146 | 0.092 | 10 |
| Cognitive | 2 | Testing | Intermediate | 0.115 | 0.087 | 10 |
| Cognitive | 2 | Testing | Total | 0.131 | 0.089 | 20 |
| Cognitive | 2 | Total | Advanced | 0.143 | 0.077 | 20 |
| Cognitive | 2 | Total | Intermediate | 0.122 | 0.069 | 20 |
| Cognitive | 2 | Total | Total | 0.133 | 0.073 | 40 |
| Cognitive | 3 | Non-testing | Advanced | 0.052 | 0.043 | 10 |
| Cognitive | 3 | Non-testing | Intermediate | 0.050 | 0.038 | 10 |
| Cognitive | 3 | Non-testing | Total | 0.051 | 0.039 | 20 |
| Cognitive | 3 | Testing | Advanced | 0.039 | 0.038 | 10 |
| Cognitive | 3 | Testing | Intermediate | 0.082 | 0.046 | 10 |
| Cognitive | 3 | Testing | Total | 0.061 | 0.047 | 20 |
| Cognitive | 3 | Total | Advanced | 0.046 | 0.040 | 20 |
| Cognitive | 3 | Total | Intermediate | 0.066 | 0.044 | 20 |
| Cognitive | 3 | Total | Total | 0.056 | 0.043 | 40 |
| Communication | 1 | Non-testing | Advanced | 0.381 | 0.139 | 10 |
| Communication | 1 | Non-testing | Intermediate | 0.313 | 0.149 | 10 |
| Communication | 1 | Non-testing | Total | 0.347 | 0.144 | 20 |
| Communication | 1 | Testing | Advanced | 0.460 | 0.145 | 10 |
| Communication | 1 | Testing | Intermediate | 0.439 | 0.157 | 10 |
| Communication | 1 | Testing | Total | 0.450 | 0.147 | 20 |
| Communication | 1 | Total | Advanced | 0.421 | 0.144 | 20 |
| Communication | 1 | Total | Intermediate | 0.376 | 0.162 | 20 |
| Communication | 1 | Total | Total | 0.398 | 0.153 | 40 |
| Communication | 2 | Non-testing | Advanced | 0.292 | 0.081 | 10 |
| Communication | 2 | Non-testing | Intermediate | 0.365 | 0.099 | 10 |
| Communication | 2 | Non-testing | Total | 0.329 | 0.096 | 20 |
| Communication | 2 | Testing | Advanced | 0.261 | 0.094 | 10 |
| Communication | 2 | Testing | Intermediate | 0.287 | 0.117 | 10 |
| Communication | 2 | Testing | Total | 0.274 | 0.104 | 20 |
| Communication | 2 | Total | Advanced | 0.276 | 0.087 | 20 |
| Communication | 2 | Total | Intermediate | 0.326 | 0.113 | 20 |
| Communication | 2 | Total | Total | 1.301 | 0.102 | 40 |
| Communication | 3 | Non-testing | Advanced | 0.297 | 0.079 | 10 |
| Communication | 3 | Non-testing | Intermediate | 0.268 | 0.103 | 10 |
| Communication | 3 | Non-testing | Total | 0.283 | 0.091 | 20 |
| Communication | 3 | Testing | Advanced | 0.231 | 0.112 | 10 |
| Communication | 3 | Testing | Intermediate | 0.276 | 0.110 | 10 |
| Communication | 3 | Testing | Total | 0.254 | 0.110 | 20 |
| Communication | 3 | Total | Advanced | 0.264 | 0.100 | 20 |
| Communication | 3 | Total | Intermediate | 0.272 | 0.104 | 20 |
| Communication | 3 | Total | Total | 0.268 | 0.101 | 40 |
| Metacognitive | 1 | Non-testing | Advanced | 0.285 | 0.142 | 10 |
| Metacognitive | 1 | Non-testing | Intermediate | 0.346 | 0.171 | 10 |
| Metacognitive | 1 | Non-testing | Total | 0.315 | 0.156 | 20 |
| Metacognitive | 1 | Testing | Advanced | 0.264 | 0.120 | 10 |
| Metacognitive | 1 | Testing | Intermediate | 0.306 | 0.117 | 10 |
| Metacognitive | 1 | Testing | Total | 0.285 | 0.117 | 20 |
| Metacognitive | 1 | Total | Advanced | 0.275 | 0.128 | 20 |
| Metacognitive | 1 | Total | Intermediate | 0.326 | 0.144 | 20 |
| Metacognitive | 1 | Total | Total | 0.300 | 0.137 | 40 |
| Metacognitive | 2 | Non-testing | Advanced | 0.434 | 0.112 | 10 |
| Metacognitive | 2 | Non-testing | Intermediate | 0.379 | 0.100 | 10 |
| Metacognitive | 2 | Non-testing | Total | 0.406 | 0.107 | 20 |
| Metacognitive | 2 | Testing | Advanced | 0.414 | 0.118 | 10 |
| Metacognitive | 2 | Testing | Intermediate | 0.413 | 0.165 | 10 |
| Metacognitive | 2 | Testing | Total | 0.414 | 0.140 | 20 |
| Metacognitive | 2 | Total | Advanced | 0.424 | 0.112 | 20 |
| Metacognitive | 2 | Total | Intermediate | 0.396 | 0.134 | 20 |
| Metacognitive | 2 | Total | Total | 0.410 | 0.123 | 40 |
| Metacognitive | 3 | Non-testing | Advanced | 0.373 | 0.104 | 10 |
| Metacognitive | 3 | Non-testing | Intermediate | 0.452 | 0.136 | 10 |
| Metacognitive | 3 | Non-testing | Total | 0.413 | 0.125 | 20 |
| Metacognitive | 3 | Testing | Advanced | 0.469 | 0.114 | 10 |
| Metacognitive | 3 | Testing | Intermediate | 0.453 | 0.138 | 10 |
| Metacognitive | 3 | Testing | Total | 0.461 | 0.123 | 20 |
| Metacognitive | 3 | Total | Advanced | 0.421 | 0.117 | 20 |
| Metacognitive | 3 | Total | Intermediate | 0.452 | 0.133 | 20 |
| Metacognitive | 3 | Total | Total | 0.437 | 0.125 | 40 |
| Social | 1 | Non-testing | Advanced | 0.162 | 0.103 | 10 |
| Social | 1 | Non-testing | Intermediate | 0.172 | 0.110 | 10 |
| Social | 1 | Non-testing | Total | 0.167 | 0.104 | 20 |
| Social | 1 | Testing | Advanced | 0.049 | 0.069 | 10 |
| Social | 1 | Testing | Intermediate | 0.079 | 0.099 | 10 |
| Social | 1 | Testing | Total | 0.064 | 0.085 | 20 |
| Social | 1 | Total | Advanced | 0.105 | 0.103 | 20 |
| Social | 1 | Total | Intermediate | 0.126 | 0.112 | 20 |
| Social | 1 | Total | Total | 0.115 | 0.107 | 40 |
| Social | 2 | Non-testing | Advanced | 0.005 | 0.016 | 10 |
| Social | 2 | Non-testing | Intermediate | 0.005 | 0.014 | 10 |
| Social | 2 | Non-testing | Total | 0.005 | 0.015 | 20 |
| Social | 2 | Testing | Advanced | 0.008 | 0.018 | 10 |
| Social | 2 | Testing | Intermediate | 0.010 | 0.030 | 10 |
| Social | 2 | Testing | Total | 0.009 | 0.024 | 20 |
| Social | 2 | Total | Advanced | 0.007 | 0.016 | 20 |
| Social | 2 | Total | Intermediate | 0.007 | 0.023 | 20 |
| Social | 2 | Total | Total | 0.007 | 0.020 | 40 |
| Social | 3 | Non-testing | Advanced | 0.059 | 0.043 | 10 |
| Social | 3 | Non-testing | Intermediate | 0.030 | 0.024 | 10 |
| Social | 3 | Non-testing | Total | 0.045 | 0.037 | 20 |
| Social | 3 | Testing | Advanced | 0.044 | 0.032 | 10 |
| Social | 3 | Testing | Intermediate | 0.016 | 0.018 | 10 |
| Social | 3 | Testing | Total | 0.030 | 0.029 | 20 |
| Social | 3 | Total | Advanced | 0.052 | 0.038 | 20 |
| Social | 3 | Total | Intermediate | 0.023 | 0.022 | 20 |
| Social | 3 | Total | Total | 0.037 | 0.034 | 40 |
Note: The social-strategy variable was excluded from the MANOVA, as previously explained.
Appendix 2B: Descriptive Statistics (Non-Arcsine-Transformed) By Context, Proficiency Level, And Task
| Context | Level | AFF Task 1 | AFF Task 2 | AFF Task 3 | APP Task 1 | APP Task 2 | APP Task 3 | COG Task 1 | COG Task 2 | COG Task 3 | COM Task 1 | COM Task 2 | COM Task 3 | METACOG Task 1 | METACOG Task 2 | METACOG Task 3 | SOC Task 1 | SOC Task 2 | SOC Task 3 | |
|---|---|---|---|---|---|---|---|---|---|---|---|---|---|---|---|---|---|---|---|---|
| Non-Testing | Advanced | M | 1.20 | 1.00 | 4.10 | .70 | 1.60 | 2.40 | .20 | 2.40 | 1.50 | 4.10 | 4.80 | 8.20 | 3.10 | 6.90 | 10.20 | 2.00 | .10 | 1.70 |
| Non-Testing | Advanced | N | 10 | 10 | 10 | 10 | 10 | 10 | 10 | 10 | 10 | 10 | 10 | 10 | 10 | 10 | 10 | 10 | 10 | 10 |
| Non-Testing | Advanced | SD | 1.135 | .943 | 2.132 | .823 | .699 | 1.713 | .422 | 1.265 | 1.269 | 1.912 | 2.300 | 2.741 | 1.449 | 2.558 | 3.584 | 1.491 | .316 | 1.252 |
| Non-Testing | Intermediate | M | .70 | 1.20 | 4.50 | .90 | 1.70 | 1.80 | .60 | 2.70 | 1.40 | 3.30 | 7.30 | 7.30 | 3.60 | 7.40 | 12.60 | 1.90 | .10 | .80 |
| Non-Testing | Intermediate | N | 10 | 10 | 10 | 10 | 10 | 10 | 10 | 10 | 10 | 10 | 10 | 10 | 10 | 10 | 10 | 10 | 10 | 10 |
| Non-Testing | Intermediate | SD | .823 | .789 | 2.121 | .876 | 1.252 | 1.135 | .699 | 1.059 | .966 | 1.829 | 2.497 | 3.268 | 1.897 | 1.838 | 5.190 | 1.287 | .316 | .632 |
| Non-Testing | Total | M | .95 | 1.10 | 4.30 | .80 | 1.65 | 2.10 | .40 | 2.55 | 1.45 | 3.70 | 6.05 | 7.75 | 3.35 | 7.15 | 11.40 | 1.95 | .10 | 1.25 |
| Non-Testing | Total | N | 20 | 20 | 20 | 20 | 20 | 20 | 20 | 20 | 20 | 20 | 20 | 20 | 20 | 20 | 20 | 20 | 20 | 20 |
| Non-Testing | Total | SD | .999 | .852 | 2.080 | .834 | .988 | 1.447 | .598 | 1.146 | 1.099 | 1.867 | 2.665 | 2.971 | 1.663 | 2.183 | 4.512 | 1.356 | .308 | 1.070 |
| Testing | Advanced | M | 1.70 | 1.50 | 4.70 | .80 | 2.50 | 3.00 | .90 | 2.80 | 1.40 | 5.60 | 5.40 | 7.10 | 3.50 | 8.40 | 14.80 | .70 | .20 | 1.60 |
| Testing | Advanced | N | 10 | 10 | 10 | 10 | 10 | 10 | 10 | 10 | 10 | 10 | 10 | 10 | 10 | 10 | 10 | 10 | 10 | 10 |
| Testing | Advanced | SD | 1.160 | 1.509 | 3.057 | .919 | 1.780 | 1.333 | .876 | 1.549 | 1.506 | 1.776 | 2.675 | 3.872 | 2.224 | 3.836 | 6.529 | .949 | .422 | 1.265 |
| Testing | Intermediate | M | 1.40 | 1.70 | 2.90 | .80 | 2.20 | 3.20 | .70 | 2.30 | 2.40 | 5.80 | 5.70 | 8.00 | 4.00 | 7.90 | 11.90 | 1.10 | .20 | .50 |
| Testing | Intermediate | N | 10 | 10 | 10 | 10 | 10 | 10 | 10 | 10 | 10 | 10 | 10 | 10 | 10 | 10 | 10 | 10 | 10 | 10 |
| Testing | Intermediate | SD | 1.430 | 1.252 | 2.885 | 1.398 | 1.874 | 2.486 | .675 | 1.829 | 1.578 | 2.898 | 2.908 | 4.216 | 1.826 | 3.665 | 4.358 | 1.287 | .632 | .527 |
| Testing | Total | M | 1.55 | 1.60 | 3.80 | .80 | 2.35 | 3.10 | .80 | 2.55 | 1.90 | 5.70 | 5.55 | 7.55 | 3.75 | 8.15 | 13.35 | .90 | .20 | 1.05 |
| Testing | Total | N | 20 | 20 | 20 | 20 | 20 | 20 | 20 | 20 | 20 | 20 | 20 | 20 | 20 | 20 | 20 | 20 | 20 | 20 |
| Testing | Total | SD | 1.276 | 1.353 | 3.037 | 1.152 | 1.785 | 1.944 | .768 | 1.669 | 1.586 | 2.342 | 2.724 | 3.967 | 1.997 | 3.660 | 5.603 | 1.119 | .523 | 1.099 |
| Grand Total | M | 1.25 | 1.35 | 4.05 | .80 | 2.00 | 2.60 | .60 | 2.55 | 1.67 | 4.70 | 5.80 | 7.65 | 3.55 | 7.65 | 12.38 | 1.42 | .15 | 1.15 | |
| Grand Total | N | 40 | 40 | 40 | 40 | 40 | 40 | 40 | 40 | 40 | 40 | 40 | 40 | 40 | 40 | 40 | 40 | 40 | 40 | |
| Grand Total | SD | 1.171 | 1.145 | 2.581 | .992 | 1.468 | 1.766 | .709 | 1.413 | 1.366 | 2.323 | 2.672 | 3.461 | 1.825 | 3.017 | 5.118 | 1.338 | .427 | 1.075 |
Note: AFF = Affective; APP = Approach; COG = Cognitive; COM = Communicative; METACOG = Meta-cognitive; SOC = Social.
Appendix 3: Results Of Repeated Measures Anova On Rater Scores
Multivariate tests
| Effect | Test | Value | F | Hypothesis df | Error df | p |
|---|---|---|---|---|---|---|
| Rater | Pillai’s Trace | .040 | 1.645a | 1.000 | 39.000 | .207 |
| Rater | Wilks’ Lambda | .960 | 1.645a | 1.000 | 39.000 | .207 |
| Rater | Hotelling’s Trace | .042 | 1.645a | 1.000 | 39.000 | .207 |
| Rater | Roy’s Largest Root | .042 | 1.645a | 1.000 | 39.000 | .207 |
a Exact statistic
Tests of within-subjects effects
| Source | Test | Type III sum of squares | df | Mean square | F | p |
|---|---|---|---|---|---|---|
| Rater | Sphericity Assumed | .176 | 1 | .176 | 1.645 | .207 |
| Rater | Greenhouse-Geisser | .176 | 1.000 | .176 | 1.645 | .207 |
| Rater | Huynh-Fieldt | .176 | 1.000 | .176 | 1.645 | .207 |
| Rater | Lower-bound | .176 | 1.000 | .176 | 1.645 | .207 |
| Error(Rater) | Sphericity Assumed | 4.168 | 39 | .107 | ||
| Error(Rater) | Greenhouse-Geisser | 4.168 | 39.000 | .107 | ||
| Error(Rater) | Huynh-Fieldt | 4.168 | 39.000 | .107 | ||
| Error(Rater) | Lower-bound | 4.168 | 39.000 | .107 |
Tests of within-subjects contrasts
| Source | Rater | Type III sum of squares | df | Mean square | F | p |
|---|---|---|---|---|---|---|
| Rater | Linear | .176 | 1 | .176 | 1.645 | .207 |
| Error (Rater) | Linear | 4.168 | 39 | .110 |