
An investigation into double-marking methods: comparing live, audio and video rating of performance on the IELTS Speaking Test
Official IELTS research report on IELTS Test - Speaking, published in 2017.
Abstract
This study compared IELTS examiners’ scores when they assessed test-takers’ spoken performance under live and two non-live rating conditions using audio and video recordings. It also explored examiners’ perceptions towards test-takers’ performance in the two non-live rating modes.
This was a mixed-methods study that involved both existing and newly collected datasets. A total of six trained IELTS examiners assessed 36 test-takers’ performance under the live, audio and video rating conditions. Their scores in the three modes of rating were calibrated using the multifaceted Rasch model analysis.
In all modes of rating, the examiners were asked to make notes on why they awarded the scores that they did on each analytical category. The comments were quantitatively analysed in terms of the volume of positive and negative features of test-takers’ performance that examiners reported noticing when awarding scores under the three rating conditions.
Using selected test-takers’ audio and video recordings, examiners’ verbal reports were also collected to gain insights into their perceptions towards test-takers’ performance under the two non-live conditions.
The results showed that audio ratings were significantly lower than live and video ratings for all rating categories. Examiners noticed more negative performance features of test-takers under the two non-live rating conditions than the live rating condition. The verbal report data demonstrated how having visual information in the video-rating mode helped examiners to understand test-takers’ utterances, to see what was happening beyond what the test-takers were saying and to understand with more confidence the source of test-takers’ hesitation, pauses and awkwardness in their performance.
The results of this study have, therefore, offered a better understanding of the three modes of rating, and a recommendation was made regarding enhanced double-marking methods that could be introduced to the IELTS Speaking Test.
Authors’ biodata
Fumiyo Nakatsuhara
Dr Fumiyo Nakatsuhara is a Reader at the Centre for Research in English Language Learning and Assessment (CRELLA), University of Bedfordshire. Her research interests include the nature of co-constructed interaction in various speaking test formats (e.g., interview, paired and group formats), task design and rating scale development. Fumiyo’s recent publications include the book, The Co-construction of Conversation in Group Oral Tests (2013, Peter Lang), book chapters in Language Testing: Theories and Practices (O’Sullivan, ed. 2011) and IELTS Collected Paper 2: Research in Reading and Listening Assessment (Taylor and Weir, eds. 2012) , as well as journal articles in Language Testing (2011; 2014). She has carried out a number of international testing projects, working with ministries, universities and examination boards.
Chihiro Inoue
Dr Chihiro Inoue is a Lecturer at the Centre for Research in English Language Learning and Assessment (CRELLA), University of Bedfordshire. Her main research interests lie in the task design, rating scale development, the criterial features of learner language in productive skills and the variables to measure such features. She has carried out a number of test development and validation projects in English and Japanese languages in the UK, USA and Japan.
Her publications include the book, Task Equivalence in Speaking Tests (2013, Peter Lang) and articles in Assessing Writing (2015) and Language Learning Journal (2016). In addition to teaching and supervising in the field of language testing at UK universities, Chihiro has wide experience in teaching EFL and ESP at the high school, college and university levels in Japan.
Lynda Taylor
Dr Lynda Taylor is a Senior Lecturer at the Centre for Research in English Language Learning and Assessment (CRELLA), University of Bedfordshire, as well as Consultant to Cambridge English, where she was formerly Assistant Director of Research and Validation with direct involvement in the research and development program for IELTS.
With over 30 years’ experience of the theoretical and practical issues involved in L2 teaching, learning and assessment, she has provided expert assistance for test development projects worldwide. She regularly teaches, writes and presents on language testing matters and has authored or edited several volumes in the Cambridge University Press Studies in Language Testing series, including Examining Speaking (2011) and Examining Listening (2013).
1 Introduction
It has long been suggested that double marking of spoken performance is essential to establish scoring validity for a speaking test and to ensure fairness to test-takers (e.g. AERA, APA and NCME, 1999). However, despite its desirability, double marking in speaking assessment is costly and often considered to be difficult, if not impossible, due to practical constraints when it comes to large-scale test operationalisation.
What makes the double marking of spoken performance difficult is the here-and-now nature of the spoken language that raters need to assess. Some examination boards employ two examiners who do ‘live’ rating during the test sessions, and others record the test sessions to be double-marked later. It is indeed costly to have two examiners present at every test session, and it can be logistically complex to record and send the test-taker performance to raters post hoc (Taylor, 2007). However, rapid advances in computer technology over the past decade have made the gathering and transmission of test-takers’ recorded performances much easier in a sound or video format, and this has facilitated changes in the practice of a number of examination boards as far as the marking and delivery of speaking tests are concerned. This seems a good moment, therefore, to investigate different modes of rating the IELTS Speaking test so that the IELTS partners have the necessary information for making informed decisions on appropriate rating methods for the future.
Current IELTS Speaking practice involves single marking on four analytic rating categories, i.e. Fluency and Coherence, Lexical Resource, Grammatical Range and Accuracy, and Pronunciation (hereafter referred to as Fluency, Lexis, Grammar and Pronunciation), carried out by an examiner who plays the dual role of interlocutor and rater. Although all speaking test sessions are audio recorded (and thus ready to be second-marked whenever required), the proportion of samples sent for double marking as a routine quality assurance procedure is, presumably, limited. In light of recent advances in technology, it seems important to explore how a systematic double-marking procedure for score reporting (rather than as a post hoc quality assurance procedure) might be effectively introduced for IELTS Speaking. With this in mind, this study compares IELTS examiners’ scores and rating behaviours when they assess test-takers’ video-recorded and audio-recorded performances under non-live testing conditions. The examiners’ scores and behaviours are also compared with those obtained under the live testing conditions.
The results of this study will offer a better understanding of examiners’ perceptions towards test-takers’ spoken performance in the three modes of rating (video, audio and live), and will suggest enhanced double-marking methods that could be introduced to the IELTS Speaking Test. The findings will also help to refine rater training materials to be used under both live and non-live rating conditions. In addition, broader implications will be provided for the construct(s) to be assessed in different speaking formats in relation to the availability of test-takers’ visual information to examiners. This will contribute to a better understanding of the extent to which raters, whether or not they also serve as an interlocutor, are co-constructing speaking test performance across different modes of rating, thus enabling better test specifications regarding raters’ roles in speaking tests (e.g. Ducasse, 2010; May 2011; McNamara, 1997).
2 Background to the research
This section will first give an overview of various rating systems currently employed in major international examinations (Section 2.1 and Table 1), then review relevant research (2.2), and describe the relevance of this study for the IELTS Speaking Test (2.3).
2.1 Rating systems in major international examinations
As stated above, not many examination boards conduct double marking for reporting scores to the test-takers. Like IELTS Speaking, some face-to-face tests employ a singlemarking system with a human rater (e.g. Trinity). For online tests in a semi-direct format, the audio-recorded spoken performance may be single-rated by a human rater (e.g. TOEFL) or a machine (e.g. Pearson). On the other hand, there are some boards that employ double marking with two raters, such as the General English Proficiency Test (GEPT) in Taiwan and many of the Cambridge English exams; both use a live doublemarking system with two examiners present at the test sessions. Both of the examiners assess test-takers’ live-performance; one plays a dual role as an interlocutor/rater with a holistic scale, while the other only observes and assesses with an analytic scale. Combining holistic and analytic rating in this way contributes to capturing the multi dimensional picture of test-takers’ spoken performance (Taylor and Galaczi, 2011), as well as leading to greater scoring reliability through multiple observations.
Gathering multiple observations can be achieved by different means. One is to conduct ‘part rating’. For example, in BULATS Online Speaking, audio recordings of different parts are sent to different raters. Another possibility, which is more similar to live double marking, is to have a double-marking system with a live examiner and a post hoc rater who rates the recorded performance (e.g. BULATS Speaking, TEAP in Japan). While this may be more cost-effective than having two examiners present during each test session, research is still needed as to which aspects of spoken performance may be more suitably assessed via different recording formats (i.e. sound or video) and through live rating.
Table 1: Summary of rating systems of speaking in international examinations
| Exam | No. of test-taker(s): No. of examiner(s) & test format | Examiner role(s) | Approach to rating (modes / part rated) | % of routine double marking | Rating scale (No. of criteria) |
|---|---|---|---|---|---|
| Cambridge General English Exams | 2/3:2 face-to-face | *E1: interlocutor/rater E2: rater only | Double marking by 2 human raters 1 E1: live / whole E2: live / whole | unknown | E1: holistic E2: analytic (3-5) |
| Cambridge BEC | 2:2 face-to-face | E1: interlocutor/rater E2: rater only | Double marking by 2 human raters 2,3 E1: live / whole E2: live / whole | unknown | E1: holistic E2: analytic (4) |
| Cambridge BULATS Speaking | 1:1 face-to-face | Interlocutor/rater | Double marking by 2 human raters 4 E: live / whole **R: non-live (audio) / whole | unknown | E: holistic R: analytic (6) |
| Cambridge BULATS Online Speaking | 1:0 semi-direct | n/a | Single marking by a human rater per part R: non-live (audio) / part | 0% 5 | holistic |
| TOEFL (computer-delivered) | 1:0 semi-direct | n/a | Single marking by a human rater per part 6 R: non-live (audio) / part | unknown | holistic |
| Pearson Test of Academic English | 1:0 semi-direct | n/a | Single marking by automated scoring | unknown | n/a |
| Trinity GESE and ISE Exams | 1:1 face-to-face | Interlocutor/rater | Single marking by a human rater 7 E: live / part | 30% 7 | holistic |
| GEPT (LTTC) | 2/3:2 face-to-face | E1: interlocutor/rater E2: rater only | Double marking by 2 human raters 8 E1: live / whole E2: live / whole | unknown | E1: holistic E2: analytic (6) |
| IELTS | 1:1 | Interlocutor/rater | Single marking by a human rater E: live / whole | unknown | analytic (4) |
Notes. *E = Examiner; **R = Rater; 1 Taylor and Galaczi (2011: 183); 2 Booth (2003: 20); 3 O’Sullivan (2006: 170-71); 4 O’Sullivan (2006: 71); 5 Khabbazbashi (2013, personal communication); 6 Xi & Mollaun (2009); 7 Boyd (2012, personal communication); 8 Wu (2013, personal communication).
In addition, exploring this issue may be beneficial for the routine double marking that is currently conducted by testing boards for quality assurance purposes. Although many of the tests do not publish details (as shown in Table 1), routine double marking can require considerable resources from the exam boards, taking into account that the percentage of recorded samples sent for second marking can be as high as 30% (e.g. Trinity). Usually in routine double marking, raters assess audio-recorded samples with the same rating scale that is used for live rating. Whether the rating behaviour for such audio-recorded samples is comparable to that for live performance, however, has not been investigated. Thus, it is undoubtedly important to examine the rating behaviour involved in different modes of double-rating.
2.2 Studies into audio and video recorded spoken performance
2.2.1 Audio and video rating in speaking assessment
The issue of double marking and its modes was actually investigated about two decades ago on the pre-2001 version of the IELTS Speaking Test. Styles (1993) set out to investigate a commonly-held assumption among examiners that using video recordings would be more reliable, in terms of both inter- and intra-rater reliability, than using audio recordings. Style’s study involved three examiners and 30 test-takers, and inter- and intra-rater correlations obtained from the post hoc audio rating proved to be noticeably higher than those for the post hoc video rating. However, interpretation of the results requires some caution, due to the poorer sound quality of the audio recordings and the possibility that the ability of the audio and video groups might not have been equivalent.
Another IELTS-related study that addressed modes of double marking in the pre-2001 test is by Conlan et al. (1994). Their objective was to establish the intra-rater reliability of live and audio-taped interviews, rated by the same examiner, from an introspective and ethnographic perspective. The study used 27 IELTS test-takers and three experienced examiners. The finding that in 10 out of 27 cases the audio recording was scored a band lower than the live interview suggests that some examiners’ styles take more account of extra linguistic, paralinguistic and non-linguistic data than others. There appeared to be less chance of a discrepancy between the two scores when the primarily linguistic features (e.g. fluency, use of particular linguistic forms, vocabulary) were taken as the point of focus by examiners and the slightly more peripheral features (e.g. gestures, confidence, eye contact, posture) were given less attention.
A methodological shortcoming of the study by Conlan et al. is that the examiners retrospective reports were recorded immediately after each interview and sent back to the researchers, which did not allow the researchers to ask any further questions to probe rater attitude and behaviour.
Three implications are drawn from these two studies related to the modes of double marking for IELTS Speaking. Firstly, the current research should use good quality recordings. Secondly, the same test-takers’ performance should be rated under the audio and video conditions, rather than the test-takers’ performance divided into two groups according to the format of recordings. Thirdly, the research design should include stimulated recall, using audio and video recordings that they have rated, so that the rating behaviour can be examined more closely.
2.2.2 Differential listening perceptions of speech samples delivered by different modes
The two studies above seem to agree that using audio recording with a focus on linguistic aspects of the performance may increase rater reliability, because video recordings include visual, contextual information, which may direct some examiners attention away from linguistic aspects of the spoken text, and thus lead to greater variation in the ratings.
Research into listening perceptions of speech samples has long suggested that listeners rely on visual information in understanding the spoken text (e.g. Raffler-Engel, 1980; Burgoon, 1994). Likewise, some researchers investigated test-takers’ listening comprehension across different modes of material presentation, and concluded that presenting video facilitates understanding better than audio-only materials because of the presence of visual and contextual information, although there are some individual differences (e.g. Wagner, 2008; 2010). While using video materials may enhance face validity, other researchers have shown concerns that it may lead to distraction, because visual information may impose additional demands upon attention (e.g. Bejar et al., 2000).
In contrast to the field of listening tests, there has not been much research concerning the influences of different modes of material presentations on raters in speaking tests (i.e. live, audio, or video rating of test-taker performance). Together with the implications drawn from the two earlier IELTS studies, the current research was designed to fill this gap by looking into the ratings and rating behaviour in depth.
2.3 Relevance to IELTS
Although the traditional face-to-face nature of the IELTS Speaking Test is one of its greatest advantages for the purpose of eliciting test-takers’ language in interaction, considerations could be made to introduce different test delivery and rating methods, such as online face-to-face test delivery and keeping the delivery the same but gathering performance data in a video format. Whether or not the current technology can allow fully effective operationalisation of some techniques such as online face-to-face test delivery is still under investigation (Nakatsuhara et al., 2016), it is worth considering different rating options, given the likelihood of further advances in computer technology.
Due to the increasing demands for demonstrating evidence of scoring validity, it is vital to investigate at this point how examiners may/may not direct their attention to different aspects of test-taker performance under different rating conditions, and to explore possible double-marking methods for the IELTS Speaking Test.
The findings of this study will:
- offer a better understanding of examiners’ rating behaviour when assessing live, with audio or with video recordings
- offer a better understanding of the advantages and disadvantages of different modes of double-rating, suggesting what language aspects are attended to by audio or video rating methods
- suggest enhanced double-rating methods for the IELTS Speaking Test
- help to refine both live and non-live examiner training guidelines for the IELTS Speaking Test so as to ensure greater consistency in their scoring
- offer broader implications for the construct(s) tested by different speaking formats in relation to the availability of test-takers’ visual information to examiners.
3 Research questions
This research addresses three research questions to explore similarities and differences between examiners’ behaviours under audio, video and live rating conditions.
RQ1: Are there any differences in examiners’ scores when they assess audio recorded and video recorded test-takers’ performance, under non-live rating conditions? And how do their scores compare with the live rating outcomes?
RQ2: Are there any differences (according to examiners’ written commentaries) in the volume and nature of positive and negative features of test-takers’ performance that examiners report noticing when awarding scores under the non-live audio and video rating conditions?
RQ3: Are there any differences (according to examiners’ verbal report data) in examiners’ perceptions towards test-takers’ performance between the non-live audio and video rating conditions?
4 Research design
This study involved both existing and new datasets. The existing data were collected in Nakatsuhara’s (2012) IELTS funded research titled The relationship between test-takers’ listening proficiency and their performance on the IELTS Speaking Test.
The existing data relevant to the current study and the data newly collected for the current study are summarised below. More details will be provided in Sections 4.2 and 4.3.
Existing data
- Audio and video recordings of 36 IELTS Speaking Test sessions (scores ranging from 3.0 to 8.0).
- Live rating scores: Scores awarded by three trained IELTS examiners during the live test sessions (12 test-takers per examiner). Part scores were given to Part 2 and Part 3 of the test separately (Note: Part scores were available as a result of the ‘experimental’ live test sessions).
- Live rating commentaries: The three examiners’ written comments on the reasons why they awarded the scores that they did on each analytical category on Parts 2 and 3, during the live testing sessions.
- Audio rating scores: Scores awarded on Parts 2 and 3 separately, by four trained IELTS examiners under a non-live rating condition using audio recordings of the test-takers’ performances (Note: Three of the four examiners were the same as the live test examiners; for audio rating, one more examiner was added to the three examiners who carried out the live test sessions. This was to establish connectivity between examiners to enable the FACETS analysis).
- Audio rating commentaries: The four examiners’ written comments to justify their scores on each analytical category on Parts 2 and 3, under the non-live audio rating condition.
Newly collected data
-
Video rating scores: Scores awarded on Parts 2 and 3 separately, by four trained IELTS examiners, under a non-live rating condition using the video recordings of test-takers’ performances.
-
Video rating commentaries: The four examiners’ written comments on the reasons why they awarded the scores that they did on each analytical category on Parts 2 and 3, under the non-live video rating condition.
-
Verbal report for audio rating: Four examiners’ verbal reports on assessing four test-takers’ audio recorded performances.
-
Verbal report for video rating: Four examiners’ verbal reports on assessing four test-takers’ video recorded performances.
4.1 Participants
Data analysed in this study were gathered from a total of six trained IELTS examiners (Examiner ID: A, B, C, D, E, F). Initially, all four examiners who participated in Nakatsuhara’s (2012) research were contacted again and invited to participate in the new data collection. However, two of them (Examiner ID: B, C) were retired and no longer certified as examiners at the time of the new data collection. Therefore, the other two examiners who participated in the 2012 research and who were still certified (Examiner ID: A, D), and two new examiners (Examiner ID: E, F) were recruited to take part in the new data collection.
As mentioned above, this study used the existing audio and video recordings of 36 test-takers’ performances. The 36 test-takers were pre-sessional course students at a UK university at the time of the data collection. Of the 36 participants, 17 were male (47.2%) and 19 were female (52.8%). They were all approximately 20 years old (mean: 19.34, SD: 1.31), and the length of stay in the UK ranged from 1 month to 24 months (mean: 7.72, SD: 4.88). Twenty-eight (28) were from the People’s Republic of China (L1: Chinese), while the rest included five from Hong Kong (L1: Cantonese), one from Kazakhstan (L1: Kazakh), one from Oman (L1: Arabic) and one from Kuwait (L1: Arabic).
Arabic, Chinese and Kazakh were in the top 40 first language backgrounds of 2012 IELTS candidature. The participants’ IELTS Speaking bands under the live and audio rating conditions ranged from 3.0 to 8.0. Therefore, although L1 Chinese participants were dominant, the test-taker profiles were considered to be sufficiently representative of the annual live test population for IELTS (Information taken from http://www.ielts.org/ researchers/analysis-of-test-data/test-taker-performance-2012.aspx).
4.2 New data collection
Video rating
Four trained IELTS examiners (including the two examiners who participated in the 2012 study) carried out video rating of the 36 test-takers’ speaking tests.
Each video recording was independently rated by two of the four examiners. The rating followed a matrix that was designed to have all six examiners overlap with one another. This was to allow the FACETS program to calibrate speaking scores that take account of examiner harshness levels, as well as allowing the newly awarded video rating scores to be on the same logit scale as the previous live and audio scores.
Tables 2 and 3 below summarise the types of rating that the six examiners carried out, and show how the six examiners were overlapped with each other. To reiterate, the six examiners were Examiners B and C who participated only in the 2012 study, Examiners A and D who participated in both the 2012 and current studies, and Examiners E and F who participated only in the new data collection.
As illustrated in Table 3, to obtain comparable quality of rating under the video rating condition, the video recordings were edited to separate the test-takers’ performances on Part 2 from those on Part 3, and a mixture of separate Part 2 and Part 3 recordings from different test-takers was given to the examiners.
Table 2: Examiners involved in live, audio and video ratings
| Examiner ID | A | B | C | D | E | F | |
|---|---|---|---|---|---|---|---|
| Existing data | Live examiners | X | X | X | |||
| Existing data | Audio examiners | X | X | X | X | ||
| Newly collected data | Video examiners | X | X | X | X |
Table 3: Rating matrix
| Test-Taker ID | Task prompt | Part 2 live examiner | Part 2 audio Exmr 1 | Part 2 audio Exmr 2 | Part 2 video Exmr 1 | Part 2 video Exmr 2 | Part 3 live examiner | Part 3 audio Exmr 1 | Part 3 audio Exmr 2 | Part 3 video Exmr 1 | Part 3 video Exmr 2 |
|---|---|---|---|---|---|---|---|---|---|---|---|
| s01 | 1 | A | A | D | E | F | A | C | D | A | E |
| s02 | 2 | A | A | D | E | F | A | C | D | A | E |
| s03 | 1 | A | A | D | E | F | A | C | D | A | E |
| s04 | 2 | A | A | D | E | F | A | C | D | A | E |
| s05 | 1 | A | A | D | E | F | A | C | D | A | E |
| s06 | 2 | A | A | D | E | F | A | C | D | A | E |
| s07 | 2 | A | A | D | E | F | A | B | D | A | E |
| s08 | 1 | A | A | D | E | F | A | B | D | A | E |
| s09 | 2 | A | A | D | E | F | A | B | D | A | E |
| s10 | 1 | A | A | D | F | A | A | B | D | F | D |
| s11 | 2 | A | A | D | F | A | A | B | D | F | D |
| s12 | 1 | A | A | D | F | A | A | B | D | F | D |
| s13 | 2 | B | A | D | F | A | B | A | D | F | D |
| s14 | 1 | B | A | D | F | A | B | A | D | F | D |
| s15 | 2 | B | A | D | F | A | B | A | D | F | D |
| s16 | 1 | B | A | D | F | A | B | A | D | F | D |
| s17 | 2 | B | A | D | F | A | B | A | D | F | D |
| s18 | 1 | B | A | D | F | A | B | A | D | F | D |
| s19 | 1 | B | C | D | A | D | B | A | D | E | D |
| s20 | 2 | B | C | D | A | D | B | A | D | E | D |
| s21 | 1 | B | C | D | A | D | B | A | D | E | D |
| s22 | 2 | B | C | D | A | D | B | A | D | E | D |
| s23 | 1 | B | C | D | A | D | B | A | D | E | D |
| s24 | 2 | B | C | D | A | D | B | A | D | E | D |
| s25 | 1 | C | B | D | A | D | C | A | D | E | D |
| s26 | 2 | C | B | D | A | D | C | A | D | E | D |
| s27 | 2 | C | B | D | A | D | C | A | D | E | D |
| s28 | 1 | C | B | D | D | E | C | A | D | A | F |
| s29 | 1 | C | B | D | D | E | C | A | D | A | F |
| s30 | 2 | C | B | D | D | E | C | A | D | A | F |
| s31 | 1 | C | A | D | D | E | C | A | D | A | F |
| s32 | 2 | C | A | D | D | E | C | A | D | A | F |
| s33 | 1 | C | A | D | D | E | C | A | D | A | F |
| s34 | 2 | C | A | D | D | E | C | A | D | A | F |
| s35 | 1 | C | A | D | D | E | C | A | D | A | F |
| s36 | 2 | C | A | D | D | E | C | A | D | A | F |
*Exmr: Examiner
Examiners’ written commentaries
The examiners were also asked to make notes (using a one-page pro forma provided by the researchers) on why they awarded the scores that they did on each of the four analytical categories. Compared with the verbal report methodology (as described below), a written description is likely to be less informative. However, given the ease of collecting larger datasets in this manner, it was considered worthwhile obtaining brief notes from examiners to supplement a small quantity of verbal report data (e.g. Isaacs, 2010).
Verbal report on audio and video rating
Next, four test-takers’ (Test-taker ID: S04, S05, S09, S29) audio and video recordings were selected for collecting examiners’ verbal report data. The four recordings included a performance approximately at IELTS band 4.0, 5.0, 6.0 and 7.0 to cover a range of performances (highlighted in red in Figure 1 in Section 5.1 for the four test-takers’ IELTS bands).
The four trained IELTS examiners who carried out the video ratings (Examiners A, D, E, F) participated in verbal report sessions. Verbal report methodology has been employed in a number of recent speaking test studies and has proved to be an effective method for gaining useful insights into examiners’ scoring processes (e.g. Brown et al., 2005; Brown, 2006; May 2009, 2011).
The examiners first received a tutorial that introduced the procedures for verbal report protocols. Following the procedure used in May (2011), verbal reports were collected in two phases for both audio and video verbal reporting, using stimulated recall methodology (Gass and Mackey, 2000).
- Phase 1: Examiners listened to the entire audio speech sample without pausing, gave a score and made general oral comments about a test-taker’s overall task performance.
- Phase 2: Examiners listened to the speech sample once again, and were asked to pause a recording whenever necessary and make oral comments about any features that they found interesting or salient related to the four analytic categories.
The same procedures were also used for video verbal reporting. The order of video and audio verbal reporting sessions for the four examiners was counter-balanced as illustrated in Table 4 below. Other counter-balanced designs were also considered, but the design shown in Table 4 was thought to be most appropriate to elicit examiners’ comparative comments between the two modes. However, it should be noted that the four examiners were also instructed to try not to refer to what they had heard/watched before and to start each rating as for a new test-taker. This was to minimise any effects of the rating of a test-taker in one mode on the following rating of the same test-taker in the other mode.
Two parallel verbal reporting sessions were carried out over two days (i.e. two examiners each on Day 1 and Day 2). All sessions were facilitated by two of the three researchers, and all verbal report sessions were audio recorded.
Table 4: Verbal reporting sessions: counter-balanced design
| Day 1 - Examiner A | Day 1 - Examiner F | Day 2 - Examiner D | Day 2 - Examiner E |
|---|---|---|---|
| Student 1 Audio P2* | Student 2 Audio P2 | Student 3 Video P3 | Student 4 Video P3 |
| Student 1 Video P2 | Student 2 Video P2 | Student 3 Audio P3 | Student 4 Audio P3 |
| Student 2 Video P2 | Student 3 Video P2 | Student 4 Audio P3 | Student 1 Audio P3 |
| Student 2 Audio P2 | Student 3 Audio P2 | Student 4 Video P3 | Student 1 Video P3 |
| Student 3 Audio P2 | Student 4 Audio P2 | Student 1 Video P3 | Student 2 Video P3 |
| Student 3 Video P2 | Student 4 Video P2 | Student 1 Audio P3 | Student 2 Audio P3 |
| Student 4 Video P2 | Student 1 Video P2 | Student 2 Audio P3 | Student 3 Audio P3 |
| Student 4 Audio P2 | Student 1 Audio P2 | Student 2 Video P3 | Student 3 Video P3 |
| Student 1 Audio P3** | Student 2 Audio P3 | Student 3 Video P2 | Student 4 Video P2 |
| Student 1 Video P3 | Student 2 Video P3 | Student 3 Audio P2 | Student 4 Audio P2 |
| Student 2 Video P3 | Student 3 Video P3 | Student 4 Audio P2 | Student 1 Audio P2 |
| Student 2 Audio P3 | Student 3 Audio P3 | Student 4 Video P2 | Student 1 Video P2 |
| Student 3 Audio P3 | Student 4 Audio P3 | Student 1 Video P2 | Student 2 Video P2 |
| Student 3 Video P3 | Student 4 Video P3 | Student 1 Audio P2 | Student 2 Audio P2 |
| Student 4 Video P3 | Student 1 Video P3 | Student 2 Audio P2 | Student 3 Audio P2 |
| Student 4 Audio P3 | Student 1 Audio P3 | Student 2 Video P2 | Student 3 Video P2 |
*P2=Part 2; **P3=Part 3
4.3 Data analysis
Scores awarded under the live, audio and video rating conditions were calibrated using the multifaceted Rasch model (MFRM) analysis using FACETS 3.71.3 (Linacre, 2013), to examine whether there were any statistically significant differences between the three rating conditions, after taking account of examiner severity levels and other sources of score variance. It also assessed the level of examiner consistency across the three modes of rating.
All written comments provided by the examiners under the three rating conditions were typed out and organised in spreadsheet format. The written commentaries on each of the four analytic criteria were then categorised according to their positive and/or negative performance features described as reasons for the scores awarded, and the degree of positiveness was quantified and compared between the audio and video rating conditions. This was to examine whether either mode of non-live rating leads to examiners attention being oriented to more positive or negative aspects of test-takers’ output related to each analytical category.
To measure the degree of positiveness, all examiner comments were classified into three categories: (1) Negative, (2) Both negative and positive, and (3) Positive. When comments could not be classified in terms of their positiveness, they were coded as Unclassified and treated as missing data. More detailed explanation of the three categories with some examples is presented in Section 5.2. The numbers of comments under the three categories were then compared between the two non-live rating modes. Although the focus here was not on comments given under the live test condition, live comments were also analysed in the same manner in order to offer a better understanding of similarities and differences between the two non-live conditions as against the live condition.
All verbal report recordings were carefully examined, and all the parts where the examiners referred to their rating behaviours and their perceptions towards test-takers’ performance under the audio and video conditions were transcribed. Two researchers who facilitated verbal report sessions with four examiners took detailed observational notes during the verbal report sessions, and recorded examiners’ comments. Their notes were helpful when listening to the audio recordings once again to identify relevant parts to transcribe.
Detailed coding schemes were developed while analysing the transcribed data. Emerging topics and comments were then captured in spreadsheet format so they could be coded and categorised according to different main themes and sub-themes, such as:
Main theme: Video providing a fuller picture of communication
Sub-theme a) Video helps examiners understand what test-takers are saying
Sub-theme b) Video helps examiners understand what test-takers are doing when dysfluency or awkwardness occurs
The thematic content of verbal reports was then discussed for any similarities and differences in examiners’ perceptions towards test-takers’ performance under the two non-live rating conditions. Careful attention was paid to whether there are any analytical categories to which the examiners attended more. Wherever appropriate, the verbal report findings were discussed in conjunction with the score and comment analysis results, to triangulate and elaborate on the other two findings.
Methods of data analysis are discussed in greater detail in Section 5.1 (Rating score analysis), Section 5.2 (Examiners’ written comment analysis) and Section 5.3 (Verbal report analysis).
5 Results
5.1 Rating score analysis
5.1.1 Score analysis
Multiple sets of multifaceted Rasch model (MFRM) analysis were carried out to answer RQ1: Are there any differences in examiners’ scores when they assess audio recorded and video recorded test-takers’ performance, under non-live rating conditions? And how do the scores compare with the live rating outcomes?
Six-facet analysis (with all rating scales)
First of all, to gain an overall picture of the research results, a partial credit model analysis was carried out using six facets as potential sources for score variance: test-taker (S01-S36), test version (interest, parties), examiner (A-F), test part (parts 2 and 3), rating mode (live, audio, video), and rating scale (Fluency, Lexis, Grammar and Pronunciation).
Figure 1 shows the overview of the results of the six-facet analysis, plotting estimates of test-taker ability, test version difficulty, examiner severity, test part difficulty, rating mode difficulty, and rating scale difficulty. They were all measured by the uniform unit (i.e. logits) shown on the left side of the map labelled “measr” (measure), making it possible to directly compare all the facets.
In Figure 1, the more able test-takers are placed towards the top and the less able towards the bottom. All the other facets are negatively scaled, placing the more difficult items and harsher examiners towards the top. The right-hand columns (‘Flu’, ‘Lex’, ‘Gra’, Pro’) refer to the levels of the four analytical rating scales.
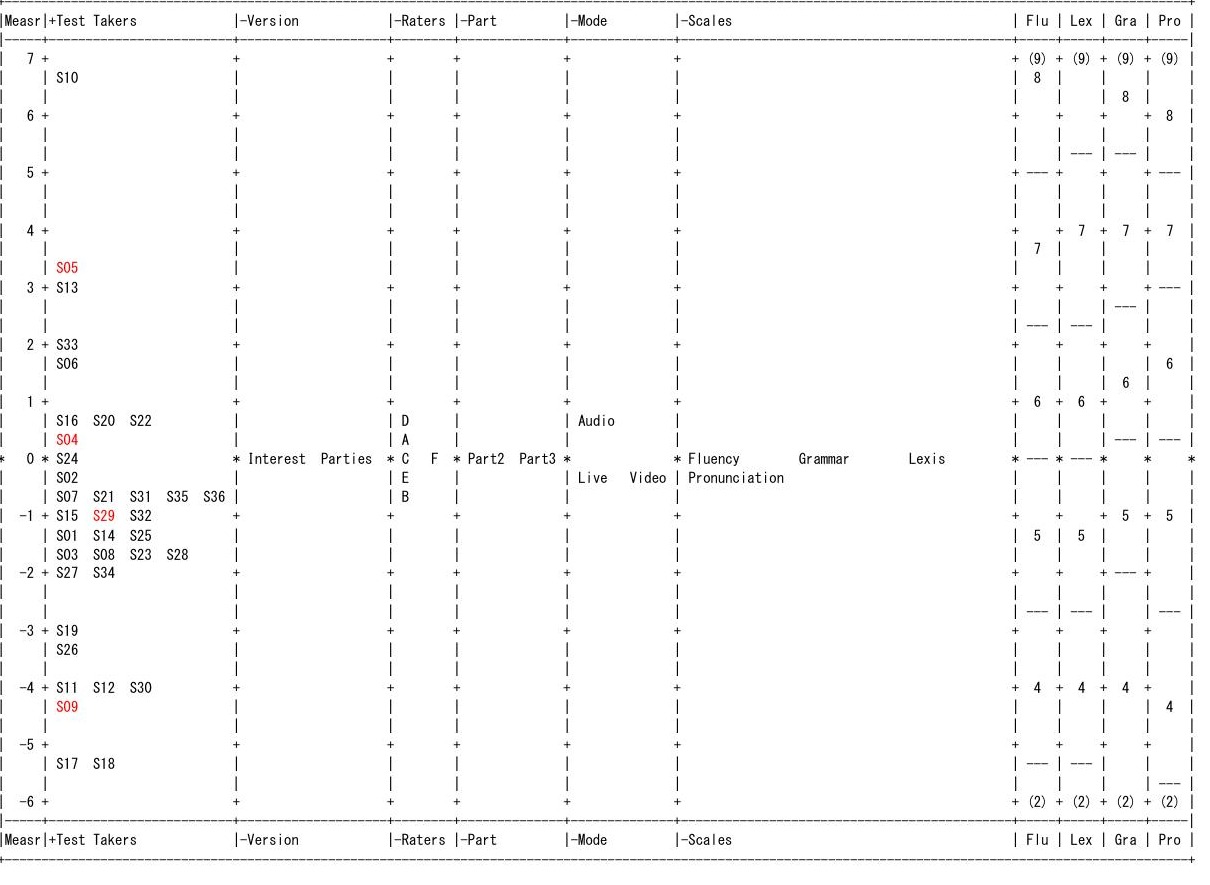
Figure 1: All facet vertical rulers on rating scores (Note: Four test-takers selected for verbal reports are highlighted in red)
Table 5: Test version measurement report
| Measure | Real S.E. | Observed Average | Fair (M) Average | Infit MnSq | |
|---|---|---|---|---|---|
| Interest | -.03 | .06 | 5.08 | 5.07 | .81 |
| Parties | .03 | .07 | 4.91 | 5.05 | 1.14 |
Fixed (all same) chi-square: .5, d.f.: 1, significance: .48
Table 6: Examiner measurement report
| Measure | Real S.E. | Observed Average | Fair (M) Average | Infit MnSq | |
|---|---|---|---|---|---|
| Examiner B | -.79 | .14 | 5.31 | 5.37 | .93 |
| Examiner E | -.48 | .13 | 5.42 | 5.24 | .79 |
| Examiner F | .13 | .14 | 5.15 | 5.01 | .93 |
| Examiner C | .14 | .14 | 5.07 | 5.01 | 1.09 |
| Examiner A | .24 | .08 | 5.00 | 4.97 | 1.09 |
| Examiner D | .76 | .08 | 4.66 | 4.79 | .95 |
Fixed (all same) chi-square: 125.4, d.f.: 5, significance: .00
Table 7: Test part measurement report
| Measure | Real S.E. | Observed Average | Fair (M) Average | Infit MnSq | |
|---|---|---|---|---|---|
| Part 2 | -.09 | .06 | 5.02 | 5.09 | .97 |
| Part 3 | .09 | .06 | 4.97 | 5.03 | 1.00 |
Fixed (all same) chi-square: 4.1, d.f.: 1, significance: .04
Table 8: Rating mode measurement report
| Measure | Real S.E. | Observed Average | Fair (M) Average | Infit MnSq | |
|---|---|---|---|---|---|
| Live | -.42 | .10 | 5.31 | 5.22 | 1.09 |
| Video | -.25 | .07 | 5.14 | 5.16 | 1.01 |
| Audio | .68 | .07 | 4.70 | 4.81 | .91 |
Fixed (all same) chi-square: 122.2, d.f.: 2, significance: .00
Table 9: Rating scale measurement report
| Measure | Real S.E. | Observed Average | Fair (M) Average | Infit MnSq | |
|---|---|---|---|---|---|
| Pronunciation | -.36 | .10 | 5.09 | 5.12 | 1.12 |
| Fluency | .10 | .09 | 5.02 | 5.11 | .95 |
| Grammar | .11 | .09 | 4.89 | 4.91 | .96 |
| Lexis | .15 | .09 | 4.99 | 5.09 | .93 |
Fixed (all same) chi-square: 20.6, d.f.: 3, significance: .00
Five-facet analysis (within each rating scale)
Following the overall analysis using a partial credit model, four sets of rating scale model analyses were carried out with five facets within each of the rating categories (i.e. Fluency, Lexis, Grammar and Pronunciation). The five facets are test-taker, test version, examiner, test part, and one of the analytical scales under the three conditions (e.g. fluency live, fluency audio, fluency video).
The reason for conducting this analysis was to investigate the effects of rating modes on each of the four rating scales. The difference with the six-facet analysis above lies in the conceptualisation of the rating scales in each mode as items. In this analysis, each rating scale under each rating condition is treated as a separate item, allowing for investigation of differential effects of rating modes on scores on four analytical rating scales. It also assesses whether or not the difference in modes is leading to significant differences in scores within each of the rating categories.
In the interest of space, only the rating scale measurement reports are presented in Tables 10-13. However, all measurement reports were examined for model fitness, and no misfitting item was identified. What is most notable in Tables 10-13 is that the audio condition is consistently the most difficult in all rating categories. For Pronunciation, Grammar and Lexis, the live and video modes are almost comparable in terms of difficulty. Fluency, however, showed a relatively larger difference in difficulty between the two modes, with the live condition being easier than the video condition. All four sets of analyses indicate that the mode of rating significantly contributed to overall score differences in all four rating categories (Fluency: , , Lexis: , , Grammar: , , Pronunciation: , ).
To identify where the overall difference in each rating category originated, paired comparisons were performed between the live and audio rating modes, the audio and video rating modes, and the live and video rating modes. According to the Bonferroni correction, a more stringent alpha level at 0.0167 (i.e. 0.05/3) was used here to assess significance.
The results are illustrated at the bottom of Tables 10-13, confirming the abovementioned descriptive observations. The overall significant difference reflected the significant differences only between the live and audio modes and the audio and video modes for Lexis, Grammar and Pronunciation, while all paired comparisons were significant for Fluency. The differences in fair average scores across the three modes range from 0.41 to 0.46. The findings of these paired comparisons are also summarised in Table 14.
Table 10: Fluency measurement report
| Measure | Real S.E. | Observed Average | Fair (M) Average | Infit MnSq | |
|---|---|---|---|---|---|
| Fluency (live) | -.75 | .20 | 5.41 | 5.32 | 1.04 |
| Fluency (video) | .11 | .15 | 5.10 | 5.06 | 1.03 |
| Fluency (audio) | .64 | .15 | 4.72 | 4.91 | .85 |
Fixed (all same) chi-square: 32.1, d.f.: 2, significance: .00
Paired comparisons
[Live and Audio] Fixed (all same) chi-square: 27.3, d.f.: 1, significance: .00
[Audio and Video] Fixed (all same) chi-square: 6.2, d.f.: 1, significance: .01
[Live and Video] Fixed (all same) chi-square: 17.9, d.f.: 1, significance: .00
Table 11: Lexis measurement report
| Measure | Real S.E. | Observed Average | Fair (M) Average | Infit MnSq | |
|---|---|---|---|---|---|
| Lexis (video) | -.42 | .14 | 5.05 | 5.08 | .98 |
| Lexis (live) | -.33 | .19 | 5.18 | 5.05 | .93 |
| Lexis (audio) | .75 | .15 | 4.57 | 4.63 | .95 |
Fixed (all same) chi-square: 36.0 d.f.: 2, significance: .00
Paired comparisons
[Live and Audio] Fixed (all same) chi-square: 15.6, d.f.: 1, significance: .00
[Audio and Video] Fixed (all same) chi-square: 32.1, d.f.: 1, significance: .00
[Live and Video] Fixed (all same) chi-square: 0.05, d.f.: 1, significance: .95
Table 12: Grammar measurement report
| Measure | Real S.E. | Observed Average | Fair (M) Average | Infit MnSq | |
|---|---|---|---|---|---|
| Grammar (video) | -.42 | .14 | 5.06 | 5.09 | .99 |
| Grammar (live) | -.34 | .19 | 5.18 | 5.05 | .95 |
| Grammar (audio) | .76 | .15 | 4.57 | 4.63 | .96 |
Fixed (all same) chi-square: 36.4 d.f.: 2, significance: .00
Paired comparisons
[Live and Audio] Fixed (all same) chi-square: 15.6, d.f.: 1, significance: .00
[Audio and Video] Fixed (all same) chi-square: 31.5, d.f.: 1, significance: .00
[Live and Video] Fixed (all same) chi-square: 0.09, d.f.: 1, significance: .84
Table 13: Pronunciation measurement report
| Measure | Real S.E. | Observed Average | Fair (M) Average | Infit MnSq | |
|---|---|---|---|---|---|
| Pronunciation (live) | -.46 | .20 | 5.35 | 5.29 | 1.01 |
| Pronunciation (video) | -.42 | .16 | 5.22 | 5.27 | 1.10 |
| Pronunciation (audio) | .87 | .15 | 4.81 | 4.85 | .87 |
Fixed (all same) chi-square: 46.5 d.f.: 2, significance: .00
Paired comparisons
[Live and Audio] Fixed (all same) chi-square: 25.6, d.f.: 1, significance: .00
[Audio and Video] Fixed (all same) chi-square: 37.5, d.f.: 1, significance: .00
[Live and Video] Fixed (all same) chi-square: 0.06, d.f.: 1, significance: .91
Table 14: Summary of paired comparisons with fair average scores
| Rating category | Live | Significance | Audio | Significance | Video | Significance | Live |
|---|---|---|---|---|---|---|---|
| Fluency | 5.32 | > | 4.91 | < | 5.06 | < | 5.32 |
| Lexis | 5.05 | > | 4.63 | < | 5.08 | = | 5.05 |
| Grammar | 5.05 | > | 4.63 | < | 5.09 | = | 5.05 |
| Pronunciation | 5.29 | > | 4.85 | < | 5.27 | = | 5.29 |
Note: > = significantly larger than; < = significantly smaller than; = = no significant difference.
Table 14 shows that the audio ratings were consistently lower than the live and video ratings, and none of the fair average scores of the audio rating mode reached Band 5, although those of the live and video modes ranged from 5.05 to 5.32.
5.1.2 Bias analysis
While the score analysis has so far identified a general picture of examiners’ tendency towards scoring under the three rating conditions, as will be discussed in Section 5.3, individual examiners had slightly different approaches to assessing test-takers performance in the three modes. The research team therefore felt that it would be overgeneralisation if we showed only the overall score results without considering individual differences.
This thought motivated us to further examine the impact of rating mode on each examiner by using an extension of the MFRM analysis known as bias analysis. Bias analysis identifies unexpected but consistent patterns of behaviour which may occur due to an interaction between a particular rater (or group of raters) and other facets of the rating situation. Bias analysis was therefore used in this study to investigate any interactions between the examiner and rating mode facets.
As in Section 5.1.1, multiple sets of analyses were performed with: 1) overall six-facet analysis using a partial credit model, and 2) four sets of five-facet analyses with each of the four rating categories using a rating scale model.
Among all analyses, the six-facet analysis identified three significant interactions (see Table 15) and two pairwise interactions (see Table 16), and the five-facet analyses identified two significant pairwise interactions for Fluency (see Table 17).
Table 15: Bias/interaction report (overall six-facet analysis)
| Examiner ID | Examiner Measr | Mode | Mode Measr | Obs-Exp Average | Bias size | Model S.E. | t | d.f. | Sig. |
|---|---|---|---|---|---|---|---|---|---|
| A | .24 | Video | -.25 | -.12 | -.32 | .14 | -2.32 | 143 | .022 |
| A | .24 | Audio | .68 | .10 | .28 | .12 | 2.37 | 191 | .019 |
| D | .76 | Video | -.25 | .14 | .37 | .15 | 2.51 | 123 | .013 |
Table 16: Bias/interaction pairwise report (overall six-facet analysis)
| Examiner | Mode | Target Measr | S.E. | Obs-Exp Average | Target Contrast | Joint S.E. | t | Welch d.f. | Sig. |
|---|---|---|---|---|---|---|---|---|---|
| A | Audio | -.04 | .12 | .10 | -.60 | .18 | -3.30 | 318 | .001 |
| A | Video | .56 | .14 | -.12 | -.60 | .18 | -3.30 | 318 | .001 |
| D | Audio | .92 | .10 | -.06 | .53 | .18 | 3.01 | 285 | .003 |
| D | Video | .39 | .15 | .14 | .53 | .18 | 3.01 | 285 | .003 |
Table 17: Bias/interaction pairwise report (six-facet analysis with fluency)
| Examiner | Mode | Target Measr | S.E. | Obs-Exp Average | Target Contrast | Joint S.E. | t | Welch d.f. | Sig. |
|---|---|---|---|---|---|---|---|---|---|
| A | Audio | -.30 | .27 | .17 | -1.01 | .39 | -2.59 | 74 | .012 |
| A | Video | .71 | .29 | -.18 | -1.01 | .39 | -2.59 | 74 | .012 |
| D | Audio | 1.23 | .20 | -.09 | .83 | .37 | 2.26 | 69 | .027 |
| D | Video | .39 | .15 | .14 | .83 | .37 | 2.26 | 69 | .027 |
Table 15 shows that Examiner A had a negative bias towards video rating and a positive bias towards audio rating. Examiner D instead had a positive bias towards video rating. These biases resulted in significant pairwise interactions between audio and video ratings by the two examiners, as indicated in Table 16. The directions of these interactions were opposite; Examiner A giving a positive bias towards the audio mode and Examiner D giving a positive bias towards the video mode.
When the overall analysis was broken down to each rating category (Table 17), Fluency showed significant pairwise interactions with Examiners A and D again, with the same directions as in Table 16. This suggests that their Fluency ratings seemed to have contributed to the significant interactions on overall scores. The individual differences identified here will be revisited in conjunction with examiners’ comment analysis in Section 5.2 and verbal report analysis in Section 5.3.
5.2 Examiners’ written comment analysis
Having identified score differences between the audio and video rating modes, this section now analyses examiners’ written comments under the two non-live rating conditions, in order to address RQ2: Are there any differences in the volume and nature of positive and negative features of test-takers’ performance that examiners report noticing when awarding scores under the non-live audio and video rating conditions?
As mentioned earlier, all examiners were asked to provide short comments with regard to the reasons for their scorings on each analytical category. These comments were classified into three main categories:
- comments that refer to negative features of the test-taker’s performance (Negative)
- comments that refer to both positive and negative features of the test-taker’s performance (Positive/Negative)
- comments that refer to positive features of the test-taker’s performance (Positive).
When comments could not be classified in any of the three categories, they were coded as Unclassified and treated as missing data. Some example comments and their categories are illustrated below.
Fluency (Band 5): Uses speech markers characteristic of natural conversation (‘I’m not sure’, ‘basically’, ‘of course’) but relies heavily on repetition and does not develop topic fully. (S22, Examiner A, Part 3, Audio) Both positive and negative
Lexis (Band 6): Wide enough range to discuss topics at length. Generally paraphrases successfully, e.g., ‘eat noodles, give a wish for living longer and healthy.’ (S20, Examiner E, Part 3, Video) Positive
Grammar (Band 7): Wide variety of structures, including subordinate clauses. Some inaccuracies persist. Occasional self-corrections. Generally accurate. (S05, Examiner F, Part 2, Video) Both positive and negative
Pronunciation (Band 4): Patches that are unclear and mispronunciations are frequent. (S12, Examiner B, Part 2, Audio) Negative
Fluency (Band 4): Possible 5 in latter part but overall 4. (S01, Examiner C, Part 3, Audio) Unclassified
Categorised comments were then quantified so as to compare the audio and video modes statistically in terms of examiners’ attention paid to positive and negative performance features while they awarded scores. Although comments noted down during the live tests are not the focus of the analysis here, they were also analysed in the same way for cross-referencing purposes, since it helps to interpret similarities and differences between the two non-live rating modes.
5.2.1 Non-parametric analysis of examiners’ written comments
Table 18 below presents the frequencies and percentages of examiners’ commentaries under the three categories in the three modes of rating. Figures at or larger than 50.0% are highlighted in red, and figures between 33.3% to 49.9% are highlighted in blue.
The descriptive statistics indicate that compared to comments made in the live tests, audio and video comments refer to more negative features of the test-takers’ performance. The proportions of the three types of comments (i.e. negative, negative/ positive and positive) made on audio and video ratings were relatively similar for all categories.
Kruskal Wallis tests were performed to detect any significant differences among the three modes, and significant overall differences were found in all categories except Lexis. Post hoc comparisons were then carried out using the Man Whitney U test. Due to multiple comparisons, Bonferroni adjustment was made to the alpha level, resulting in α=0.05/3=0.0167. None of the p-values in the comparisons between the audio and video modes was significant. In contrast, the two non-live rating modes were significantly different from the live mode at the stringent alpha level except for two cases (i.e. Live vs Audio in Fluency and Live vs Video in Pronunciation), and p-values in these cases approached the stringent level too.
The results suggest that examiners orient to positive and negative features of the test-takers’ performance under the two non-live rating conditions to similar degrees, and that these performance features tend in general to be more negative than the features they would attend to while awarding scores under the live test condition.
Table 18: Comments comparisons among the three rating modes
| Category | Mode | Valid N | 1. Negative | 2. Positive/ Negative (%) | 3. Positive (%) | Mean (SD) | Kruskal Wallis Test ( ) | Post-hoc Test with Man Whitney U |
|---|---|---|---|---|---|---|---|---|
| Fluency | Live | 67 | 16 (23.9%) | 28 (41.8%) | 23 (34.3%) | 2.10 (0.76) | χ²(2)=7.64, p=0.022 | Live vs Audio: U=3899.50, Z=-2.31, p=0.021; Audio vs Video: U=9686.50, Z=-0.40, p=0.693; Live vs Video: U=3648.50, Z=-2.689, p=0.007 |
| Fluency | Audio | 143 | 56 (39.2%) | 54 (37.8%) | 33 (23.1%) | 1.84 (0.78) | χ²(2)=7.64, p=0.022 | Live vs Audio: U=3899.50, Z=-2.31, p=0.021; Audio vs Video: U=9686.50, Z=-0.40, p=0.693; Live vs Video: U=3648.50, Z=-2.689, p=0.007 |
| Fluency | Video | 139 | 55 (39.6%) | 57 (41.0%) | 27 (19.4%) | 1.80 (0.74) | χ²(2)=7.64, p=0.022 | Live vs Audio: U=3899.50, Z=-2.31, p=0.021; Audio vs Video: U=9686.50, Z=-0.40, p=0.693; Live vs Video: U=3648.50, Z=-2.689, p=0.007 |
| Lexis | Live | 70 | 27 (38.6%) | 18 (25.7%) | 25 (35.7%) | 1.97 (0.86) | χ²(2)=4.18, p=0.124 | - |
| Lexis | Audio | 144 | 74 (51.4%) | 35 (24.3%) | 35 (24.3%) | 1.73 (0.83) | χ²(2)=4.18, p=0.124 | - |
| Lexis | Video | 139 | 60 (43.2%) | 39 (28.1%) | 40 (28.8%) | 1.86 (0.84) | χ²(2)=4.18, p=0.124 | - |
| Grammar | Live | 66 | 19 (28.8%) | 22 (33.3%) | 25 (37.9%) | 2.09 (0.82) | χ²(2)=13.49, p=0.001 | Live vs Audio: U=3410.00, Z=-3.45, p=0.001; Audio vs Video: U=9402.00, Z=0.747, p=0.455; Live vs Video: U=3412.00, Z=-3.116, p=0.002 |
| Grammar | Audio | 143 | 67 (46.9%) | 55 (38.5%) | 21 (14.7%) | 1.68 (0.72) | χ²(2)=13.49, p=0.001 | Live vs Audio: U=3410.00, Z=-3.45, p=0.001; Audio vs Video: U=9402.00, Z=0.747, p=0.455; Live vs Video: U=3412.00, Z=-3.116, p=0.002 |
| Grammar | Video | 138 | 55 (39.9%) | 66 (47.8%) | 17 (12.3%) | 1.72 (0.67) | χ²(2)=13.49, p=0.001 | Live vs Audio: U=3410.00, Z=-3.45, p=0.001; Audio vs Video: U=9402.00, Z=0.747, p=0.455; Live vs Video: U=3412.00, Z=-3.116, p=0.002 |
| Pronunciation | Live | 64 | 16 (25.0%) | 38 (59.4%) | 10 (15.6%) | 1.91 (0.64) | χ²(2)=9.55, p=0.008 | Live vs Audio: U=3471.00, Z=-3.100, p=0.002; Audio vs Video: U=9391.50, Z=-0.984, p=0.325; Live vs Video: U=3641.00, Z=-2.261, p=0.024 |
| Pronunciation | Audio | 144 | 75 (52.1%) | 50 (34.7%) | 19 (13.2%) | 1.61 (0.71) | χ²(2)=9.55, p=0.008 | Live vs Audio: U=3471.00, Z=-3.100, p=0.002; Audio vs Video: U=9391.50, Z=-0.984, p=0.325; Live vs Video: U=3641.00, Z=-2.261, p=0.024 |
| Pronunciation | Video | 139 | 64 (46.0%) | 54 (38.8%) | 21 (15.1%) | 1.69 (0.72) | χ²(2)=9.55, p=0.008 | Live vs Audio: U=3471.00, Z=-3.100, p=0.002; Audio vs Video: U=9391.50, Z=-0.984, p=0.325; Live vs Video: U=3641.00, Z=-2.261, p=0.024 |
However, it was noticed during the coding stage that the extent to which individual examiners noted positive or negative features appeared to differ across the six examiners. Therefore, we decided to analyse the commentaries of all six examiners individually. Table 19 below indicates that the largest proportion of comments by Examiners B, C, E and F were generally on both positive and negative features (Positive/ Negative), while the largest proportion of comments noted by Examiners A and D were on negative features (Negative). This suggests that the latter two examiners tended to pay more attention to negative performance features when they awarded scores. This is indeed in line with the score analysis results reported earlier, which indicated that Examiner D was the harshest and Examiner A was the second harshest among the six examiners (see Table 6 in Section 5.1.1).
Table 19: Comparisons across the six examiners on all modes of rating
| Category | Examiner | Valid N | 1.Negative (%) | 2.Positive/Negative (%) | 3.Positive (%) | Mean (SD) |
|---|---|---|---|---|---|---|
| Fluency | A | 105 | 39 (37.1%) | 46 (43.8%) | 20 (19.0%) | 1.82 (0.73) |
| Fluency | B | 35 | 8 (22.9%) | 16 (45.7%) | 11 (31.4%) | 2.09 (0.74) |
| Fluency | C | 34 | 4 (11.8%) | 24 (70.6%) | 6 (17.6%) | 2.06 (0.55) |
| Fluency | D | 103 | 57 (55.3%) | 16 (15.5%) | 30 (29.1%) | 1.74 (0.89) |
| Fluency | E | 36 | 6 (16.7%) | 23 (63.9%) | 7 (19.4%) | 2.02 (0.61) |
| Fluency | F | 36 | 13 (36.1%) | 14 (38.9%) | 9 (25.0%) | 1.89 (0.78) |
| Lexis | A | 108 | 52 (48.1%) | 30 (27.8%) | 26 (24.1%) | 1.76 (0.82) |
| Lexis | B | 35 | 12 (34.3%) | 10 (28.6%) | 13 (37.1%) | 2.29 (0.86) |
| Lexis | C | 35 | 10 (28.6%) | 14 (40.0%) | 11 (31.4%) | 2.03 (0.79) |
| Lexis | D | 103 | 66 (64.1%) | 11 (10.7%) | 26 (25.2%) | 1.61 (0.87) |
| Lexis | E | 36 | 8 (22.2%) | 14 (38.9%) | 14 (38.9%) | 2.17 (0.77) |
| Lexis | F | 36 | 13 (36.1%) | 13 (36.1%) | 10 (27.8%) | 1.92 (0.81) |
| Grammar | A | 104 | 53 (51.0%) | 34 (32.7%) | 17 (16.3%) | 1.65 (0.75) |
| Grammar | B | 34 | 8 (23.5%) | 17 (50.0%) | 9 (26.5%) | 2.03 (0.72) |
| Grammar | C | 35 | 2 (5.7%) | 17 (48.6%) | 16 (45.7%) | 2.40 (0.60) |
| Grammar | D | 102 | 56 (54.9%) | 35 (34.3%) | 11 (10.8%) | 1.56 (0.68) |
| Grammar | E | 36 | 12 (33.3%) | 22 (61.1%) | 2 (5.6%) | 1.72 (0.57) |
| Grammar | F | 36 | 10 (27.8%) | 18 (50.0%) | 8 (22.2%) | 1.94 (0.71) |
| Pronunciation | A | 107 | 49 (45.8%) | 37 (34.6%) | 21 (19.6%) | 1.74 (0.77) |
| Pronunciation | B | 31 | 8 (25.8%) | 21 (67.7%) | 2 (6.5%) | 1.81 (0.54) |
| Pronunciation | C | 34 | 9 (26.5%) | 22 (64.7%) | 3 (8.8%) | 1.82 (0.58) |
| Pronunciation | D | 103 | 62 (60.2%) | 24 (23.3%) | 17 (16.5%) | 1.56 (0.76) |
| Pronunciation | E | 36 | 10 (27.8%) | 25 (69.4%) | 1 (2.8%) | 1.75 (0.50) |
| Pronunciation | F | 36 | 17 (47.2%) | 13 (36.1%) | 6 (16.7%) | 1.69 (0.75) |
Given the variability among the examiners, comments were further analysed with the MFRM analysis. Other factors that could possibly affect examiners’ orientations were also taken into consideration.
5.2.2 MFRM analysis of examiners’ written comments
To confirm the above non-parametric test results, a rating model analysis was carried out with five facets: test-taker (S01-S36), examiner (A-F), test part (2 and 3), test version (Interest, Parties) and comment on each category under the three rating conditions (e.g. Fluency live, Fluency audio, Fluency video, Lexis live, Lexis audio, Lexis video). Again, the focus of this analysis is a comparison between the two non-live rating modes, but live comments are also included for reference.
Tables 20-23 show that there were no misfitting items for any of the facets, suggesting that the MFRM analysis on examiners’ comments was successfully performed on a single logit scale.
As expected, the degree to which positive and negative comments were made was significantly different among the six examiners (Table 20). As in the above non-parametric statistics, Examiner D (measure: .52) and Examiner A (measure: .29) tended to pay more attention to negative performance features than other examiners when they awarded scores. Interestingly, the two examiners were the same ones flagged in the bias analysis presented in Section 5.1.2, indicating that these examiners indeed had slightly different approaches to scoring, compared to the rest of the examiners. This suggests that individual differences cannot be neglected when examiner behaviour is researched.
In contrast, two test parts and two test versions did not seem to make any difference (Tables 21-22).
Table 20: Examiner measurement report for comments
| Measure | Real S.E. | Observed Average | Fair (M) Average | Infit MnSq | |
|---|---|---|---|---|---|
| Examiner C | -.23 | .12 | 2.08 | 1.98 | .75 |
| Examiner B | -.23 | .13 | 1.99 | 1.98 | 1.03 |
| Examiner E | -.18 | .12 | 1.92 | 1.96 | .57 |
| Examiner F | -.17 | .13 | 1.86 | 1.95 | .85 |
| Examiner A | .29 | .08 | 1.74 | 1.71 | 1.06 |
| Examiner D | .52 | .09 | 1.62 | 1.60 | 1.24 |
Fixed (all same) chi-square: 52.1, d.f.: 5, significance: .00
Table 21: Test part measurement report
| Measure | Real S.E. | Observed Average | Fair (M) Average | Infit MnSq | |
|---|---|---|---|---|---|
| Part 3 | -.03 | .06 | 1.81 | 1.88 | .95 |
| Part 2 | .03 | .06 | 1.78 | 1.84 | 1.03 |
Fixed (all same) chi-square: .6, d.f.: 1, significance: .42
Table 22: Test version measurement report
| Measure | Real S.E. | Observed Average | Fair (M) Average | Infit MnSq | |
|---|---|---|---|---|---|
| Interest | -.04 | .06 | 1.83 | 1.88 | 1.05 |
| Parties | .04 | .06 | 1.76 | 1.84 | .93 |
Fixed (all same) chi-square: 1.0, d.f.: 1, significance: .32
Table 23: Examiners’ comment measurement report
| Measure | Real S.E. | Observed Average | Fair (M) Average | Infit MnSq | |
|---|---|---|---|---|---|
| Fluency (Live) | -.39 | .18 | 2.10 | 2.07 | .98 |
| Grammar (Live) | -.36 | .21 | 2.09 | 2.05 | 1.27 |
| Fluency (Audio) | -.23 | .13 | 1.84 | 1.98 | .99 |
| Lexis (Live) | -.14 | .18 | 1.97 | 1.93 | 1.04 |
| Lexis (Video) | -.05 | .13 | 1.86 | 1.88 | .96 |
| Pronunciation (Live) | -.03 | .19 | 1.91 | 1.88 | .83 |
| Lexis (Audio) | .03 | .14 | 1.73 | 1.84 | 1.15 |
| Fluency (Video) | .09 | .13 | 1.80 | 1.81 | .77 |
| Grammar (Audio) | .15 | .14 | 1.68 | 1.78 | 1.08 |
| Grammar (Video) | .27 | .13 | 1.72 | 1.72 | .88 |
| Pronunciation (Audio) | .32 | .14 | 1.61 | 1.70 | 1.02 |
| Pronunciation (Video) | .34 | .13 | 1.69 | 1.69 | 1.02 |
Fixed (all same) chi-square:28.7, d.f.:11 , significance:.00 Note: Audio mode in red, Video mode in blue
The most relevant data to answer RQ2 is the examiners’ comment measurement report in Table 23. For ease of reading, all audio comments are highlighted in red and all video comments are in blue.
The results reinforce the above non-parametric analysis, by confirming that comments made on the live rating mode were more positive than the audio and video modes, and the volume of positive and/or negative comments noted down under the two non-live rating modes were very similar. While audio comments were constantly slightly more positive than video comments, the differences are negligibly small, ranging from 0.01 to 0.06 fair average scores for all categories except Fluency, where the difference is 0.14.
To investigate any differences between audio and video comments further, additional MFRM analyses were performed to compare the two non-live modes on each rating category. The results showed that there was a significant difference only for Fluency (, df=1, ) but not for any other category (Lexis: , df=1, ; Grammar: , df=1, ; Pronunciation: , df=1, ).
This result is slightly inconsistent with the above non-parametric results, which suggested non-significant differences between the audio and video modes in all four categories. This, however, could be due to errors associated with the examiner facet in the non-parametric analysis that were rectified in the MFRM analysis. Although the actual difference is extremely small (0.14), it is interesting to once again find Fluency being different from other categories, as it was in the score analysis and bias analysis presented in Section 5.1.
Additionally, one notable difference between the two non-live comments identified during the coding phase was recurrent references to the test-taker’s ‘(un)willingness’ under the video condition, and these comments were indeed located by the examiner within the Fluency category, such as:
Fluency (Band 6): Maintains flow of speech well and seems willing to develop turns. Overuses ‘they need to’; not enough range of linking words (S06, Examiner A, Part 3, Video)
Fluency (Band 6): Appears willing to produce long turns
(S29, Examiner F, Part 3, Video)
Fluency (Band 6): Willing to speak at length on a variety of topics. Some good use of spoken discourse markers, e.g. ‘it depends on’, ‘probably…’
(S05, Examiner E, Part 3, Video)
It is not surprising that examiners refer to ‘(un)willingness’ since the Fluency descriptor for Band 6 includes ‘is willing to speak at length…’. However, it is still worth highlighting that as many as 16 comments on ‘(un)willingness’ were made in the video mode, while only eight such comments were found in the audio mode. Given the difficulty of identifying speakers’ (un)willingness due to a lack of visual information under the audio rating condition, this might have been one of the factors that contributed to the small, but statistically significant difference between audio and video comments.
Figure 2 below presents in visual form an overview of the results, illustrating that Examiners A and D provided more negative comments, and that audio and video comments tended to be relatively similar, but were more negative than live comments.
The results of the comments analysis suggest an interesting contrast with the findings from the score analysis in Section 5.1. While audio examiners consistently gave harsher scores than video and live examiners, audio and video examiners in fact noticed similar numbers of negative performance features under these two non-live rating conditions. However, the negative features noted down under the video condition did not seem to have translated to lower scores, as they did under the audio rating condition. The results therefore suggest that the two non-live ratings direct examiners’ attention to the similar numbers of negative performance features of test-takers, but video examiners do not rely on these features as much as audio examiners would. Instead, they seem to be able to use such negative evidence in moderation when awarding scores.
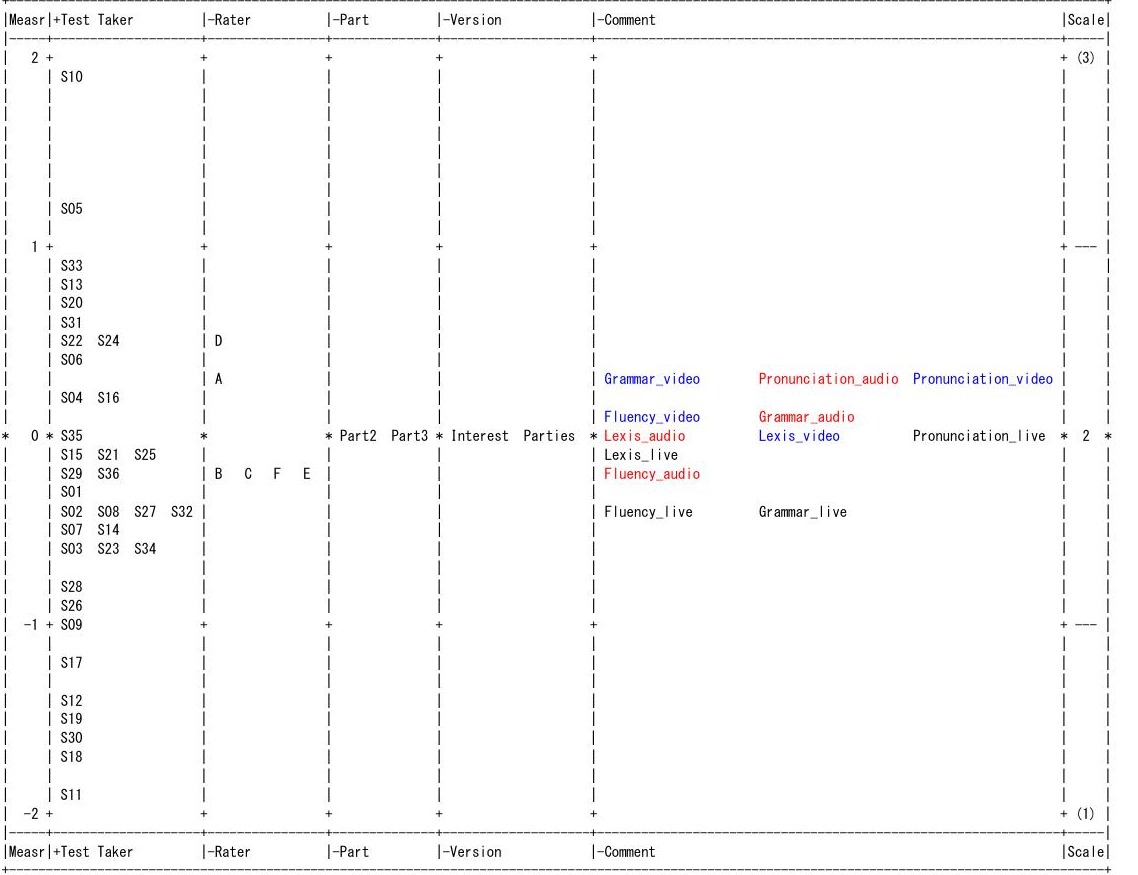
Figure 2: All facet vertical rulers on examiners’ comments (Note: audio mode in red, video mode in blue)
Table 24: Coding scheme for verbal report data
| Main theme | Sub-theme |
|---|---|
| 1. Video providing a fuller picture of communication | 1.1 Video helping examiners understand what test-takers are saying 1.2 Video giving more information beyond what test-takers are saying 1.3 Video helping examiners understand what test-takers are doing when dysfluency or awkwardness occurs |
| 2. Possible difference in scores between two modes | 2.1 Different features noticed/attended to/ accentuated in the two modes 2.2 Comments directly related to scoring |
| 3. Different examining behaviour / attitudes between two modes | - |
| 4. Implications for future double-rating methods | 4.1 Preferred mode of double-rating 4.2 Implications for examiner training and standardisation |
5.3 Verbal report analysis
We have thus far reported on test-takers’ test scores under the audio and video rating conditions, as against those under the live rating condition, and then discussed examiners’ written commentaries noted down when these scores were awarded.
We now move on to presenting the results of examiners’ verbal report data, in order
to address RQ3: Are there any differences in examiners’ perceptions towards test-takers’ performance between the non-live audio and video rating conditions?
Two of the researchers went through all the relevant, transcribed verbal report data together and iteratively worked out the emerging themes and sub-themes. The final coding scheme includes four main themes with a total of eight sub-themes, which are shown in Table 24 above. The following sections explain each category with quotes, following the order presented in Table 24.
5.3.1 Video providing a fuller picture of communication
5.3.1.1 Video helping examiners understand what test-takers are saying
In the verbal report sessions, most frequently mentioned by all the examiners was that having video helps them understand what test-takers are saying during the test. Being able to see lip movements, hand gestures, eye movements and body language complements what the examiners hear while double-rating, and seems to help particularly when test-takers’ pronunciation is unclear and their intonation and pausing are not appropriately controlled.
A number of remarks were made about this, such as:
I think she’s talking about a “lift”, but again, cos she’s not pronouncing it completely correctly, it’s slightly confusing at this stage, but with the video, you can see her body language, and again, she’s doing some actions to help us understand. (S04, Examiner E, Part 2, Video)
Being able to see her facial expressions and lip read, I find her much easier to understand. (S09, Examiner F, Part 2, Video)
[…] when I’m listening to people, I look at their mouth, and I think that might be quite a large part of it. (S09, Examiner D, Part 2, Video)
[His hand movement] helps separate the points one from the other, I think it helps support that, whereas, because his intonation is so flat. (S05, Examiner F, Part 3, Video)
His body language helps to get the message across. […] His hand movements, yeah, he’s using his hands, but his eye contact as well. (S05, Examiner E, Part 3, Video)
She’s not a 5, you know, she’s a 6, she’s clear most of the time, I understood what she was saying there, you remove the…I don’t know, is it the gesture, is it the “dressing elegantly” or the way that you can see when she’s going to pause, or that she’s doing something when she’s pausing that just makes it…everything I didn’t understand when I listened to the audio, I understood now. (S04, Examiner F, Part 3, Video)
[In response to a researcher’s question, “Is this test-taker’s pronunciation problematic?”] Yeah, it’s difficult to know where one point is beginning and ending, and because of that, I’m anticipating she’s going to do one thing and then she does something totally different and that just throws me and then I don’t understand the whole utterance. Without the clues of body language to help, yeah, some parts can’t be understood. (S09, Examiner F, Part 3, Audio)
It is worth noting that three of the four examiners commented that S29’s hand movements and body language complemented what she was trying to say very well, despite her being a relatively lower-level student (i.e. Band 5) and thus difficult to understand. In Part 2 particularly, she talked about her hobby as taekwondo, and explained the belt grade system, moving her hands around her waist (to demonstrate ‘belts’) and making fists like a boxer (to show ‘fighting’), which greatly helped the examiners to understand her.
Without the video, I think I would have misunderstood quite a lot of what she said without the visual help of ‘belt’ and ‘fighting’, I may not have understood what she was talking about. She’s a 4. She’s a 4 in all four bands. There’s no evidence of paraphrase. She knows the word she’s looking for and uses actions to help it. (S29, Examiner F, Part 2, Video)
Likewise, in Part 3, S29 was using her hands a lot to help get the message across.
She’s using her hands there, too, so watching the video, you can see it’s helping the message to come across when her hand is going down to show “less free time”. (S29, Examiner E, Part 3, Video)
The use of body language by S29 was also complimented by Examiner A as being “very good and appropriate”. When asked by a researcher what Examiner A meant by that phrase, she answered:
It’s just posture, leaning towards the examiner, which shows closeness between the two. It’s hands to underline her words, gestures which complement what she’s saying. Nodding, smiling, eye contact, engaging with the person in front of her. (S29, Examiner A, Part 3, Video)
This comment by Examiner A demonstrates not only how being able to see the test-taker’s body language helps examiners’ understanding, but also how much more information examiners can gather about the test-taker’s interactional competence. This will be further discussed in the next section.
In this category, the examiner comments emphasised the fact that it is not just the language that examiners hear, but also the test-taker’s lip movements, facial expressions, eye contact and body language that contribute to their understanding. Having video images and being able to understand better what the test-takers are saying may be one of the reasons why the results of the score analysis (Section 5.1.1) showed that the test-takers scored significantly higher in the video mode than the audio mode.
5.3.1.2 Video giving more information beyond what test-takers are saying
The examiners felt that the video mode provided much more information about what is going on beyond what test-takers are saying, such as the use of communication strategies, facial expressions, eye contact, the degree of willingness, engagement and confidence. These paralinguistic features were mentioned extensively with S29 and S09, who were relatively lower-level test-takers (i.e. Bands 5 and 4, respectively).
She, with almost no language, in fact, she’s doing a pretty good job [in her use of little smiles]. Pretty impressive, actually. (S09, Examiner F, Part 3, Video)
She did look quite animated for a little bit there, some good eye contact and she used her hands a bit, but then she goes back to leaning on her elbow, putting her face in her hand. […] She’s either not interested or not motivated or just out of her depth. (S09, Examiner E, Part 3, Video)
They’re communicating a hell of a lot with their eyebrows, the two of them [i.e. S29 and live examiner]! It’s very sweet. There’s a lot going on, and she’s responding very well to it. Yeah, there’s a lot going on that’s unspoken there. (S29, Examiner F, Part 3, Video)
Furthermore, Examiner E also pointed out how S29’s body language complemented what she was trying to say, as well as how her willingness to communicate seemed to have engaged the examiner in the video mode. However, in the audio mode, such information is lost, which makes it difficult for examiners to sense whether the test-taker is willing or not:
It seems like they’re not trying, actually, there’s a lack of willingness. One of the descriptors is “is willing to speak at length,” that’s band 6, but that idea of willingness comes into fluency, how willing is the participant, the candidate, are they playing ball or aren’t they? Like even though that good guy [i.e. S05] was very good, he wasn’t particularly willing, so it’s how much effort is the person making to maintain the flow of conversation. (S29, Examiner F, Part 3, Audio)
Interestingly, regarding test-taker’s willingness, Examiner F suggested that it migh be possible to hear willingness of a test-taker in the audio mode if the test-taker is at a relatively higher level; she reported that she was able to hear S04’s (Band 6) willingness because S04 kept going and was quick to respond, giving an impression that she was very keen to, and able to, communicate. As such, the lack of visual information in the audio mode might affect lower-level test-takers more, when it comes to examiners judgements on their (un)willingness.
While there may be some differences according to the level of test-takers, these verba reports are in line with the results of the examiners’ comment analysis in Section 5.2, which indicated that the examiners made notes on test-takers’ (un)willingness more frequently under the video rating condition.
5.3.1.3 Video helping examiners understand what test-takers are doing when dysfluencies and awkwardness are observed
The verbal report data revealed that the examiners can see what test-takers are doing when they hesitate, pause, or sound awkward, which can affect examiners’ judgement and the final band to be awarded. Firstly, the examiners commented that having visuals helped them to guess the reasons for hesitating and pausing.
[…] actually, just there, his eyes went up, and so that’s…it’s not struggling to find the words, I think he’s just…it’s trying to get content, he’s processing things. (S05, Examiner D, Part 3, Video)
Some disfluency here, and you can tell from her face it’s because she doesn’t really understand ‘celebrations’, so as you’re seeing her face and her facial expressions, it’s showing that it’s a lack of comprehension rather than thinking of the ideas. (S04, Examiner E, Part 3, Video)
Some hesitation there, but I think it was because she couldn’t think of the word she wanted, so she paraphrased quite well to get the message across in the end. (S04, Examiner E, Part 3, Video)
Now, see, she’s very willing to give an extended turn, but…yeah, it’s very basic in terms of language, grammatical structures, nearly every word, well, every sentence had a mistake, but she communicated. There were pauses, but again, you could see her eyes searching, she was searching for a word, actually, rather than searching for the content, but yeah, a very willing participant. (S29, Examiner F, Part 3, Video)
Considering that the rating descriptors mention “content-related hesitation” (Band 9) and “language-related hesitation” (Band 7) under Fluency and Coherence, being able to accurately guess the source of hesitation may be very important for relatively higher-level test-takers.
In contrast, for lower-level test-takers, examiners commented on the video showing their understanding (or lack of understanding) clearly, which gives more information, even though comprehension is not included in the descriptors in the assessment criteria at lower levels.
I think that she was smiling, she understood it, it wasn’t a look of confusion, she understood the question. (S09, Examiner F, Part 3, Video)
She hasn’t understood from the first part of that. Yes, I mean, that…I heard on the audio that she didn’t understand this bit, but what I didn’t get was that she didn’t understand the question two turns before. (S09, Examiner F, Part 3, Video)
So she doesn’t understand the question at all, here, and she’s just giving one word answers and her face is saying it all. You can see that she really doesn’t understand, but she’s not asking the examiner to explain, she’s just saying “no” so there’s obviously no fluency there because she just doesn’t understand it. (S09, Examiner E, Part 3, Video)
Her body language is saying, “I don’t know what I’m talking about!” Seeing her on the video, she looks quite uncomfortable and it’s clear that she doesn’t understand a lot of the questions. (S09, Examiner E, Part 3, Video)
These examiner reports add further insights to the findings of Nakatsuhara’s (2012) original study on the relationship between test-takers’ listening proficiency and their performance on IELTS Speaking, which found that the IELTS Speaking Test seemed to tap into a listening-into-speaking construct, as far as lower-level test-takers (lower than Band 5) were concerned. This was reflected on the Fluency category, in relation to the Band 4 descriptor, “cannot respond without noticeable pauses…”, as test-takers’ limited comprehension would normally result in delayed responses. Examiners’ comments described here highlight that the listening-related construct can be more accurately assessed with test-takers’ visual information, since examiners can more clearly see test-takers’ comprehension problems. This might help to explain the counter-intuitive finding in Section 5.2 that examiners noted more negative fluency features of test-taker performance in the video rating mode than the audio rating mode.
Furthermore, Examiner D commented on a Band 7 test-taker (i.e. S05) when there was an awkward transition in his Part 2 performance. S05 started his Part 2 as follows:
S05: I don’t really have many hobbies, but one of my hobbies is sports, just all the sports that I’ve been getting any chance, like, for example, back home, I just went to a gym, like…with free weights and stuff. Well, the first reason why I enjoy it, just cos it improves my health, keeps me healthy. […]
Examiner D felt that the underlined transition was “a bit awkward” in the audio mode, but found that it was actually because he was looking down and reading one of the bullet points in the prompt card. In the audio mode, the examiner reported that she would make a mental note of the awkwardness in transition, but made a different comment in the video mode:
I’m thinking, from remembering the prompt, […] it’s like ‘Talk about X and say why you went there’. So he’s just copying it, like “why I went there is…” So it’s possible to even say that he’s relying on input material, but that doesn’t come into the descriptors for a speaking test. (S05, Examiner D, Part 2, Video)
Likewise, Examiner F reported that her impressions of a lower-level test-taker (i.e. S04) were different between the two modes in Part 2:
It’s interesting that that initial introductory structure that she uses sounds… I noticed it sounds more rehearsed here on the video. It’s almost like she’s prepared a speech and she’s going to give it, whereas on the audio, it sounded quite natural. […] She’s so heavily dependent on the notes, so actually, whereas before I thought it sounded more disjointed, it’s because she’s looking at her notes very frequently. (S04, Examiner F, Part 2, Video)
Even though it may not immediately lead to awarding different bands, it is worth noting that the examiner’s perceptions of the awkwardness were very different between the two modes.
Further to the comments made about the sources of hesitation or pauses, two examiners indicated that different modes of double-rating may change how they might take the same dysfluency phenomena into account. This is because all the visual information is lost in the audio mode, and examiners cannot distinguish between different sources of hesitation or pauses. Examiners F and D elaborated on this point in the conversations with a facilitating researcher below.
Excerpt 1
Researcher: As you’ve said, what strikes me is that several times, you can see her pausing to search for content, not for words, but how… You can see it on the video, but can you hear it on the audio?
Examiner F: No, not at all, you can’t distinguish between the two. You can distinguish when you see, because you can see what they’re doing with their eyes and their body language. […] And you knew before she’d even answered that she hadn’t understood [by seeing the uplift movement of S09’s head]. You could see that she hadn’t understood, but on the audio, that was just totally lost. You’re missing out on a lot of the communication, especially someone of her level [i.e. Band 4], you know. (S09, Examiner F, Part 3, Video)
Excerpt 2
Researcher: When you were looking at the video, you mentioned that there was one occasion that there was a long pause and she was looking up, searching for expressions, and you wouldn’t mark it down as a hesitation. With the audio, you don’t have that information. How would you treat it?
Examiner D: I suppose I would then look at the quantity, so I might put that one… I’d have to…sometimes what I do is write down ‘hesitation’ and then I’d mark
against it, so I think I would double-check and go with how many times she’s hesitating, but yeah, with the video, it feels like a different sort of hesitation to when you’ve just got the audio, but I would then go with how much of it there is. (S04, Examiner D, Part 3, Audio)
Examiner D further reported:
I’m not sure it made me more critical or more lenient, but the hesitations in the video were certainly laden with more clues as to what you think they were doing.
5.3.2 Possible difference in scores between two modes
This broad category gathers examiners’ comments on the differences between the two modes which might potentially lead to them arriving at different scores. As presented in Section 5.3.1.2 above, the video mode gave much more information beyond what was being said. Accordingly, examiners reported having different impressions of the test-takers’ performance between the two modes.
5.3.2.1 Different features are noticed/attended/accentuated in the two modes
Examiner F made extensive comments on how she noticed different features of the same test-takers’ performance between the two modes. It should be noted that, although she made a number of comments comparing the same performances during the verbal report sessions, she was conscious not to compare performances during the preceding double-rating; she commented, “as a rater, you try to block out any previous knowledge or any previous experience […] just block out anything else you’ve heard before and start again to be fair to them”. This emphasises that the practice effects on the scores were kept to a minimum.
Below are excerpts from the comments which Examiner F made. She reported noticing non-standard pronunciation and accents, hesitations and errors much more in both Parts 2 and 3 in the audio mode.
Firstly, she commented on the pronunciation and fluency of S05, who is at higher-level (i.e. Band 7):
He sounds more Russian, or Georgian, or…I notice his accent more. […] I would say control [of pronunciation] is variable rather than control is consistent, most of the time.
[…] He seems to cut the end of, like, “keeping busy” and then instead of…he’s not connecting, he’s cutting, he’s truncating the ends of words, the end of the utterance prematurely, which makes him sound much more Russian than before. I’m still hearing the good grammar, the good vocab, but actually, maybe vocabulary less, I don’t know, I certainly wouldn’t be giving him an 8 if I were listening to this for the first time […] I hear far more hesitations, his accent sounds more noticeable. I would probably bring him down to 7 overall. He is being not as good as his impression at all. (S05, Examiner F, Part 2, Audio)
I hear the mistake of ‘all that essentials’. There was quite a long pause before. […] The mistakes he’s making are much more obvious here [in audio]… That was very hesitant, I hear lots of little pauses and gaps. Though my impression [in video] was that he was fluent, here my impression is that he is hesitant. Hmmm. […] he sounds almost robot-like, artificial, the opposite of fluent, very strange, it’s almost like a different person. (S05, Examiner F, Part 3, Audio)
With a lower-level test-taker whose pronunciation was indeed problematic, having video seems to work in favour of the test-taker, just as it might for higher-level ones. Examiner F reported noticing dysfluency features and unclear pronunciations more in the audio mode.
There’s less of an impression that she keeps going [in the audio]. […] I hear that kind of staccato much more in the audio. […] I suppose [in video] you’re filling in the gaps with the movements, when you can see them searching for vocabulary, when you can see them thinking about the question, or the hand movements that I’m describing. They’re often describing a story, the story of how she started taekwondo, so there’s gestures that are coming in that help fill those gaps, though those gaps are not so apparent, or maybe they’re not gaps, maybe that’s it, maybe that’s…it’s just a normal part of speech. […] But without the video, it sounds so… unnatural, actually, disjointed, disembodied, and makes it much more difficult to understand. I wouldn’t change my scores for fluency, though, because I think the general descriptors are still accurate for lexis and grammar, but for pronunciation, without the communicative effect [that can be observed in the video], particularly a low-level candidate whose accent is very intrusive, you know, I could almost go down to a 2 with that. (S29, Examiner F, Part 2, Audio)
That sounded very, very full of pauses, it was basically saying not very much. She was thinking there, and it wasn’t apparent at all, it just seemed like she was coming down to band 3 or something, frequent repetition and self-correction. […] I think fluency would come down, ’cos the pauses are so much more noticeable when you can’t see what they’re doing. […] without being able to see how much she’s doing to maintain the flow, you don’t see that she’s maintaining the flow. (S29, Examiner F, Part 3, Audio)
As noted in previous sections, S29 was the enthusiastic lower-level test-taker who communicated very well using body language etc., despite her lack of control over the language. In the audio, such information is lost because whatever is additional to what is spoken cannot be observed, which might lead to a lower final score.
[…] she [S29] puts in real effort, and that doesn’t come across when we only listen to the voice. What does come through is how limited her range is, how limited…her grammar’s a bit better, she’s got the ability to use modal verbs, but that’s what’s striking, “I have no language, I have to keep saying, ‘Of course’, I’m making mistakes every time I use…you know, the right word, wrong form”, which I noticed before, but the errors really…as an examiner, you are listening for errors, so I hear the errors far more acutely when only listening to the audio. My impression was that she communicates effectively even when errors are frequent, for grammatical range and accuracy. I would probably leave out the “communicates effectively”, I don’t think it was effective communication, just listening to the audio, it was OK, but it wasn’t necessarily effective. […] She was very effective with limited resources [in the video], and that effectiveness is key, that’s one band’s difference. (S29, Examiner F, Part 3, Audio)
Thus far, it appears that examiners make harsher judgements in the audio mode, where there is no visual information and, therefore, tends to draw examiners’ attention more to problems with what can be evaluated for the categories of fluency and pronunciation. However, as discussed above in relation to test-takers’ listening problems, there were cases where having video made the examiners notice more problems with fluency because they could see it. It appears that having visual cues can work eithe positively or negatively towards the final score that test-takers receive.
I noticed her good pronunciation less in the video. […] I mean, although I would still say she keeps going, I notice her hesitations far more, because I can see them. It’s, yeah, I can see them, so therefore, I notice them more in fluency. (S04, Examiner F, Part 2, Video)
Likewise, in general, Examiner F felt that some linguistic features are accentuated either positively or negatively in audio; it might be an item of vocabulary, a feature of intonation, or a grammatical construction that either sounds very impressive or rather disappointing. At the end of her verbal report session, she added general comments as below:
The mistakes are much more obvious with the audio. The audio makes the bad seem worse, but also, the good bits, particularly where it’s to do with intonation, where they’ve got the intonation spot-on, the little phrases that several candidates did, that also really stood out in an otherwise appalling performance from their video performance[…]
Maybe because I’m trying to compensate for not having the visuals, so I’m concentrating so much on what I do have, the bits that I do have, that therefore the bits that I do have, I understand really good, possibly better than they are, or more often, though, really bad, and actually, that they’re not as bad as that, and it makes them appear worse. (Examiner F, general comments).
Moreover, she suggested that such accentuated features are often found in pronunciation and fluency, but can have an impact across all four criteria:
Two bands down [between the audio and the video for S05] - that’s a lot, but my gut told me that 8 was right on the video, my gut told me that a 6 was…it was spoton, the description could have been written perfectly for him, listening to him on the audio. And it definitely seems to be that fluency and pronunciation are the ones that are most affected, though, again, it’s the accuracy of the grammar that comes into play, ’cos you hear more mistakes, or you notice the mistakes much more, but sometimes, that also brings it down, or that passive construction that I found so amazing, but then I look at the video and think, “Well, actually, what was I doing, what was I thinking?” (Examiner F, general comments)
5.3.2.2 Comments directly related to scoring
Examiner E made comments about how she might have given different scores to the same test-takers between the two modes; she suspected that being able to observe non-understanding of lower-level test-takers aggravated their scores, while the relaxed, confident look of higher-level test-takers may have led to higher scores.
Well, I was thinking maybe I’m more critical of the lower-level students with the video. […] because I can just see that they’re not understanding, rather than just hearing the hesitation in their voice, it’s different to actually seeing their face and their body language, and the slight panic, sometimes, look, whereas if you’re just listening, it could be just searching for the right words or content, rather than not understanding, whereas the higher-level students, I think, maybe I possibly mark them a bit higher with the video because I can see how relaxed they look and how good their body language is in a situation. (Examiner E, General comments)
Interestingly, looking confident was mentioned by different examiners as potentially complementing the actual performance and making it seem better than it really was. For S05, Examiner F also mentioned his confidence in the video mode.
I suppose, his body language, I noted it because he is being confident, good eye contact, I reckon he looked very relaxed. […] he’s not very expressive with his hand movements, but the way he’s sitting and his eye contact is very confident. (S05, Examiner F, Part 2, Video)
The potential ‘masking’ effect of looking confident also seems to apply to lower-level test-takers such as S29.
So I think just being able to see her body language and her eye contact and her confidence, it does make you think that she’s actually doing very well, whereas if you focus on the accuracy then there are quite a lot of mistakes, so she’s very fluent but marked down on the accuracy at the moment. (S29, Examiner E, Part 3, Video)
Contrary to these examiner reports mentioned above, an additional analysis on al the test-takers’ raw scores in the two modes did not suggest that there were differential effects of having visual information on test-takers with different levels of proficiency (see Appendix 1 for details). However, given the small sample size of this study, this issue is worthy to be followed up in future research.
Another insight gained from the examiners’ verbal reports was differential effects of the rating modes on different rating categories. When examiners were asked if they thought they would give different scores between the two modes of double-rating, Fluency and Coherence and Pronunciation came up as potentially receiving different marks. In conversation with a facilitating researcher, Examiner F elaborated on her impression on S05 as follows.
Examiner F: For some reason, I had the impression that he used a wider range of structures in the video, and then with taking it away, and yeah….it doesn’t sound that impressive any more. Yeah. The only thing that’s remaining pretty consistent for me is the lexis.
Researcher: But the fluency and coherence and perhaps pronunciation, you hear or perceive slightly differently?
Examiner F: Yeah, exactly, differently. Certainly,I think, harsher with my judgements without the video. It does make me question what I do in the real examinations, where I’m face to face.
Similarly, Examiner E answered that she might give different scores on the criterion of Fluency and Coherence because the video provides more information to know “about how much they understood about the question and that would link in with coherence.” Also, she mentioned that the Pronunciation criterion can also be different because she can match the sounds to the face and lips in the video.
5.3.3 Different examining behaviour / attitudes between two modes
Two examiners mentioned the different degrees of concentration between the audio and video modes.
When I trained, and I’ve been standardised or re-certified, and the videos are up, I quite often don’t look at the videos, I think I can concentrate a lot more when I don’t have the visual input. So actually, I’m contradicting myself, because I’m saying that lip-reading helps me, and it felt today like it helped me, but if I’m in a big room of people re-certifying, I concentrate and I just listen and I feel I’m concentrating more if I’m only listening. (Examiner D, General comments)
Examiner E also agreed that she could concentrate more in the audio mode, saying that, “you can’t look at the criteria and watch that at the same time”. This was in line with the researcher’s observation notes on how Examiner E focused strongly on the rating criteria because she wanted to match the performance that she was listening to (or listening to and watching). Looking at the rating criteria and also the videoed performance does not seem possible unless examiners have two computer screens side by side. Even that would not solve the issue of less concentration in the video mode because it would still involve switching between the screens while double-rating.
The other element which emerged in this category was having sympathy towards the test-taker in the video mode. Because it can be seen that the test-takers are struggling, still trying to speak more, or giving up, examiners may be willing to wait rather than to penalise the dysfluency or awkward phenomena.
I feel much more sympathetic towards her, watching her. She’s trying… it’s more obvious when she doesn’t understand something. You can see it. Those sideways glances… But also, it’s more obvious when she has understood, it’s just that her English is so limited that that’s all that she can say in response… (S09, Examiner F, Part 3, Video)
Because the visuals give some clues while the test-taker is hesitating, Examiner F felt that she might be more willing to wait for responses if she could see the test-taker:
I’ve had students before who don’t say anything, there’s nothing, and they’re thinking, and then they come out with a response, but it’s been 5 seconds or 10 seconds since the question was asked, and that is a pause, there’s nothing going on there, no communication going on there, but there is communication going on there, she’s signalling “I’m thinking. I’m going to give you an answer in a second, just as soon as I get it in my head.” […] you can see where she’s keeping her mouth open, so she is indicating, “I haven’t finished”. (Examiner F, General comments).
Furthermore, it was also found that having visuals may give examiners more confidence, particularly with pronunciation, which is in line with the findings in Section 5.3.1:
Well, the difference it made for me was that I felt more confident with pronunciation if I could see it. (Examiner E, General comments)
5.3.4 Implications for future double-rating methods
5.3.4.1 Preferred mode of double-rating
At the end of the verbal report sessions, when examiners were asked which mode of double-rating they would prefer, different answers were given; one examiner preferred the video mode, one did not have particular preference, and the other two preferred the audio mode. The reasons behind their preferences stemmed from having visuals in the video mode, which offer much more information about what is happening in the test, and it was a question of whether the examiners appreciated having such information or not.
I prefer the video. Yeah. I would love to be faithful to the candidate and to be more sure of myself. When you listen to a disembodied voice, sometimes the recording is not very good, and if I have to make a judgement that will affect someone’s career, life, immediate future, I like to be sure that I’m making a good decision and so… yeah, when I’m in the test and I’m face-to-face with that candidate, I’m sure that the grades that I give them are appropriate. I don’t have that confidence when I listen to an audio recording, so I would prefer to have a video […] Well, the other reason I prefer the video is that I can clearly see when a candidate hasn’t understood, and that’s when I make valuable judgements. Hasn’t understood is looking at the difference between the hesitations when they’re looking for content and when they’re looking for vocabulary or linguistic items, I can read their signs, they’re not aware that they’re giving the signs, none of us are, but it’s very apparent and that’s what helps anyone to make accurate decisions, by reading those signals. You take away those signals and you’re going to inevitably have less accurate, or harsher, it would seem, harsher marking. (Examiner F, General comments)
In contrast, Examiner A preferred the audio mode because she felt the visual information was distracting and was not relevant to assessing the test-taker’s “pure language”. The only comments that she made on the difference between the two modes of double-rating was about S29’s use of body language to complement what she was saying (see Section 5.3.1.1), and she reported that she “tried not to take the visual information into account in arriving at a final score” in the video mode. This was because using audio was the way she was used to double-rating and she felt that the visuals were irrelevant to the construct.
The results of the bias analysis on the examiners’ scores also confirms this tendency of Examiner A (see Section 5.1.2). She had a negative bias towards the video mode, which suggests that she gave harsher scores in the video mode, compared to other examiners.
Another examiner who preferred the audio mode was Examiner D. She referred to her experience in double rating ‘jaggeds’, i.e. candidates with different ratings on different criteria, and commented, “I’m used to doing audio. But when I do audio, I’m thinking particularly jaggeds, I always have had headphones, and I find that is my way of cutting everything out and really concentrating, so we haven’t done that today, but that’s how I listen when I’m rating second marking”. The bias analysis of her rating scores showed that she was positively biased towards the video mode compared to the other examiners in this study, which indicates her leniency in the video.
On the other hand, Examiner E said that she did not have a particular preference, suggesting that it was simply a matter of getting used to either method of double-rating.
Personally, no, I wouldn’t mind either way. I’m just used to just doing audio, so it doesn’t matter to me. (Examiner E, General comments)
These examiners’ differential preferences along with their different ways of interpreting visual information described so far reinforce the discussion provided for the bias analysis results (Section 5.1.2). Regardless of the overall score trends shown in Section 5.1.1, it is still essential to look into each examiner’s behavior. This leads to the importance of examiner training and standardisation. The next theme identified from examiners’ verbal reports relates to implications for examiner training and standardisation.
5.3.4.2 Implications for examiner training and standardisation
Although the two modes seem to have drawn the examiners’ attention to different aspects of performance, the examiners agreed that the video mode gave them a rounder, fuller picture of the test-takers’ interactional competence. One of the examiners preferred to have the video as the potential mode for double rating because she could be more confident of her rating. One examiner did not have a specific preference and said that it was a matter of getting used to either mode, and the other two examiners preferred the audio because they could concentrate on the language and the criteria without being distracted by the visuals.
Regarding the video mode, a cautionary note was raised by Examiner D that, despite the fact that the video mode offers the same visuals that examiners may have encountered in the live test, it does not necessarily mean that the information is taken into consideration under the live rating condition:
… in some ways, we’re having to do so much [during live exams] that we’re doing that, but actually, we’re not really taking in much of that, we’re listening, listening, listening, listening, listening, so maybe when it’s live, I’m not sure how many of the other cues I’m getting. Maybe I am sort of without noticing it, or a certain amount’s getting through, but there’s so much of the swan on the water that’s paddling… it’s all going on, but you’ve just got to be… and I’m not sure if there’s much mental space left to take in non-verbal cues as well. (Examiner D, General comments)
The previous research on pre-2001 IELTS showed that ratings of purely audio performances risk underestimating test-takers’ proficiency, and ratings of live performances are more likely to be higher (Conlan et al., 1994). Together with the score findings presented in Section 5.1, it seems that if test-takers are audio rated without visual information, the risk is that they will receive a slightly lower mark than if they are live-rated or video-rated.
I find it quite striking, listening and then seeing and listening, they’re different people, almost. I can’t picture her when I listen to the disembodied voice.
I get very little sense of who she is and what she’s doing in that test, because this is very interesting, we do standardisation and we do all audio, […] but when we do the training, we do it with video. (Examiner F, S29, Part 3, Audio)
The findings of this study suggest that the two modes of double-rating are possibly looking at different constructs, with the construct assessed under the audio rating condition being narrower than that in the video condition. This has important implications for training and standardisation of IELTS examiners. If the initial training is given using video, and subsequent standardisation is conducted using audio, some of the rationales for the scores assigned to the training samples may not be applicable to those of the standardisation samples, such as willingness (that could be observed more on the video) and reasons for hesitation (i.e. search for lexis or content).
6 Conclusions
With the aim of offering a better understanding of two non-live second marking modes using audio and video recordings of test-takers’ spoken performance, this study has investigated examiners’ rating scores, the degree of positiveness in test-takers’ performance that examiners notice while awarding scores, and their perceptions towards test-takers’ performance under the audio and video rating conditions. Their rating scores and written commentaries were also compared with those awarded under the live rating condition.
The main findings for each of the three research questions raised in Section 3 are summarised below.
RQ1: Are there any differences in examiners’ scores when they assess audio recorded and video recorded test-takers’ performance, under non-live rating conditions? And how do the scores compare with the live rating outcomes?
A series of MFRM analyses was carried out to compare examiners’ scores awarded under the live, audio and video rating conditions. The results indicated that audio ratings were significantly lower than live and video ratings for all rating categories. Scores in the video rating mode were very similar to those in the live rating mode, except for the Fluency and Coherence category, where live scores were significantly higher than video scores. Fair average scores on the four rating categories under the audio condition ranged from 4.63 to 4.91, while those under the live and video conditions ranged from 5.05 to 5.32.
Bias analysis identified that Examiner A and Examiner D exerted some bias in their ratings. Compared to the other examiners who participated in this study, Examiner A had a negative bias towards video rating and a positive bias towards audio rating. Conversely, Examiner D had a negative bias towards audio rating.
RQ2: Are there any differences (according to examiners’ written commentaries) in the volume and nature of positive and negative features of test-takers’ performance that examiners report noticing when awarding scores under the non-live audio and video rating conditions?
In total, 1,396 comments by six examiners on the four rating categories were coded according to the extent to which they noticed positive and negative features of test taker’s performance. While the degree of positiveness varied across the six examiners (e.g. Examiners A and D noticed more negative features across all categories), the six examiners in general exerted similar degrees of positiveness in their comments under the two non-live conditions, and these non-live comments tended to be significantly more negative than live comments.
The reduced time pressure and better concentration, without the need to multitask in the non-live rating modes, might have enabled them to notice more negative features that they might have missed during the live testing condition. For the Fluency and Coherence category only, they noted slightly more negative features under the video condition than the audio condition. This was a little counter-intuitive, but the verba report data indicated that this might be due to test-takers’ visual information that clarified reasons for hesitations which examiners were not able to identify under the audio condition.
The examiners’ comments analysis showed an interesting contrast with their score results. It seems that while similar numbers of negative performance features were noticed under the audio and video rating conditions, when it comes to scoring, examiners in the video mode did not depend on such negative evidence as much as they did under the audio condition. It can be speculated that richer information of test-taker performance in the video rating mode allowed examiners to use such negative evidence in moderation when awarding scores.
RQ3: Are there any differences (according to examiners’ verbal report data) in examiners’ perceptions towards test-takers’ performance between the non-live audio and video rating conditions?
The verbal report data clearly demonstrated how having visual information helped examiners: a) to understand what the test-takers were saying; b) to see what was happening beyond what the test-takers were saying (e.g. smiling, (un)willingness); and c) to understand with more confidence the source of test-takers’ hesitation, pauses and awkwardness in their performance.
Because visual information is not accessible in the audio mode, the examiners attention seems to have been focused on what they were able to observe, causing them to penalise dysfluency features, accents and errors more than in the video mode. While examiners under the video rating condition noticed as many negative features as they did in the audio condition, they did not rely solely on such negative evidence when awarding scores. This explains why the scores in the audio mode were significantly lower than those in the live and video modes.
The examiners had different opinions regarding their preferred mode of double-rating. One examiner preferred the video mode because it offered a more rounded picture of communication and she was more confident in her scores. Two examiners preferred the audio mode because they were used to double-rating with the audio, and that is how they were trained to double-rate. The other examiner stated that she did not have any preference, and it was just a matter of getting used to both modes of double-rating. This suggests that these differences should be addressed in rater training and recertifying sessions if the video mode is to be introduced in the future.
As identified in the literature review (Section 2.2.1), this study has addressed the methodological shortcomings of the two previous studies on (pre-2001) IELTS by Styles (1993) and Conlan et al. (1994) in three ways. Firstly, we ensured that the audio and video clips were of good quality, so that the sound and visual information was clear and would not cause any disruption to the examiners’ double-rating processes. Secondly, all the test-takers’ performance were double-rated in both modes, rather than being separated into two groups for the two modes (as in Styles, 1993) which would have caused an issue with the equivalence between the ability of two groups. Thirdly, this study employed a mixed methods research design with more advanced MFRM analysis and in-depth qualitative analysis. This offered much richer data than the two previous studies, which only used raw score data with Classical Test Theory (CTT) analysis (Styles, 1993; Conlan et al., 1994) and retrospective self-reports from the examiners (Conlan et al., 1994). The use of stimulated recall interviews in
this study has been especially useful and allowed us to investigate examiners perceptions closely and to complement the scores and comments data.
The findings from this study are broadly in line with the two previous IELTS studies of Styles (1993) and Conlan et al. (1994). Conlan et al. (1994) found that some examiners took more account of paralinguistic features of test-takers’ performances than others. This was also true in the current study, where all four examiners agreed that the video mode gave more clues as to what they thought the test-taker was doing during the test but the degree to which they took such information into account differed (e.g. Examiner A reported disregarding the visual information, while Examiner E reported considering visual information and giving some different scores for the same test-takers). Styles (1993) found that the intra- and inter-rater reliability for the audio mode was noticeably higher than those for the video. This may be simply explained by the audio mode having less information available for the examiners to consider, which might have led to less variation in scores. Moreover, although it was not the focus of Styles’ study, his results showed that the audio mode produced a slightly lower mean score (M=5.92, SD=0.88) than the live scores (M=6.2, SD=1.6). The score analysis of this study confirmed that the examiners were harsher in the audio mode, which led to the lower mean scores.
The findings of this research have several implications for the speaking test constructs assessed by different modes of rating in relation to the availability of test-takers’ visual information to the examiners, and for a recommended mode of double rating for the IELTS Speaking Test.
The results suggest that the constructs tested under the video condition are much closer to those under the live test condition, and that audio rating is assessing narrower constructs than video rating. The availability of test-takers’ visual information allowed the examiners to take account of test-takers’ non-verbal features such as lip movements and gestures, and enabled them to interpret reasons for pauses more accurately while communicating with them.
Although the extent to which the examiners should consider non-linguistic features in their assessment is arguable, we need to bear in mind that they are the features that also facilitate real-life face-to-face communication. As confirmed by the examiners’ recurrent comments, these features are indeed important factors that contribute to interactive, reciprocal face-to-face communication. Direct tests of speaking, like the IELTS Speaking Test, have long been advocated as a more suitable format to assess communicative language ability compared to semi-direct speaking tests, where the test-taker’s language output is restricted to a series of monologic responses to recorded input. As such, there has been a general consensus among researchers that the speaking constructs assessed under the face-to-face condition are broader by tapping into both linguistic and social/interactional traits, whereas semi-direct tests are restricted to the assessment of the former (see Nakatsuhara et al. (2015) for more discussions). Although this argument applies more to paired and group speaking tests, direct speaking tests have the potential to tap into the construct of Interactional Competence (Kramsch, 1986), which is “distributed across participants” in a jointly co-constructed context (Young, 2011, p. 430).
However, the lack of visual information in the audio rating mode fails to make the best use of this advantage of direct tests, as the audio rater cannot fully understand the relationship between the test-taker, the examiner interlocutor and the context of the situation. Hence, it can be suggested that the extent to which the speaking ability constructs can be maximally assessed under the audio rating condition is constrained, somewhat moving towards the limited constructs measured in semi-direct tests.
At the same time, the findings of this study highlight that in order to embrace the rich constructs of direct speaking tests without raising scoring validity concerns,
it is highly essential to raise examiners’ awareness about the use of visual information and standardise to the ways in which visual information is interpreted to inform more accurate assessment of test-takers’ speaking performance.
The large volume of negative features noticed but used only in moderation in video rating, resulting in comparable scores to the live test scores, is of particular interest. It is noteworthy that examiners seemed able to provide more informed judgements under the video rating condition. They were able to assess test-takers’ performance based on rich visual information, but they did not have the time pressure they would normally have during the live exams, or when playing a dual role as interlocutor and assessor.
It was interesting that a number of examiners’ verbal reports related to the fluency and pronunciation features of test-taker performance. This could indicate the importance of visual information for assessing these features. In particular, visual information seemed to help examiners’ judgements on (un)willingness and sources of pauses in Fluency. In line with a general consensus on the significance of visual information in understanding pronunciation features known as the McGurk effect (e.g. McGurk and MacDonald, 1976), the availability of test-takers’ lip movement information gave the examiners more confidence in their assessment of Pronunciation.
As such, if double rating is to be introduced to the IELTS Speaking Test, it is recommended that the video mode be employed, as long as the test is intended to assess the wider constructs of face-to-face interaction that take account of paralinguistic and reciprocal features.
This research also has implications for current IELTS examiner training and standardisation. As one of the examiners who participated in this study commented in the verbal report sessions, the initial training is carried out with videos, while subsequent standardisation is with audios. This might require some reconsideration, since this research has suggested that audio rating is bound to assess narrower constructs and is likely to lead to harsher scores. Making the rating modes consistent by using videos would make training and standardisation of examiners more effective.
Although this study was relatively small-scale involving 36 test-takers and six examiners, the mixed-methods design of the study offers rich insights into examiners’ scores under the three rating conditions and their perceptions towards test-takers spoken performance in the two modes of non-live rating. It is hoped that the implications of this study will enhance the scoring validity of the IELTS Speaking Test in the future.
References
- American Educational Research Association (AERA), American Psychological Association (APA) and National Council of Measurement in Education (NCME) (1999). Standards for educational and psychological testing. AERA, Washington, DC.
- Bejar, I., Douglas, D., Jamieson, J., Nissan, S. and Turner, J. (2000). TOEFL 2000 listening framework: A working paper, (TOEFL Monograph Series Report No. 19) Educational Testing Service, Princeton, NJ.
- Brown, A. (2006). An examination of the rating process in the revised IELTS Speaking Test. IELTS Research Reports, vol 6, pp. 41-69. IELTS Australia and British Council.
- Brown, A., Iwashita, N. and McNamara, T. (2005). An examination of rater orientations and test-taker performance on English-for-academic-purposes speaking tasks (TOEFL Monograph Series No. MS-29) Educational Testing Service, Princeton, NJ.
- Burgoon, J. (1994). ‘Non-verbal signals’. In M. Knapp and G. Miller (Eds), Handbook of interpersonal communication, pp. 344-393. Routledge, London.
- Booth, D. (2003). Evaluating the success of the revised BEC (Business English Certificate) Speaking Tests, Cambridge Research Notes, vol 13, pp. 19-21.
- Conlan, C.J., Bardsley, W.N. and Martinson, S.H. (1994). A study of intra-rater reliability of assessments of live versus audio-recorded interviews in the IELTS Speaking component, unpublished study commissioned by the International Editing Committee of IELTS.
- Ducasse, A.M. (2010). Interaction in paired oral proficiency assessment in Spanish. Peter Lang, Frankfurt.
- ETS, n.d., Frequently asked questions about TOEFL Practice Online, retrieved on 26 June 2013 from: http://www.ets.org/s/toefl/pdf/toefl_tpo_faq.pdf
- Gass, S.M. and Mackey, A. (2000). Stimulated recall methodology in second language research. Lawrence Erlbaum, Mahwah, NJ.
- Guichon, N. and McLornan, S. (2008). ‘The effects of multimodality on L2 learners: Implications for CALL resource design’, System, vol 36, pp. 85-93.
- Isaacs, T. (2010). Issues and arguments in the measurement of second language pronunciation, unpublished PhD thesis, McGill University, Montreal.
- Kramsch, C. (1986). From language proficiency to interactional competence, Modern Language Journal, vol 70(4), pp. 366-372.
- Linacre, M. (2013). Facets computer program for many-facet Rasch measurement, version 3.71.3. Winsteps.com, Beaverton, Oregon.
- May, L. (2009). Co-constructed interaction in a paired speaking test: The rater’s perspective, Language Testing, vol 26(3), pp. 397-421.
- May, L. (2011). Interaction in a paired speaking test: The rater’s perspective. Peter Lang, Frankfurt.
- McGurk, H. and MacDonald, J. (1976). Hearing lips and seeing voices, Nature, vol 264, pp. 746-748.
- McNamara, T. (1997). ‘Interaction’ in second language performance assessment: whose performance? Applied Linguistics, vol 18, pp. 444-446.
- Nakatsuhara, F. (2012). The relationship between test-takers’ listening proficiency and their performance on the IELTS Speaking Test. In L. Taylor and C.J. Weir (Eds), IELTS Collected Papers 2: Research in reading and listening assessment, Studies in Language Testing 34, pp. 519-573. UCLES/Cambridge University Press, Cambridge.
- Nakatsuhara, F., Inoue, C., Berry, V. and Galaczi, E.D. (2016). Exploring performance across two delivery modes for the same L2 speaking test: Face-to-face and videoconferencing delivery: A preliminary comparison of test-taker and examiner behaviour, IELTS Partnership Research Papers 1, retrieved on 1 October 2016 from: https://www. ielts.org/teaching-and-research/research-reports/ielts-partnership-research-paper-1
- O’Sullivan, B. (2006). Issues in testing business English, Studies in Language Testing 17, UCLES/Cambridge University Press, Cambridge.
- Raffler-Engel, W. (1980). Kinesics and paralinguistics: A neglected factor in second language research and teaching, Canadian Modern Language Review, vol 36, pp. 225-237.
- Styles, P. (1993). Inter- and intra-rater reliability of assessments of ‘live’ versus audioand video-recorded interviews in the IELTS Speaking test. A report on a project conducted at the British Council centre in Brussels.
- Streeter, L., Bernstein, J., Foltz, P. and DeLand, D. (2011). Pearson’s Automated Scoring of Writing, Speaking, and Mathematics, retrieved on 21 June 2013 from: http://www.pearsonassessments.com/hai/images/tmrs/ PearsonsAutomatedScoringofWritingSpeakingandMathematics.pdf
- Taylor, L. (2007). The impact of the joint-funded research studies on the IELTS Speaking Module. In L. Taylor and P. Falvey (Eds), IELTS Collected Papers: Research in speaking and writing assessment, Studies in Language Testing 19, pp. 185-194. UCLES/ Cambridge University Press, Cambridge.
- Taylor, L. and Galaczi, E. (2011). Scoring validity. In L. Taylor (Ed), Examining speaking: Research and practice in assessing second language speaking, Studies in Language Testing 30, pp. 171-233. UCLES/Cambridge University Press, Cambridge.
- Wagner, E. (2008). Video Listening Tests: What Are They Measuring?, Language Assessment Quarterly, vol 5(3), pp. 218-243.
- Wagner, E. (2010). The effect of the use of video texts on ESL listening test-taker performance, Language Testing, vol 27, pp. 493-513.
- Xi, X. and Mollaun, P. (2009). How do raters from India perform in scoring the TOEFL iBT™ Speaking section and what kind of training helps? (TOEFL iBT Research Report RR-09-31), retrieved on 26 June 2013 from: https://www.ets.org/Media/Research/pdf/RR-09-31.pdf
- Young, R.F. (2011). Interactional competence in language learning, teaching, and testing. In E. Hinkel (Ed), Handbook of research in second language teaching and learning, vol 2, pp. 426-443. Routledge, New York, NY.
Appendix 1: An additional anlysis on test-takers’ raw scores in the two double-rating modes
To respond to the examiner reports on differential effects of visual information on test-takers of different proficiency levels (Section 5.3.2.2), an additional set of score analysis was undertaken.
Table 25 below shows raw score differences between audio and live rating modes and between video and live rating modes, and these differences were broken down to three proficiency level groups. The 36 test-takers were divided into three proficiency groups according to their live band scores: High (Band 6 and above), Middle (Bands 5 and 5.5) and Low (Band 4.5 and below).
It has to be borne in mind that this result is only suggestive, since this raw score analysis does not take other influential factors (e.g. examiner severity and examiner bias) into account. However, given the small sample size of this study and the complex matrix used for rating (see Tables 2 and 3), more sophisticated analysis was not feasible to lead to any meaningful interpretation. It was therefore thought that this simple frequency analysis with raw scores could offer some possible indications related to the examiner comments.
Table 25: Raw score differences between audio and live ratings and between video and live ratings in three proficiency level groups
| Score difference | Audio - live: all (N=36) | Audio - live: high (N=11) | Audio - live: middle (N=12) | Audio - live: low (N=13) | Video - live: all (N=36) | Video - live: high (N=11) | Video - live: middle (N=12) | Video - live: low (N=13) |
|---|---|---|---|---|---|---|---|---|
| -1.5 | 11 (30.6%) | 6 | 5 | - | 3 (8.3%) | 2 | - | 1 |
| -1.0 | 6 (16.7%) | 2 | 3 | 1 | 7 (19.4%) | 4 | 3 | - |
| -0.5 | 10 (27.8%) | 2 | 4 | 4 | 8 (22.2%) | 3 | 4 | 1 |
| 0 | 7 (19.4%) | 1 | - | 6 | 8 (22.2%) | 1 | 4 | 3 |
| +0.5 | 2 (5.6%) | - | - | 2 | 8 (22.2%) | 1 | 1 | 6 |
| +1.0 | - | - | - | - | 2 (5.6%) | - | - | 2 |
Note: High=Band 6 and above, Middle=Bands 5 and 5.5, Low=Band 4.5 and below (To calculate band scores which allow only half a band, average scores from different rating categories, examiners, parts of the test were rounded down.)
The frequency results in Table 25 do not seem to support the comments of Examiners E and F that visual information in the video-rating mode might have had negative effects on lower-level test-takers whereas it might have given positive effects on higher-level test-takers. The most negatively affected group in both the non-live rating modes was actually the high proficiency group, although less negative impact was observed in video ratings. The low proficiency group even seemed to have benefited under the video rating condition. However, as mentioned above, the frequency results here are only suggestive, and further investigations would be necessary with a larger dataset, using more sophisticated statistical analysis.