
A concordance study of CELPIP General and IELTS General Training
Official IELTS research report on Equivalency; Test comparisons, published in 2025.
Abstract
This report outlines a concordance study conducted between the CELPIP General and IELTS General Training tests. The focus is on IELTS General Training, rather than IELTS Academic, due to its closer alignment with the construct of the CELPIP test.
To ensure objectivity, the Australian Council for Educational Research (ACER) was commissioned to lead the analysis. The results presented in this report were prepared by ACER, with additional contributions from the research teams of both CELPIP and IELTS.
The report is structured as follows: it begins with a description of the two tests, followed by the methodology employed in the study, then breaks down the concordant results, and concludes with caveats for using the concordant results and references. The report presents concordance tables that compare CELPIP and IELTS scores across all test sections (Reading, Listening, Speaking, and Writing), as well as an overall score comparison. These concordance tables were derived using equipercentile equating procedures.
We advise caution when interpreting the results, particularly against using the concordance tables in isolation. Many factors can influence the concordance outcomes, including differences in how the tests assess language proficiency, variations in reporting scales, and the methodological choices made during the analysis. Additionally, differences in test-taker populations and small sample sizes at extreme score levels may lead to imprecise concordance results. Therefore, score users, including institutions that rely on these scores for decision-making, are advised to interpret the concordance tables with caution and to consider supplementary evidence to support their decisions.
It is important to note that the tests and their scores presented in this report do not replace the current English tests and scores accepted for Australian visa purposes, nor do they indicate acceptance of these tests and their scores by the Department of Home Affairs for Australian visa purposes in the future.
Keywords
- score concordance, score alignment
- CELPIP General
- IELTS General
- English language proficiency test, language assessment
1 Test descriptions
1.1 CELPIP General
The Canadian English Language Proficiency Index Program (CELPIP) General Test is a comprehensive assessment designed to evaluate communicative language proficiency essential for effective communication in general social, educational, and workplace contexts. Administered entirely via computer at secure test centres, CELPIP General consists of four components: Listening, Reading, Writing, and Speaking. The Listening and Reading components are computer-scored, while the Writing and Speaking components are recorded and evaluated through an online system by trained raters.
The Speaking component (15 minutes) includes eight tasks that cover a broad range of scenarios. Test-takers are required to describe personal experiences, offer advice, explain ideas, make predictions, persuade others, and justify their opinions.
The Writing component (53 minutes) consists of two tasks: composing an email and responding to a survey question. Both Speaking and Writing responses are evaluated across four key dimensions: Coherence/Meaning, Lexical Range, Readability (for Writing) or Listenability (for Speaking), and Task Fulfillment.
The Reading component (55-60 minutes) comprises a variety of texts, such as personal correspondence in diverse social or workplace contexts, expository articles on general interest topics, and argumentative editorials on more in-depth societal subjects. The CELPIP Reading items measure a range of skills, including global reading (e.g., understanding gist, topic, purpose, and main ideas), local reading (e.g., identifying discrete points, factual information, and supporting details), and inferential reading (e.g., recognising implied meanings, relationships, attitudes, and utterances).
The Listening component (47-55 minutes) includes conversations in diverse social and workplace settings, as well as monologues ranging from expository news reports to persuasive presentations on topics of general interest. The CELPIP Listening items assess a range of skills, including global listening (e.g., understanding gist, topic, purpose, and main ideas), local listening (e.g., identifying discrete points, factual information, and supporting details), and inferential listening (e.g., recognising implied meaning, relationships, attitudes, and utterances).
CELPIP provides individual scores for each component, as well as an overall average score, on a scale of 0-12.
1.2 IELTS General Training
The International English Language Testing System (IELTS) is an established high-stakes test based on longstanding principles of communicative assessment, designed to allow test-takers to develop and demonstrate their language skills and readiness to successfully participate in their chosen migration, training or workplace domain. IELTS is a multilevel test of language proficiency, divided into two modules (N.B. this study will focus only on the General Training section). The General Training module is used for test-takers who wish to migrate to a country where English is spoken, or who wish to train or study below degree level. It is a four-skills test, delivered in both paper-based and computer-based formats in secure test centres worldwide.
The Speaking section, conducted with an examiner (11-14 minutes in total), includes two dialogues and a monologue on a range of topics. The skills assessed include: the ability to communicate opinions and information on everyday topics and common experiences or situations by answering a range of questions (Part 1); the ability to speak at length on a given topic (without further prompts from the examiner) using appropriate language and organising ideas coherently (Part 2); and the ability to express and justify opinions, and to analyse, discuss, and speculate about issues (Part 3).
General training Writing (60 minutes) involves two tasks. Task 1 is based on responding to a given context (e.g., asking for information or explaining a situation). This is designed to assess candidates’ ability to: follow English writing conventions (i.e., what order to put information in, what style to use, how to start and finish a piece of writing); to use language accurately and appropriately; and to organise and link information coherently and cohesively. Task 2 involves discussing a point of view, argument or problem. It probes test-takers’ ability to: follow English discursive writing conventions (i.e., what order to put information in, what style to use, how to start and finish discursive writing, how to paragraph); to organise and link information coherently and cohesively; and to use language accurately and appropriately.
Reading (60 minutes) includes a variety of task types, including assessing test-takers’ ability to: read for gist or for main ideas; look for details or to follow a logical argument; and to recognise opinions and attitudes. Skills assessed include: detailed understanding of specific points; overall understanding of main ideas/themes; ability to recognise opinions or ideas; ability to skim and scan for specific information; ability to recognise relationships and connections between facts and make inferences; and ability to understand a detailed description and how it relates to information presented in the form of a diagram.
Listening (30 mins) involves comprehension of monologues and dialogues in various settings such as an educational context, and test-takers must demonstrate evidence that they can listen for gist or details, understand speakers’ opinions, follow development of ideas, and more. Skills assessed include: ability to gain detailed understanding of specific points; overall understanding of main points; recognising relationships and connections between facts; following a conversation; and understanding a detailed description, which includes language expressing spatial relationships and directions related to a visual input.
An overall IELTS score is given (Band 1 to Band 9), and a criterion score is provided for the Speaking and Writing sections. Each component is given an individual score - the overall band score is an aggregate of these scores combined. For increased transparency, both the Speaking and Writing sections are now marked using versions of publicly available scoring rubrics (the IELTS Band Descriptors).
2 Methodology
2.1 Data collection and analysis
Data collection took place between May 2023 and August 2024. A landing page was created on the CELPIP website, inviting CELPIP test-takers who had also taken or planned to take the IELTS General test to join a research study. Interested individuals completed an online application form to determine their eligibility. Those who qualified received either a free registration for the CELPIP/IELTS and/or a refund of their recent CELPIP test fee in exchange for providing their official IELTS General test report. Additionally, an online survey was administered to all eligible participants to gather information about their familiarity with both tests.
Participants who had already completed the IELTS test prior to joining the study were required to submit a copy of their official IELTS Test Report Form (TRF) or provide their TRF number for verification. For those who received a free IELTS test as part of the study, their scores were collected directly from the IELTS database. All CELPIP score data were collected directly from the CELPIP database using the registration numbers provided by participants.
Many applications were rejected for reasons such as distant test dates, incomplete submissions, duplicate applications, or participants failing to complete their free tests. In total, 1,089 participants completed both tests within a 90-day window. The effect of the test order on candidates’ test performances was examined, with no significant impact found. As a result, the final dataset consisted of 1,089 participants: Group A (587 participants who took IELTS first and CELPIP second) and Group B (502 participants who took CELPIP first and IELTS second).
Equipercentile procedures were performed for the four test sections and the overall scores, using the equate package (Albano, 2016). Prior to the concordance analysis, the sample was examined descriptively and the possible effect of the test-taking circumstances on the test scores (CELPIP and IELTS respectively) was investigated. Results showed the test order had no significant disadvantage to candidates and no substantial impact on their respective test scores was observed.
2.2 Data sample
The final sample consisted of 1,089 candidates who completed both the IELTS and CELPIP General tests. Among them, 1,072 (98.4%) reported taking the exam for immigration applications. This sample is reasonably representative of the population of visa applicants in Australia, as the test-takers’ motivations for taking the tests align closely. While the proportions of different citizenships and first language (L1) groups in this study may not perfectly mirror those of the broader population of Australia visa applicants, Tables 1 and 2 demonstrate the diversity within the sample, reflecting a wide range of nationalities and L1 backgrounds. Notably, the study sample includes candidates from countries that contribute the most permanent migrants to Australia, such as India, China, the Philippines, Vietnam, Pakistan, and Sri Lanka (Australian Government Department of Home Affairs, n.d.) 1.
Within the sample, 587 (53.9%) candidates took IELTS first. Survey responses from 843 participants (a response rate of 77.4%) showed that many used English in their daily activities, ranging from 44.2% studying English every day to 63.8% having conversations with English speakers every day. Regarding test familiarity, a higher number of participants felt familiar or very familiar with IELTS (Reading: 78.4%, Listening: 78.7%, Speaking: 79.2%, Writing: 77.2%) than with CELPIP (Reading: 59.1%, Listening: 57.4%, Speaking: 51%, Writing: 61.9%). Most participants reported preparing for up to four weeks before taking each test (63.8% for IELTS and 71.1% for CELPIP).
2.2.1 Demographics
The sample included 574 male (52.7%) and 515 female (47.3%) participants, ranging in age from 20 to 72, with an average age of 33.6 years. Their countries of citizenship and first languages are diverse, as summarised in Table 1 and Table 2, respectively. In total, 61 countries of citizenship were reported. Table 1 presents the countries of citizenship with 10 or more participants. Similarly, 59 languages were reported, with Table 2 listing the 27 languages with at least 10 participants each.
Table 1: Country of citizenship
| Category | Percentage (%) of the total sample |
|---|---|
| India | 28.6 |
| China | 18.0 |
| Nigeria | 10.9 |
| Philippines | 6.0 |
| Vietnam | 4.8 |
| Iran (Islamic Republic of) | 4.2 |
| Ukraine | 2.8 |
| Brazil | 2.7 |
| Korea, Republic of | 2.7 |
| Colombia | 1.9 |
| Pakistan | 1.7 |
| Japan | 1.4 |
| Mexico | 1.4 |
| Hong Kong, China | 1.2 |
| Turkey | 1.2 |
| Sri Lanka | 1.1 |
Table 2: First language
| Category | Percentage (%) of the total sample |
|---|---|
| Chinese | 15.2 |
| English | 12.3 |
| Hindi | 6.3 |
| Panjabi | 6.1 |
| Spanish | 5.3 |
| Vietnamese | 4.6 |
| Tagalog | 3.9 |
| Mandarin (Chinese) | 3.8 |
| Telugu | 3.1 |
| Gujarati | 2.7 |
| Korean | 2.7 |
| Portuguese | 2.6 |
| Tamil | 2.6 |
| Ukrainian | 2.6 |
| Malayalam | 2.5 |
| Yoruba | 2.3 |
| Farsi | 2.1 |
| Persian (Farsi) | 2.0 |
| Urdu | 2.0 |
| Japanese | 1.3 |
| Philippine (Other) | 1.3 |
| Arabic | 1.2 |
| Bengali | 1.2 |
| Turkish | 1.2 |
| Cantonese (Chinese) | 1.0 |
| Igbo | 1.0 |
| Russian | 1.0 |
2.3 Data evaluation
Table 3 summarises the descriptive statistics for each test section, and the overall scores for both the CELPIP and IELTS tests (N = 1,089). The table includes the mean, standard deviation (SD), observed maximum (Max), and minimum (Min) scores for each test.
CELPIP scores are reported on a scale from 0 to 12 for each section and the overall test, with scores increasing in one (1) point increments. IELTS reports for each section and the overall test are reported on a 9-band scale, with increments of one-half (0.5) bands.
Table 3: Descriptive summaries of CELPIP and IELTS
| Test | Section | Mean | SD | Min | Max |
|---|---|---|---|---|---|
| CELPIP | Reading | 7.91 | 2.22 | 1 | 12 |
| CELPIP | Listening | 8.67 | 2.07 | 2 | 12 |
| CELPIP | Speaking | 7.84 | 1.78 | 0 | 12 |
| CELPIP | Writing | 8.37 | 1.76 | 0 | 12 |
| CELPIP | Overall | 8.32 | 1.69 | 1 | 12 |
| IELTS | Reading | 6.74 | 1.42 | 1.0 | 9.0 |
| IELTS | Listening | 6.95 | 1.25 | 2.0 | 9.0 |
| IELTS | Speaking | 6.64 | 0.92 | 3.0 | 9.0 |
| IELTS | Writing | 6.33 | 0.66 | 2.5 | 8.5 |
| IELTS | Overall | 6.73 | 0.91 | 3.5 | 9.0 |
The score correlations between the two tests were found to be .71 for Reading, .71 for Listening, .72 for Speaking, .68 for Writing, and .84 for overall scores.
Given the observed score ranges, the spread of the candidates’ scores, the mean scores of the two tests, and the diverse language backgrounds of the participants, the current sample was considered a reasonable representation of the test-taker population of interest. The correlations between IELTS and CELPIP scores (both by section and overall) were moderate to strong.
Further, to explore any potential effect of test order (whether participants took IELTS or CELPIP first), a set of MANOVA (Multivariate Analysis of Variance) and ANOVA (Analysis of Variance) was conducted for each test. In a MANOVA, test order was defined as the independent variable, and the four sections of a test were defined as a set of dependent variables. A subsequent ANOVA involved test order as the independent variable and the overall score as the dependent variable. This procedure was applied to IELTS and CELPIP respectively. The results showed that the test order did not significantly explain test-takers’ test scores (the section scores and the overall score) and its effect was found to be small. Therefore, the study concluded that test order did not substantially disadvantage participants in either test.
3 Results
3.1 Concordance
Equipercentile procedures were employed for the four test sections and the overall scores to establish concordance between the two tests. This method has been used in studies linking between widely used English language tests, including Clesham and Hughes (2020) for PTE-IELTS, ETS (2010) for TOEFL-IELTS, Saville et al. (2021) for IELTS-PTE.
Given the relatively small sample size, pre-smoothing was deemed appropriate (Saville et al., 2021). Following the practice in Clesham and Hughes (2020), smoothing was done via a log-linear presmoothing technique under a single-group design.
Model fit of different log-linear models was evaluated using Akaike Information Criterion (i.e., AIC) (Akaike, 1981). All statistical operations were performed using an R package, equate (Albano, 2016). Figures 1 and 2 below show the smoothed (solid line) and unsmoothed (dash line) score distributions for each of the four sections, and the overall score for IELTS and those for CELPIP.

Figure 1: Distribution: IELTS

Figure 2: Distribution: CELPIP
The concordant results for the various proficiency levels are summarised in the tables below, comparing the Department of Home Affairs (DHA) proficiency levels 2 with the corresponding IELTS band scores and the CELPIP levels required for these DHA levels.
Table 4 presents the concordance results for Reading on the two tests. The first column lists the DHA proficiency levels, and the second column indicates the number of study participants classified at a particular DHA level based on the IELTS band they achieved. The IELTS bands required for classification at each DHA level are shown in the third column. It should be noted that the participant counts in the second column correspond to the DHA level, not just the minimum IELTS band required for that level. For example, 278 test-takers achieved IELTS band of either 6 or 6.5, placing them at the DHA Competent level (whereas the DHA Proficient level requires a minimum IELTS band of 7).
The fourth column lists the lowest CELPIP scores required for each DHA level. The last column shows the standard error (SE), defined as the standard deviation (SD) of all CELPIP scores divided by the square root of the sample size at the corresponding DHA proficiency levels.
Tables 5 through 8 present corresponding results for Listening, Speaking, Writing, and overall scores, respectively. These tables follow the same structure and should be interpreted in the same way as described for Table 4. The full results by IELTS half bands (4 to 9) are detailed in the appendix.
It is important to note that the findings presented in these tables and the appendix are not intended to replace the currently accepted English tests and scores required for Australian visa purposes, nor do they suggest any future acceptance by the Department of Home Affairs. Visa applicants should refer to the Department of Home Affairs’ current English language requirements for the specific visa subclass they wish to apply for.
Table 4: Concordance table for Reading
| DHA proficiency level | n | IELTS score | Minimum CELPIP score | SE |
|---|---|---|---|---|
| Below functional proficiency | 20 | 4 | 4 | 0.24 |
| Functional | 36 | 4.5 | 4 | 0.20 |
| Vocational | 59 | 5 | 5 | 0.19 |
| Visa-specific scores | 110 | 5.5 | 6 | 0.14 |
| Competent | 278 | 6 | 7 | 0.10 |
| Proficient | 285 | 7 | 8 | 0.09 |
| Superior | 268 | 8 | 10 | 0.09 |
Table 5: Concordance table for Listening
| DHA proficiency level | n | IELTS score | Minimum CELPIP score | SE |
|---|---|---|---|---|
| Below functional proficiency | 16 | 4 | 4 | 0.31 |
| Functional | 23 | 4.5 | 5 | 0.27 |
| Vocational | 51 | 5 | 5 | 0.24 |
| Visa-specific scores | 90 | 5.5 | 6 | 0.15 |
| Competent | 250 | 6 | 7 | 0.10 |
| Proficient | 331 | 7 | 9 | 0.08 |
| Superior | 315 | 8 | 10 | 0.07 |
Table 6: Concordance table for Speaking
| DHA proficiency level | n | IELTS score | Minimum CELPIP score | SE |
|---|---|---|---|---|
| Below functional proficiency | 6 | 4 | 3 | 0.37 |
| Functional | 15 | 4.5 | 4 | 0.24 |
| Vocational | 41 | 5 | 5 | 0.17 |
| Visa-specific scores | 78 | 5.5 | 6 | 0.14 |
| Competent | 461 | 6 | 7 | 0.06 |
| Proficient | 370 | 7 | 8 | 0.07 |
| Superior | 111 | 8 | 10 | 0.13 |
Table 7: Concordance table for Writing
| DHA proficiency level | n | IELTS score | Minimum CELPIP score | SE |
|---|---|---|---|---|
| Below functional proficiency | 5 | 4 | 3 | 0.51 |
| Functional | 12 | 4.5 | 4 | 0.36 |
| Vocational | 37 | 5 | 5 | 0.24 |
| Visa-specific scores | 98 | 5.5 | 6 | 0.12 |
| Competent | 678 | 6 | 7 | 0.05 |
| Proficient | 241 | 7 | 10 | 0.10 |
| Superior | 16 | 8 | 12 | 0.22 |
Table 8: Concordance table for Overall
| DHA proficiency level | n | IELTS score | Minimum CELPIP score | SE |
|---|---|---|---|---|
| Below functional proficiency | 9 | 4 | 4 | 0.00 |
| Functional | 26 | 4.5 | 5 | 0.14 |
| Vocational | 29 | 5 | 5 | 0.18 |
| Visa-specific scores | 64 | 5.5 | 6 | 0.10 |
| Competent | 365 | 6 | 7 | 0.06 |
| Proficient | 468 | 7 | 9 | 0.05 |
| Superior | 122 | 8 | 11 | 0.08 |
3.2 Population invariance
Population invariance was explored to evaluate the adequacy of the linking process. The full sample was split into two groups: male participants (n = 574) and female participants (n = 515). Additionally, population invariance was investigated by another variable - test order - dividing the whole sample into participants who took IELTS first (n = 587) and those who took CELPIP first (n = 502). Although other background variables, such as first language (L1), were available, the resulting groups were either unbalanced and/or too small for meaningful analysis. Therefore, the analysis was conducted using gender and test order as the grouping variables, respectively.
The equated CELPIP scores (unrounded) across the IELTS band levels were estimated separately for each group (male vs. female, IELTS-first vs. CELPIP-first) and compared to the corresponding estimates from the whole group. Polynomial log-linear presmoothing was performed, where the best model was selected for the group membership by referring to the AIC values.
Figures 3 and 4 visually present the differences in equivalents (each membership and the whole sample). Although the differences are more noticeable at IELTS Bands 4 and below (depending on the section), the two sub-groups and the whole sample produced reasonably similar tendencies (in terms of increase of CELPIP scores across IELTS Bands) across the four sections and the overall scores. Also note that IELTS Bands 4 and below are outside the targeted language proficiency range for immigration purposes.
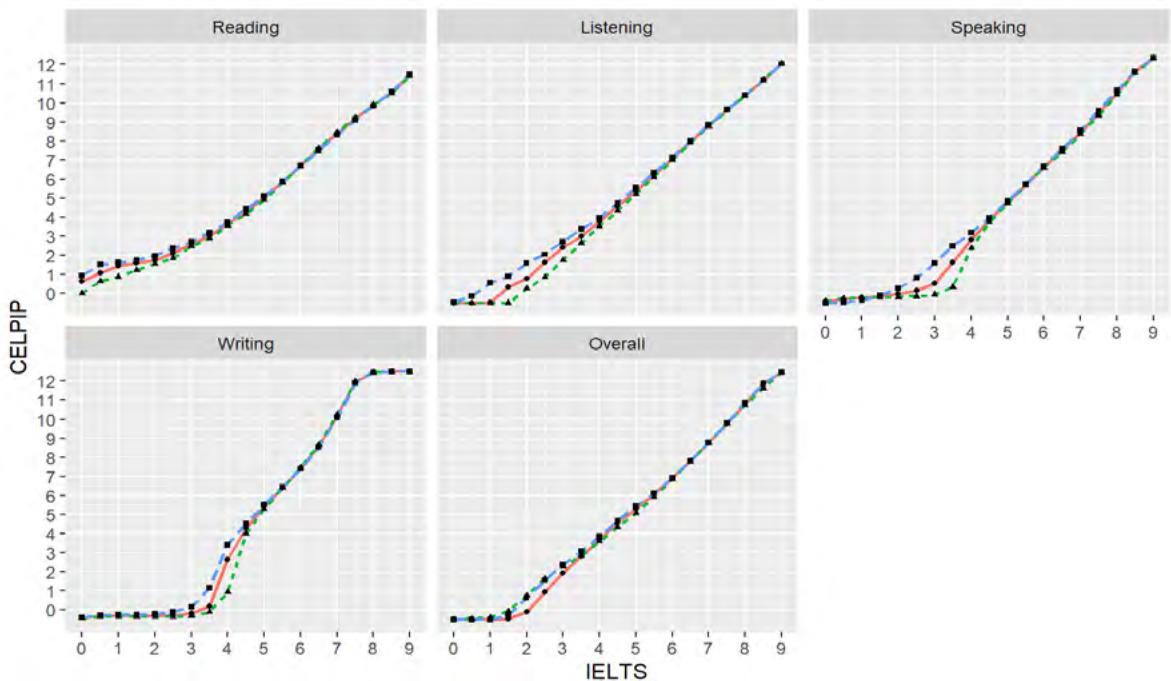
Figure 3: Unrounded CELPIP equipercentile equivalents (by gender)

Figure 4: Unrounded CELPIP equipercentile equivalents (by test order)
4 Conclusions and implications for score use
This report describes our collective research efforts undertaken to design and implement a robust concordance study. The involvement of ACER in this process has added an extra layer of independent analysis, enhancing the credibility of both the findings and the report.
It is important to clarify that the findings presented here do not replace existing English language test requirements or scores currently accepted for Australian visa purposes. Nor should they be interpreted as indicative of future acceptance by the Department of Home Affairs.
4.1 Limitations
As with any research, particularly in the context of concordance studies, limitations must be acknowledged to maintain transparency. When interpreting specific score conversions in concordance studies, several important factors should be considered to ensure accurate and fair use of the results. First, the accuracy of score conversions may vary, especially at the extremes of the score range. Concordance at intermediate score levels (i.e., mid-range proficiency) tends to be more reliable due to the availability of more data and consistent measurement. In contrast, extreme scores, whether very high or very low, are often based on fewer observations, leading to potential variability in the accuracy of linkages. In this study, the observed ranges for IELTS Speaking and overall scores were somewhat restricted. While it would have been desirable to include candidates with scores below IELTS 3.5, the practical challenges of recruiting such participants were considerable due to the natural distribution of scores within the population.
Moreover, the design and content of the tests influence score levels and concordance. Although IELTS and CELPIP share certain similarities in item types and test constructs, differences in test format, scoring scales, and the emphasis on specific skills lead to discrepancies in score alignment. It is important to note that scores from one test do not directly map to scores from another, even when both tests aim to measure related constructs.
4.2 Guidance for score users
For score users, such as institutions who use certain test scores for decisions about test-takers, it is vital to approach score comparisons across tests with caution. While these comparisons are based on empirical research, they should be regarded solely as estimates for the following reasons.
- Tests differ, sometimes significantly, in the ways information about English language ability is elicited and assessed. Score comparisons are only meaningful to the extent that the tests are measuring the same ability or skill.
- Tests often differ in the length of the reporting scales used (e.g., one test may report on a 6-point scale and another on a 100-point scale). As a result, a one-to-one mapping of scores from one test to another is rarely possible.
- The choice of concordance study methodology may produce variations in results.
- The populations of test-takers may differ (e.g., with respect to ages, nationalities, language background of test-takers) from the population used in the research that generated the score equivalences.
- The sample sizes used for comparing scores from different tests are generally small across all levels/ranges, especially at extreme ends of the scale.
- Score concordance results are generally more robust for proficiency levels with larger numbers of test-takers.
- Large standard errors show that score equivalences are particularly imprecise at certain points on the ability scale.
Because the score comparisons presented in the tables are indicative only, score users are advised not to rely solely on published score equivalences in making their decisions. They should weigh evidence from additional sources where feasible.
References
- Akaike, H. (1981). Likelihood of a model and information criteria. Journal of Econometrics, 16(1), 3-14. https://doi.org/10.1016/0304-4076(81)90071-3
- Albano, A. D. (2016). equate: An R package for observed-score linking and equating. Journal of Statistical Software, 74(8), 1-36. https://doi.org/10.18637/jss.v074.i08
- Australian Government Department of Home Affairs. (n.d.). Australia’s Migration Program - Country Ranking 2022-23. https://www.homeaffairs.gov.au/research-and-stats/files/country-position-2022-23.PDF
- Clesham, R. & Hughes, S. R. (2020). 2020 Concordance Report: PTE Academic and IELTS Academic. Pearson.
- ETS. (2010). Linking TOEFL iBT Scores to IELTS Scores - A Research Report. ETS.
- Saville, N., O’Sullivan, B, & Clark. T. (Eds.) (2021). Investigating the relationship between IELTS and PTE-Academic. IELTS Partnership Research Papers: Studies in Test Comparability Series, No. 2. IELTS Partners: British Council, Cambridge Assessment English, & IDP: IELTS Australia. https://ielts.org/researchers/our-research/research-reports/investigating-the-relationship-between-pte-academic-and-ielts-academic
Appendix: Concordance tables using IELTS as the reference
Concordance tables by half-band increments of IELTS scores for the four section scores and the total score are provided in Tables 9 to 13. These results do not replace currently accepted English language tests and their scores for Australian visa purposes, nor do they suggest future acceptance by the Department of Home Affairs.
We recommend exercising caution when interpreting the results, in particular avoiding reliance on the concordance tables in isolation. Concordance outcomes can be influenced by various factors, including differences in how the tests measure language proficiency, variations in reporting scales, and methodological decisions made during analysis. Additionally, discrepancies in test-taker populations and small sample sizes at extreme score levels may result in less precise concordance outcomes. Consequently, score users - including institutions using these scores for decision-making - are advised to interpret the concordance tables carefully and consider additional evidence to support their decisions.
Table 9: Concordance table for Reading (IELTS half-band levels)
| IELTS score | n | Minimum CELPIP score | SE |
|---|---|---|---|
| 9.0 | 102 | 11 | 0.11 |
| 8.5 | 76 | 11 | 0.19 |
| 8.0 | 90 | 10 | 0.17 |
| 7.5 | 128 | 9 | 0.15 |
| 7.0 | 157 | 8 | 0.12 |
| 6.5 | 161 | 8 | 0.13 |
| 6.0 | 117 | 7 | 0.15 |
| 5.5 | 110 | 6 | 0.14 |
| 5.0 | 59 | 5 | 0.19 |
| 4.5 | 36 | 4 | 0.20 |
| 4.0 | 20 | 4 | 0.24 |
Table 10: Concordance table for Listening (IELTS half-band levels)
| IELTS score | n | Minimum CELPIP score | SE |
|---|---|---|---|
| 9.0 | 50 | 12 | 0.16 |
| 8.5 | 123 | 11 | 0.11 |
| 8.0 | 142 | 10 | 0.11 |
| 7.5 | 194 | 10 | 0.10 |
| 7.0 | 137 | 9 | 0.12 |
| 6.5 | 129 | 8 | 0.14 |
| 6.0 | 121 | 7 | 0.15 |
| 5.5 | 90 | 6 | 0.15 |
| 5.0 | 51 | 5 | 0.24 |
| 4.5 | 23 | 5 | 0.27 |
| 4.0 | 16 | 4 | 0.31 |
Table 11: Concordance table for Speaking (IELTS half-band levels)
| IELTS score | n | Minimum CELPIP score | SE |
|---|---|---|---|
| 9.0 | 14 | 12 | 0.17 |
| 8.5 | 32 | 12 | 0.23 |
| 8.0 | 65 | 10 | 0.17 |
| 7.5 | 143 | 9 | 0.11 |
| 7.0 | 227 | 8 | 0.09 |
| 6.5 | 277 | 8 | 0.07 |
| 6.0 | 184 | 7 | 0.09 |
| 5.5 | 78 | 6 | 0.14 |
| 5.0 | 41 | 5 | 0.17 |
| 4.5 | 15 | 4 | 0.24 |
| 4.0 | 6 | 3 | 0.37 |
Table 12: Concordance table for Writing (IELTS half-band levels)
| IELTS score | n | Minimum CELPIP score | SE |
|---|---|---|---|
| 9.0 | - | 12 | - |
| 8.5 | 2 | 12 | 0.50 |
| 8.0 | 14 | 12 | 0.25 |
| 7.5 | 52 | 12 | 0.18 |
| 7.0 | 189 | 10 | 0.11 |
| 6.5 | 358 | 9 | 0.07 |
| 6.0 | 320 | 7 | 0.06 |
| 5.5 | 98 | 6 | 0.12 |
| 5.0 | 37 | 5 | 0.24 |
| 4.5 | 12 | 4 | 0.36 |
| 4.0 | 5 | 3 | 0.51 |
Table 13: Concordance table for Overall (IELTS half-band levels)
| IELTS score | n | Minimum CELPIP score | SE |
|---|---|---|---|
| 9.0 | 1 | 12 | - |
| 8.5 | 20 | 12 | 0.13 |
| 8.0 | 101 | 11 | 0.09 |
| 7.5 | 202 | 10 | 0.07 |
| 7.0 | 266 | 9 | 0.05 |
| 6.5 | 208 | 8 | 0.07 |
| 6.0 | 157 | 7 | 0.08 |
| 5.5 | 64 | 6 | 0.10 |
| 5.0 | 29 | 5 | 0.18 |
| 4.5 | 26 | 5 | 0.14 |
| 4.0 | 9 | 4 | 0.00 |
Author biodata
Dr Naoki Ikeda is a Research Fellow (Psychometrics) at the Australian Council for Educational Research (ACER), where he undertakes psychometric analyses focusing on school-level assessments and high-stakes professional credentialing examinations. He also serves as a facilitator for training courses on Educational Measurement for people working on quantitative data in education.
Dr Michelle Chen is Manager of Psychometrics at Prometric, overseeing the language assessment portfolio, including the CELPIP and the Canadian Academic English Language (CAEL) Test. She designs and conducts research studies to inform the development, implementation, and ongoing validation of these assessments. She also collaborates with credentialing organisations to provide psychometric expertise in support of their assessment programs.
Dr Tony Clark is the Head of IELTS Research at Cambridge University Press & Assessment. He leads a team of researchers providing evidence-based guidance to support IELTS. He has served on the UK Association for Language Testing and Assessment (UKALTA) Executive Board since 2020 and is a Visiting Industrial Professor at the University of Bristol.